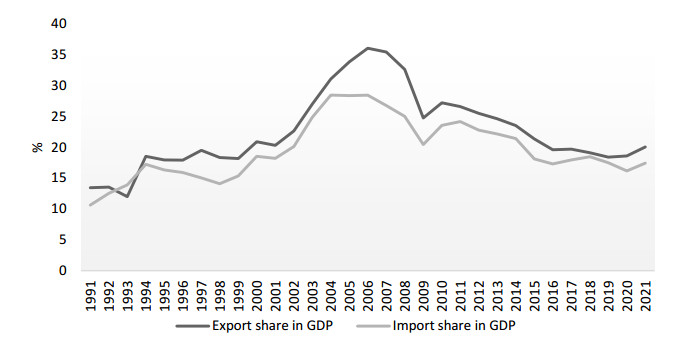
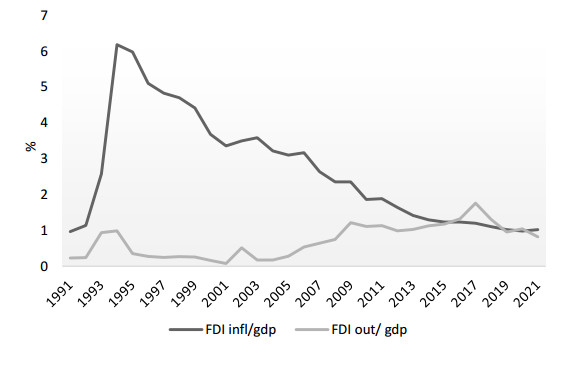
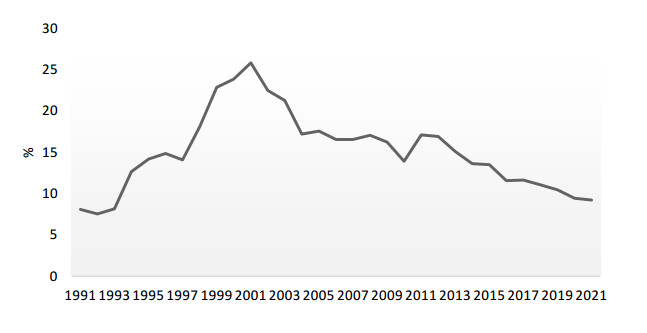
This paper analyses the causes of the downward trend in three key cohesion aspects of the world economy: international trade, foreign investment and global value chains. The paper shows that the causes of these trends are not cyclical, but structural; that is, it is the process of deglobalization of the international market, and transformation of the very foundation of the international economic system is underway. The specific aim of the study was to investigate the impact of current trends on China's economy. The question is whether the Chinese economy, which has developed due to globalization processes, will be negatively affected by reverse processes, and to what extent. To capture the short-run effect of globalization-related factors on China's economy, an autoregressive distributed lag (ARDL) model was used. For estimation of the long-run linkage, the ARDL bounds testing approach to cointegration was launched. The results of testing the short-term effects showed that the new Chinese development strategy, aimed at protecting domestic economy from external disturbances, has produced excellent results. Significant changes in the Chinese development paradigm, as based on domestic production to meet domestic demand and financed by internal resources, have led to a decrease in the share of all international indicators in the Chinese economy. This is shown by both the statistical description of changes in the globalization-related variables, and it is confirmed by the results of conducted empirical research. Testing of long-term relationships has given conflicting results, so it is not possible to identify the long-term impact with certainty. Nevertheless, the parts of bounds testing that are statistically indisputable indicate a long-term, strong cumulative impact of these variables on the Chinese economy, while the direction and intensity of the action of individual variables are unpredictable. A new paradigm enables China to take a better international position as a global investor instead of a recipient of investments, to take over growing parts of global product chains instead of being their production link and to initiate a new form of globalization in the Chinese way.
Citation: Nataša Stanojević, Katarina Zakić. China and deglobalization of the world economy[J]. National Accounting Review, 2023, 5(1): 67-85. doi: 10.3934/NAR.2023005
This paper analyses the causes of the downward trend in three key cohesion aspects of the world economy: international trade, foreign investment and global value chains. The paper shows that the causes of these trends are not cyclical, but structural; that is, it is the process of deglobalization of the international market, and transformation of the very foundation of the international economic system is underway. The specific aim of the study was to investigate the impact of current trends on China's economy. The question is whether the Chinese economy, which has developed due to globalization processes, will be negatively affected by reverse processes, and to what extent. To capture the short-run effect of globalization-related factors on China's economy, an autoregressive distributed lag (ARDL) model was used. For estimation of the long-run linkage, the ARDL bounds testing approach to cointegration was launched. The results of testing the short-term effects showed that the new Chinese development strategy, aimed at protecting domestic economy from external disturbances, has produced excellent results. Significant changes in the Chinese development paradigm, as based on domestic production to meet domestic demand and financed by internal resources, have led to a decrease in the share of all international indicators in the Chinese economy. This is shown by both the statistical description of changes in the globalization-related variables, and it is confirmed by the results of conducted empirical research. Testing of long-term relationships has given conflicting results, so it is not possible to identify the long-term impact with certainty. Nevertheless, the parts of bounds testing that are statistically indisputable indicate a long-term, strong cumulative impact of these variables on the Chinese economy, while the direction and intensity of the action of individual variables are unpredictable. A new paradigm enables China to take a better international position as a global investor instead of a recipient of investments, to take over growing parts of global product chains instead of being their production link and to initiate a new form of globalization in the Chinese way.

| [1] | Baldwin R, Martin P (1999) Two waves of globalization: Superficial similarities, fundamental differences. NBER Working Paper 6904. |
| [2] | Bello W (2005) Deglobalization: Ideas for a New World Economy, London and New York: Zed Books Ltd. |
| [3] | Bordo M (2017) The Second Era of Globalization is Not Yet Over: An Historical Perspective. NBER Working paper 23786. |
| [4] | Boz E, Bussière M, Marsilli C (2015) Recent slowdown in global trade: Cyclical or structural? In: Hoekman, B., The Global Trade Slowdown: A New Normal? London: Centre for Economic Policy Research. |
| [5] | Constantinescu C, Matoo A, Ruta M (2015) Global Trade Slowdown, In: Hoekman, B., The Global Trade Slowdown: A New Normal? London: Centre for Economic Policy Research. |
| [6] | Engle R, Granger G (1987) Cointegration and Error Correction: Representation, Estimation and Testing. Econometrica 55: 251–276. |
| [7] |
Evenett S (2019) Protectionism, state discrimination, and international business since the onset of the Global Financial Crisis. J Int Bus Policy 2: 9–36. https://doi.org/10.1057/s42214-019-00021-0 doi: 10.1057/s42214-019-00021-0

|
| [8] | Frankel J (2000) Globalization of the economy. NBER Working paper 7858. |
| [9] | Gereffi G (2018) Global Value Chains and Development—Redefining the Contours of 21st Century Capitalism. Cambridge: Cambridge University Press. |
| [10] | Granger CWJ (1981) Some Properties of Time Series Data and Their Use in Econometric Model Specification. Journal of Econometrics 28: 121–130. |
| [11] | Greene W (2003) Econometric analysis. Fifth edition. New Jersey: Prentice hall. |
| [12] |
Henderson J, Appelbaum RP, Ying Ho S (2013) Globalization with Chinese Characteristics: Externalization, Dynamics and Transformations. Dev Change 44: 1221–1253. https://doi.org/10.1111/dech.12066 doi: 10.1111/dech.12066
|
| [13] | Jacoby D (2018) Trump, Trade, and the End of Globalization, Santa Barbara and Denver: Praeger. |
| [14] | James H (2001) The End of Globalization—Lessons from the Great Depression, Cambridge: Harvard University Press. |
| [15] | James H (2017) Deglobalization as a Global Challenge. CIGI Papers 135. |
| [16] | Jenkins R (2019) How China is Reshaping the Global Economy: Development Impacts in Africa and Latin America. Oxford: Oxford University Press. |
| [17] | Joshua J (2019) The Belt and Road Initiative and the Global Economy—Trade and Economic Development, Cham: Palgrave Macmillan. |
| [18] |
Kee HL, Tang H (2016) Domestic value added in exports: Theory and firm evidence from China. Am Econ Rev 106: 1402–1436. https://doi.org/10.1257/aer.20131687 doi: 10.1257/aer.20131687
|
| [19] | Lewis L, Monarch R (2016) Causes of the Global Trade Slowdown. https://doi.org/10.17016/2573-2129.25 |
| [20] | Nkoro E, Uko AK (2016) Autoregressive Distributed Lag (ARDL) cointegration technique: application and interpretation. J Stat Economet Methods 5: 63–91. |
| [21] | Obstfeld M, Taylor A (2002) Globalization and Capital Markets. In: Bordo, M., Taylor, A., Williamson, J., Globalization in Historical Perspective, Chicago: University of Chicago Press. |
| [22] | OECD (2018) Trade in Value Added. Available from: https://www.oecd.org/industry/ind/measuring-trade-in-value-added.htm#country-notes. |
| [23] | Pesaran MH, Smith RJ, Shin Y (2001) Bounds Testing Approaches to the Analysis of Level Relationships. J Appl Econ 16: 289–326. https://doi.org/10.1002/jae.616 |
| [24] | Ramo JC (2004) The Beijing Consensus: Notes on the New Physics of Chinese Power, London: Foreign Policy Centre. |
| [25] | Hanemann T, Gao C, Lysenko A (2019) Net negative: Chinese Investment in the US 2018. Available from: https://rhg.com/research/chinese-investment-in-the-us-2018. |
| [26] | Sachs J, Warner A (1995) Economic reform and the process of global integration. Brookings Pap Econ Act 1: 1–118. |
| [27] |
Stanojevic N, Kotlica S (2018) Globalization and Methodology of Researches in International Trade. Industrija 2: 21–38. https://doi.org/10.5937/industrija46-15888 doi: 10.5937/industrija46-15888
|
| [28] | Stanojević N (2022) The Dual Circulation strategy: China's response to declining international economic connectivity, In: Liu, Z.K., Branislav, Đ., The Connectivity Cooperation Between China and Europe, Routledge, Taylor & Francis Ltd, 106–129. https://doi.org/10.4324/b22839-9 |
| [29] | Taylor A (1996) International capital mobility in history: the savings-investment relationship. NBER Working Paper 5743. |
| [30] | UNCTAD (2018) Eora Global Value Chain database. Available from: https://worldmrio.com/unctadgvc. |
| [31] | UNCTAD (2018) World Investment Report—Investment and New Industrial Policies. Available from: https://unctad.org/publication/world-investment-report-2018. |
| [32] | UNCTAD (2019a) World Investment Report—Special Economic Zones. Available from: https://unctad.org/system/files/official-document/wir2019_en.pdf. |
| [33] | UNCTAD (2019b) Global investment trend monitor 32. Available from: https://investmentpolicy.unctad.org/publications/1209/global-investment-trends-monitor-no-32. |
| [34] | UNCTADstat database (2019) Available from: https://unctadstat.unctad.org/EN/. |
| [35] | United Nation (2019) United Nations Convention on International Settlement Agreements Resulting from Mediation. |
| [36] | Williamson J (2005) Winners and Losers over Two Centuries of Globalization. In: UNU-WIDER, Wider Perspectives on Global Development, London: Palgrave Macmillan, 136–174. |
| [37] | World Bank Indicators (2022) Available from: https://data.worldbank.org/indicator. |
| [38] | World Trade Organization (2019) Report on G20 trade measures. Available from: https://www.wto.org/english/news_e/news19_e/report_trdev_21nov19_e.pdf. |
 NAR-05-01-005-s001.pdf NAR-05-01-005-s001.pdf |
 |
Figures(3) / Tables(3)

Nataša Stanojević, Katarina Zakić. China and deglobalization of the world economy[J]. National Accounting Review, 2023, 5(1): 67-85. doi: 10.3934/NAR.2023005


 DownLoad: