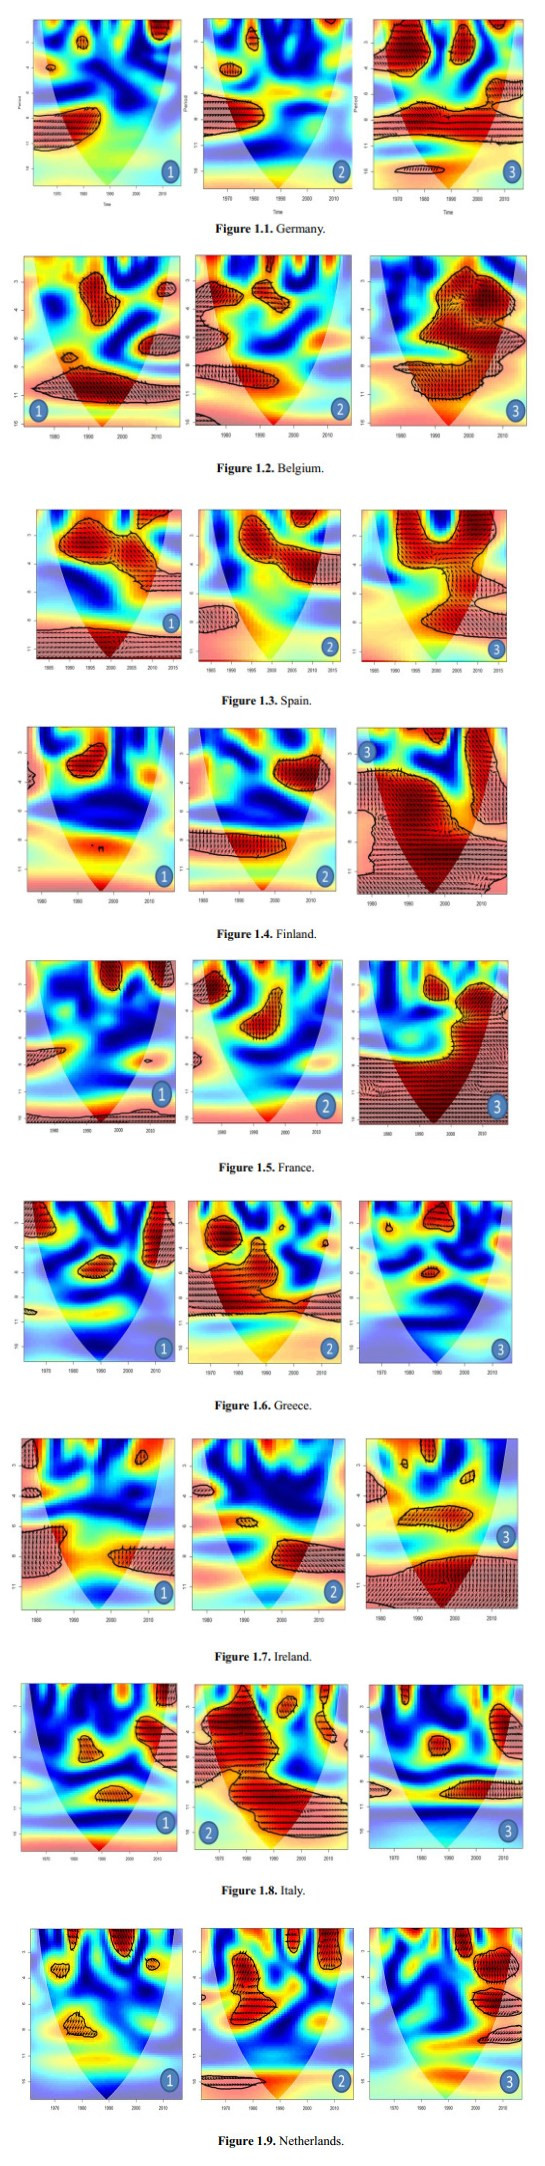
In this paper, continuous wavelet decompositions regarding the notions of coherence and phase are used to analyze the time-frequency dynamics of the existing relationships between energy supply and economic growth for a group of European countries. The objective is to identify both the intensity and the direction of the relationship over time and across frequencies. We also study the existence of a debt channel implying an indirect relationship between energy and growth. Our results show the complexity of the energy supply-growth relationship composed by direct effect at the short run and indirect effects through debt channel at the mid and long run. The countries with the highest debt/GDP ratio are more subject to such direct and indirect effects than others where only short run direct effect is noted.
Citation: Mohamed AWADA, Roman MESTRE. Revisiting the Energy-Growth nexus with debt channel. A wavelet time-frequency analysis for a panel of Eurozone-OECD countries[J]. Data Science in Finance and Economics, 2023, 3(2): 133-151. doi: 10.3934/DSFE.2023008
In this paper, continuous wavelet decompositions regarding the notions of coherence and phase are used to analyze the time-frequency dynamics of the existing relationships between energy supply and economic growth for a group of European countries. The objective is to identify both the intensity and the direction of the relationship over time and across frequencies. We also study the existence of a debt channel implying an indirect relationship between energy and growth. Our results show the complexity of the energy supply-growth relationship composed by direct effect at the short run and indirect effects through debt channel at the mid and long run. The countries with the highest debt/GDP ratio are more subject to such direct and indirect effects than others where only short run direct effect is noted.

| [1] | Abaidoo R (2011) Economic growth and energy consumption in an emerging economy: augmented granger causality approach. Res Bus Econ J 4: 1. |
| [2] |
Aguiar-Conraria L, Soares J (2011) Oil and the macroeconomy: using wavelets to analyze old issues. Empirical Econ 40: 645–655. https://doi.org/10.1007/s00181-010-0371-x doi: 10.1007/s00181-010-0371-x

|
| [3] |
Aguiar-Conraria L, Azevedo N, Soares J (2008) Using wavelets to decompose the time–frequency effects of monetary policy. Physica A 387: 2863–2878. https://doi.org/10.1016/j.physa.2008.01.063 doi: 10.1016/j.physa.2008.01.063
|
| [4] |
Aizenman J, Kletzer K, Pinto B (2007) Economic growth with constraints on tax revenues and public debt: implications for fiscal policy and cross-country differences. SSRN Journal. http://dx.doi.org/10.2139/ssrn.1282276 doi: 10.2139/ssrn.1282276
|
| [5] |
Akinlo A (2008) Energy consumption and economic growth: Evidence from 11 Sub-Sahara African countries. Energy econ 30: 2391–2400. https://doi.org/10.1016/j.eneco.2008.01.008 doi: 10.1016/j.eneco.2008.01.008
|
| [6] |
Algieri B (2014) Drivers of export demand: A focus on the GIIPS countries. World Econ 37: 1454–1482. https://doi.org/10.1111/twec.12153 doi: 10.1111/twec.12153
|
| [7] |
Altinay G, Erdal K (2005) Electricity consumption and economic growth: evidence from Turkey. Energy Econ 27: 849–856. https://doi.org/10.1016/j.eneco.2005.07.002 doi: 10.1016/j.eneco.2005.07.002
|
| [8] |
Apergis N, Payne J (2010) Renewable energy consumption and economic growth: evidence from a panel of OECD countries. Energy Policy 38: 656–660. https://doi.org/10.1016/j.enpol.2009.09.002 doi: 10.1016/j.enpol.2009.09.002
|
| [9] |
Asafu-Adjaye J (2000) The relationship between energy consumption, energy prices and economic growth: time series evidence from Asian developing countries. Energy Econ 22: 615–625. https://doi.org/10.1016/S0140-9883(00)00050-5 doi: 10.1016/S0140-9883(00)00050-5
|
| [10] | Behname M (2012) La consommation d'energie renouvelable et la croissance economique dans l'europe de l'ouest. Romanian J Econ 2: 160–171. |
| [11] | Bekiros S, Nguyen DK, Uddin GS, et al. (2016) On the time scale behavior of equity-commodity links: Implications for portfolio management. J Int Financ Mark I 41: 30–46. |
| [12] |
Bell A, Ron J, Kelvyn J (2015) Stylised fact or situated messiness? The diverse effects of increasing debt on national economic growth. J Econ Geogr 15: 449–472. https://doi.org/10.1093/jeg/lbu005 doi: 10.1093/jeg/lbu005
|
| [13] |
Belke A, Dobnik F, Dreger C (2011) Energy consumption and economic growth: New insights into the cointegration relationship. Energy Econ 33: 782–789. https://doi.org/10.1016/j.eneco.2011.02.005 doi: 10.1016/j.eneco.2011.02.005
|
| [14] | Benassy-Quere A (2017) La zone euro enquête de coordination. Revue d'économie financière 2017: 209–224. |
| [15] | Carminel T (2015) L'impossible découplage entre énergie et croissance. Économie de l'après croissance. Politiques de l'Anthropocène II, Paris, Presses de Sciences Po, 97–115. |
| [16] |
Checherita-Westphal C, Philipp R (2012) The impact of high government debt on economic growth and its channels: An empirical investigation for the euro area. Eur Econ Rev 56: 1392–1405. https://doi.org/10.1016/j.euroecorev.2012.06.007 doi: 10.1016/j.euroecorev.2012.06.007
|
| [17] |
Chen ST, Kuo HI, Chen CC (2007) The relationship between GDP and electricity consumption in 10 Asian countries. Energy Policy 35: 2611–2621. https://doi.org/10.1016/j.enpol.2006.10.001 doi: 10.1016/j.enpol.2006.10.001
|
| [18] | Cheng BS (1995) An investigation of cointegration and causality between energy consumption and economic growth. J Energy Dev 21: 73–84. |
| [19] |
Cochrane JH (2011) Understanding policy in the great recession: Some unpleasant fiscal arithmetic. Eur Econ Rev 55: 2–30. https://doi.org/10.1016/j.euroecorev.2010.11.002 doi: 10.1016/j.euroecorev.2010.11.002
|
| [20] |
Codogno L, Favero C, Missale A (2003) Yield spreads on EMU government bonds. Econ Policy 18: 503–532. https://doi.org/10.1111/1468-0327.00114_1 doi: 10.1111/1468-0327.00114_1
|
| [21] | Daubechies I (1992) Ten lectures on wavelets, Conference Series of Applied mathematics in Philadelphia, Society for industrial and applied mathematics. |
| [22] |
Destek M (2016) Renewable energy consumption and economic growth in newly industrialized countries: Evidence from asymmetric causality test. Renew Energ 95: 478–484. https://doi.org/10.1016/j.renene.2016.04.049 doi: 10.1016/j.renene.2016.04.049
|
| [23] | Diamond PA (1965) National debt in a neoclassical growth model. Am Econ Rev 55: 1126-1150. |
| [24] |
Dos Santos G, Cardoso Marques JA, Fuinhas JA (2017) The traditional energy-growth nexus: A comparison between sustainable development and economic growth approaches. Ecol Indi 75: 286–296. https://doi.org/10.1016/j.ecolind.2016.12.048 doi: 10.1016/j.ecolind.2016.12.048
|
| [25] |
Efthimiadis T, Tsintzos P (2023) From Debt to Green Growth: A Policy Proposal. Sustainability 15: 3506. https://doi.org/10.3390/su15043506 doi: 10.3390/su15043506
|
| [26] |
Eichengreen B, Leblang D (2003) Capital account liberalization and growth: was Mr.Mahathir right? Int J Financ Econ 8: 205–224. https://doi.org/10.1002/ijfe.208 doi: 10.1002/ijfe.208
|
| [27] |
Elmendorf DW, Mankiw G (1999) Government debt. Handbook of Macroecon 1: 1615–1669. https://doi.org/10.1016/S1574-0048(99)10038-7 doi: 10.1016/S1574-0048(99)10038-7
|
| [28] | Erol U, Yu E (1987) On the causal relationship between energy and income for industrialized countries. J Energy Dev 1987: 113–122. |
| [29] |
Farge M (1992) Wavelets Transforms and their applications to turbulence. Annul Rev Fluid Mech 24: 395–458. https://doi.org/10.1146/annurev.fl.24.010192.002143 doi: 10.1146/annurev.fl.24.010192.002143
|
| [30] |
Feldstein M (2014) How to achieve stronger US growth. J Policy Model 36: 649–653. https://doi.org/10.1016/j.jpolmod.2014.03.007 doi: 10.1016/j.jpolmod.2014.03.007
|
| [31] | Ferreira M (2009) Public debt and economic growth: a Granger causality panel data approach. Working Paper number 24 of the School of Economics and Management. |
| [32] | Gelo T (2009) Causality between economic growth and energy consumption in Croatia. Zbornik radova Ekonomskog fakulteta u Rijeci: časopis za ekonomsku teoriju i praksu 27: 327–348. |
| [33] | Giraud D, Kahraman Z (2014) How Dependent is Growth from Primary Energy? The Dependency ratio of Energy in 33 Countries (1970–2011). Working Paper Centre d'Economie de la Sorbonne number 14097, Université Panthéon-Sorbonne (Paris 1) |
| [34] |
Gómez-Puig M, Sosvilla-Rivero S (2015) The causal relationship between debt and growth in EMU countries. J Policy Model 37: 974–989. https://doi.org/10.1016/j.jpolmod.2015.09.004 doi: 10.1016/j.jpolmod.2015.09.004
|
| [35] |
Grinsted A, Moore JC, Jevrejeva S (2004) Application of the cross wavelet transform and wavelet coherence to geophysical time series. Nonlinear Proc Geoph 11: 561–566. https://doi.org/10.5194/npg-11-561-2004 doi: 10.5194/npg-11-561-2004
|
| [36] |
Grossmann A, Morlet J (1984) Decomposition of Hardy functions into square integrable wavelets of constant shape. SIAM J Math Anal 15: 723–736. https://doi.org/10.1137/0515056 doi: 10.1137/0515056
|
| [37] |
Gülerce M, Ünal G (2018) Electricity price forecasting using multiple wavelet coherence method: Comparison of ARMA versus VARMA. Int J Financial Eng 5: 1850004. https://doi.org/10.1142/S2424786318500044 doi: 10.1142/S2424786318500044
|
| [38] |
Halldorsson A, Svanberg M (2013) Energy resources: trajectories for supply chain management. Supply Chain Manag 18: 66–73. https://doi.org/10.1108/13598541311293186 doi: 10.1108/13598541311293186
|
| [39] | Hansen H (2004) The impact of external aid and external debt on growth and investment. Debt relief for poor countries. In Palgrave Macmillan, London, 134–157. |
| [40] | Hatemi A, Manuchehr I (2005) Energy consumption and economic growth in Sweden: a leveraged bootstrap approach, 1965–2000. Int J Appl Econometrics Quant Stud 2: 87–98. |
| [41] |
Hondroyiannis G (2004) Estimating residential demand for electricity in Greece. Energy Econ 26: 319–334. https://doi.org/10.1016/j.eneco.2004.04.001 doi: 10.1016/j.eneco.2004.04.001
|
| [42] |
Jamil MN (2022) Critical analysis of energy consumption and its impact on countries economic growth: an empirical analysis base on countries income level. J Environ Sci Econ 1: 1–12. https://doi.org/10.56556/jescae.v1i2.11 doi: 10.56556/jescae.v1i2.11
|
| [43] |
Jaruwan C, Hunt LC, Pierse R (2008) Does energy consumption cause economic growth? Evidence from a systematic study of over 100 countries. J Policy Model 30: 209–220. https://doi.org/10.1016/j.jpolmod.2006.10.003 doi: 10.1016/j.jpolmod.2006.10.003
|
| [44] |
Jobert T, Karanfil F (2007) Sectoral energy consumption by source and economic growth in Turkey. Energy Policy 35: 5447–5456. https://doi.org/10.1016/j.enpol.2007.05.008 doi: 10.1016/j.enpol.2007.05.008
|
| [45] |
Jumbe C (2004) Cointegration and causality between electricity consumption and GDP: empirical evidence from Malawi. Energy Econ 26: 61–68. https://doi.org/10.1016/S0140-9883(03)00058-6 doi: 10.1016/S0140-9883(03)00058-6
|
| [46] | Krugman P (1988) Market-Based Debt-Reduction Schemes. Working Paper No. 2587 of the National Bureau of Economic Research. |
| [47] |
Lau KM, Weng H (1995) Climate Signal Detection using wavelet transform: how to make a time series sing, B Am Meteorol Soc 16: 2391–2402. https://doi.org/10.1175/1520-0477(1995)076<2391:CSDUWT>2.0.CO;2 doi: 10.1175/1520-0477(1995)076<2391:CSDUWT>2.0.CO;2
|
| [48] |
Lee CC, Chang CP, Chen PF (2008) Energy-income causality in OECD countries revisited: The key role of capital stock. Energy Econ 30: 2359–2373. https://doi.org/10.1016/j.eneco.2008.01.005 doi: 10.1016/j.eneco.2008.01.005
|
| [49] | Mallat S (1989) A theory for multiresolution signal decomposition: the wavelet representation. IEEE transactions on pattern analysis and machine intelligence 11: 674–693. |
| [50] | Mallat S (2009) A wavelet tour of signal processing: the sparce way. AP Professional, Third Edition, London. |
| [51] | Mallat S (2000) Une exploration des signaux en ondelettes. Editions Ecole Polytechnique. |
| [52] |
Masih A, Rumi M (1996) Energy consumption, real income and temporal causality: results from a multi-country study based on cointegration and error-correction modelling techniques. Energy Econ 18: 165–183. https://doi.org/10.1016/0140-9883(96)00009-6 doi: 10.1016/0140-9883(96)00009-6
|
| [53] | Mencinger J, Aristovnik A, Verbic M (2014) The impact of growing public debt on economic growth in the European Union. Amfiteatru Econ J 16: 403–414. |
| [54] | Mestre R, Terraza M (2018) Time-Frequency varying beta estimation-a continuous wavelets approach. Econ Bull 38: 1796–1810. |
| [55] | Mestre R, Terraza M (2019) Time–frequency varying estimations: comparison of discrete and continuous wavelets in the market line framework. J Bank Financ Technol 3: 97–111. |
| [56] |
Mestre R (2021) A wavelet approach of investing behaviors and their effects on risk exposures. Financ Innov 7: 1–37. https://doi.org/10.1186/s40854-021-00239-z doi: 10.1186/s40854-021-00239-z
|
| [57] |
Mestre R (2023) Stock Profiling using time-frequency-varying systematic risk measure. Financ Innov 9: 1–29. https://doi.org/10.1186/s40854-023-00457-7 doi: 10.1186/s40854-023-00457-7
|
| [58] | Meyer Y, Jaffard S, Rioul O (1986) L'analyse par ondelettes. Pour la science. |
| [59] | Modigliani F (1961) Long-run implications of alternative fiscal policies and the burden of the national debt. Econ J 71: 730–755. |
| [60] |
Mozumder P, Achla M (2007) Causality relationship between electricity consumption and GDP in Bangladesh. Energy Policy 35: 395–402. https://doi.org/10.1016/j.enpol.2005.11.033 doi: 10.1016/j.enpol.2005.11.033
|
| [61] |
Mutascu M (2016) A bootstrap panel Granger causality analysis of energy consumption and economic growth in the G7 countries. Renew Sust Energ Rev 63: 166–171. https://doi.org/10.1016/j.rser.2016.05.055 doi: 10.1016/j.rser.2016.05.055
|
| [62] |
Nyambuu U, Lucas B (2015) A quantitative approach to assessing sovereign default risk in resource‐rich emerging economies. Int J Financ Econ 20: 220–241. https://doi.org/10.1002/ijfe.1512 doi: 10.1002/ijfe.1512
|
| [63] | OCDE (2019) « OECD Economic Outlook No. 105 (Edition 2019/1) », OECD Economic Outlook: Statistics and Projections (base de données). https://doi.org/10.1787/b8fe9e35-en |
| [64] |
Oral E, Gazanfer U (2017) Dynamic correlation of Eastern and Western markets and forecasting: Scale-by-scale wavelet-based approach. Int J Financ Eng 4: 1750040. https://doi.org/10.1142/S2424786317500402 doi: 10.1142/S2424786317500402
|
| [65] |
Ozturk I, Acaravci A (2010) The causal relationship between energy consumption and GDP in Albania, Bulgaria, Hungary and Romania: Evidence from ARDL bound testing approach. Appl Energy 87: 1938–1943. https://doi.org/10.1016/j.apenergy.2009.10.010 doi: 10.1016/j.apenergy.2009.10.010
|
| [66] |
Panizza U, Presbitero A (2014) Public debt and economic growth: is there a causal effect? J Macroecon 41: 21–41. https://doi.org/10.1016/j.jmacro.2014.03.009 doi: 10.1016/j.jmacro.2014.03.009
|
| [67] | Puente-Ajovín M, Sanso-Navarro M (2015) Granger causality between debt and growth: Evidence from OECD countries. Int Rev Econ Financ 35: 66–77. |
| [68] |
Roubini N, Sachs J (1989) Political and economic determinants of budget deficits in the industrial democracies. Eur Econ Rev 33: 903–933. https://doi.org/10.1016/0014-2921(89)90002-0 doi: 10.1016/0014-2921(89)90002-0
|
| [69] |
Rua A, Nunes L (2009) International comovement of stock market returns: A wavelet analysis. J Empiri Financ 16: 632–639. https://doi.org/10.1016/j.jempfin.2009.02.002 doi: 10.1016/j.jempfin.2009.02.002
|
| [70] |
Sadiq M, Wen F, Bashir MF, et al. (2022) Does nuclear energy consumption contribute to human development? Modeling the effects of public debt and trade globalization in an OECD heterogeneous panel. J Clean Prod 375: 133965. https://doi.org/10.1016/j.jclepro.2022.133965 doi: 10.1016/j.jclepro.2022.133965
|
| [71] | Sakiru Adebola S, Mufutau Opeyemi B (2011) Multivariate causality test on electricity consumption, capital, labour and economic growth for Nigeria. J Bus Econ 3: 1. |
| [72] | Saint-Paul G (1992) Fiscal policy in an endogenous growth model. Q J Econ 107: 1243–1259. |
| [73] |
Shiu A, Pun Lee L (2004) Electricity consumption and economic growth in China. Energy Policy 32: 47–54. https://doi.org/10.1016/S0301-4215(02)00250-1 doi: 10.1016/S0301-4215(02)00250-1
|
| [74] |
Shyamal P, Bhattacharya R (2004) Causality between energy consumption and economic growth in India: a note on conflicting results. Energy Econ 26: 977–983. https://doi.org/10.1016/j.eneco.2004.07.002 doi: 10.1016/j.eneco.2004.07.002
|
| [75] |
Solow R (2016) Resources and economic growth. Am Econ 61: 52–60. https://doi.org/10.1177/0569434515627 doi: 10.1177/0569434515627
|
| [76] |
Squalli J (2007) Electricity consumption and economic growth: Bounds and causality analyses of OPEC members. Energy Econ 29: 1192–1205. https://doi.org/10.1016/j.eneco.2006.10.001 doi: 10.1016/j.eneco.2006.10.001
|
| [77] | Tanzi V, Chalk N (2000) Impact of large public debt on growth in the EU: A discussion of potential channels. Eur Econ 2: 23–43. |
| [78] |
Torrence C, Compo G (1998) A practical guide to wavelet analysis. Bull Am Meteorol Soc79: 61–78. https://doi.org/10.1175/1520-0477(1998)079<0061:APGTWA>2.0.CO;2 doi: 10.1175/1520-0477(1998)079<0061:APGTWA>2.0.CO;2
|
| [79] |
Torrence C, Webster PJ (1999) Interdecadal changes in the ENSO-Monsoon System. J Clim 12: 2679–2690. https://doi.org/10.1175/1520-0442(1999)012<2679:ICITEM>2.0.CO;2 doi: 10.1175/1520-0442(1999)012<2679:ICITEM>2.0.CO;2
|
| [80] |
Tsani SZ (2010) Energy consumption and economic growth: A causality analysis for Greece. Energy Econ 32: 582–590. https://doi.org/10.1016/j.eneco.2009.09.007 doi: 10.1016/j.eneco.2009.09.007
|
| [81] |
Uddin G, Yahya M, Bekiros S, et al. (2021) Systematic risk in the biopharmaceutical sector: a multiscale approach. Ann Oper Res 2021: 1–24. https://doi.org/10.1007/s10479-021-04402-8 doi: 10.1007/s10479-021-04402-8
|
| [82] | Yu E, Choi JH (1985) The causal relationship between energy and GNP: an international comparison. J Energy Dev 1985: 249–272. |
Figures(1)
Mohamed AWADA, Roman MESTRE. Revisiting the Energy-Growth nexus with debt channel. A wavelet time-frequency analysis for a panel of Eurozone-OECD countries[J]. Data Science in Finance and Economics, 2023, 3(2): 133-151. doi: 10.3934/DSFE.2023008


 DownLoad: