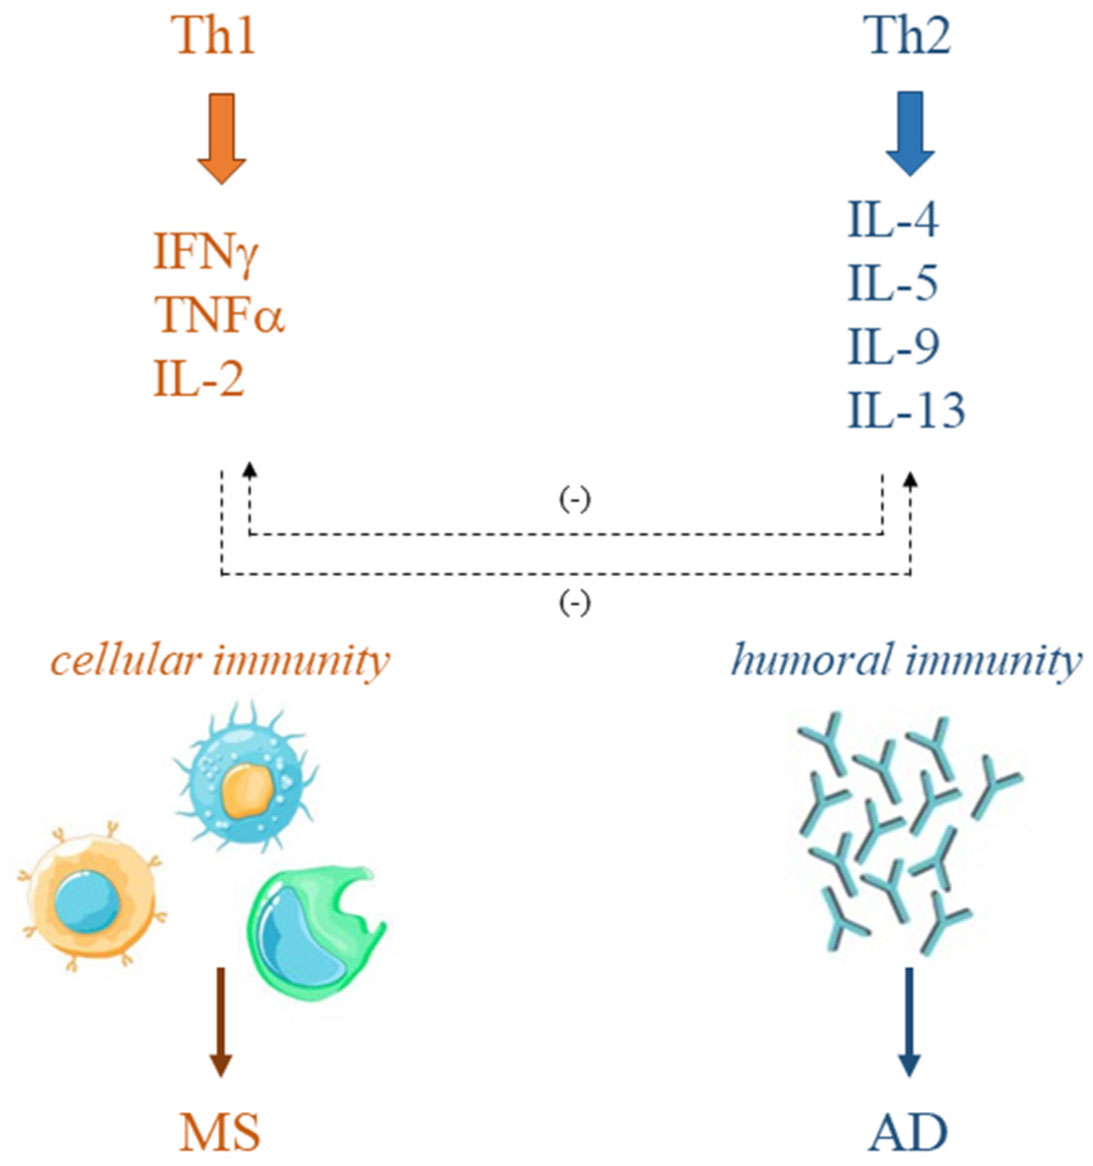
Immune system disorders characterize various diseases such as multiple sclerosis (MS) and allergic diseases (AD). In MS, T-helper (Th)1 cell phenotype is responsible for the disease onset and long-term evolution. On the other hand, excessive Th2 cell activity has been demonstrated in AD. The simultaneous increase of MS and AD in the same geographical areas, observed in recent years, has questioned the mutually exclusive correlation between MS and AD immunopathogenesis supported by the Th1/Th2 paradigm and has moved the interest in understanding possible overlaps. This manuscript aims to discuss the literature, collected over the past two decades, about the association between MS and AD, and both experimental and epidemiological studies have been reviewed. The results do not provide a solid correlation between AD and MS, although experimental studies support the involvement of the same cells and molecules in the immunopathogenesis of both diseases. Further studies, increasing knowledge on the cellular and molecular mechanisms involved in these two disorders, could help to clarify if a positive or negative association links them and provide the possibility for the development of new therapies.
Citation: Lisa Aielli, Federica Serra, Erica Costantini. Multiple sclerosis and allergic diseases: is there a relationship?[J]. AIMS Allergy and Immunology, 2022, 6(3): 126-152. doi: 10.3934/Allergy.2022011
Immune system disorders characterize various diseases such as multiple sclerosis (MS) and allergic diseases (AD). In MS, T-helper (Th)1 cell phenotype is responsible for the disease onset and long-term evolution. On the other hand, excessive Th2 cell activity has been demonstrated in AD. The simultaneous increase of MS and AD in the same geographical areas, observed in recent years, has questioned the mutually exclusive correlation between MS and AD immunopathogenesis supported by the Th1/Th2 paradigm and has moved the interest in understanding possible overlaps. This manuscript aims to discuss the literature, collected over the past two decades, about the association between MS and AD, and both experimental and epidemiological studies have been reviewed. The results do not provide a solid correlation between AD and MS, although experimental studies support the involvement of the same cells and molecules in the immunopathogenesis of both diseases. Further studies, increasing knowledge on the cellular and molecular mechanisms involved in these two disorders, could help to clarify if a positive or negative association links them and provide the possibility for the development of new therapies.

| [1] |
Akdis M, Akdis CA (2014) Mechanisms of allergen-specific immunotherapy: multiple suppressor factors at work in immune tolerance to allergens. J Allergy Clin Immunol 133: 621-631. https://doi.org/10.1016/j.jaci.2013.12.1088 
|
| [2] |
Buckley CD, McGettrick HM (2018) Leukocyte trafficking between stromal compartments: lessons from rheumatoid arthritis. Nat Rev Rheumatol 14: 476-487. https://doi.org/10.1038/s41584-018-0042-4
|
| [3] | Kidd P (2003) Th1/Th2 balance: the hypothesis, its limitations, and implications for health and disease. Altern Med Rev 8: 223-246. |
| [4] |
Romagnani S (2004) Immunologic influences on allergy and the TH1/TH2 balance. J Allergy Clin Immunol 113: 395-400. https://doi.org/10.1016/j.jaci.2003.11.025
|
| [5] |
Lee GR, Kim ST, Spilianakis CG, et al. (2006) T helper cell differentiation: regulation by cis elements and epigenetics. Immunity 24: 369-379. https://doi.org/10.1016/j.immuni.2006.03.007
|
| [6] |
Matsuzaki J, Tsuji T, Imazeki I, et al. (2005) Immunosteroid as a regulator for Th1/Th2 balance: its possible role in autoimmune diseases. Autoimmunity 38: 369-375. https://doi.org/10.1080/08916930500124122
|
| [7] |
Ngoc PL, Gold DR, Tzianabos AO, et al. (2005) Cytokines, allergy, and asthma. Curr Opin Allergy Clin Immunol 5: 161-166. https://doi.org/10.1097/01.all.0000162309.97480.45
|
| [8] |
Podbielska M, Banik NL, Kurowska E, et al. (2013) Myelin recovery in multiple sclerosis: the challenge of remyelination. Brain Sci 3: 1282-1324. https://doi.org/10.3390/brainsci3031282
|
| [9] |
Arellano G, Acuña E, Reyes LI, et al. (2017) Th1 and Th17 cells and associated cytokines discriminate among clinically isolated syndrome and multiple sclerosis phenotypes. Front Immunol 8: 753. https://doi.org/10.3389/fimmu.2017.00753
|
| [10] |
Wang K, Song F, Fernandez-Escobar A, et al. (2018) The properties of cytokines in multiple sclerosis: pros and cons. Am J Med Sci 356: 552-560. https://doi.org/10.1016/j.amjms.2018.08.018
|
| [11] |
Hirahara K, Nakayama T (2016) CD4+ T-cell subsets in inflammatory diseases: beyond the Th1/Th2 paradigm. Int Immunol 28: 163-171. https://doi.org/10.1093/intimm/dxw006
|
| [12] |
Wambre E, Bajzik V, DeLong JH, et al. (2017) A phenotypically and functionally distinct human TH2 cell subpopulation is associated with allergic disorders. Sci Transl Med 9: eaam9171. https://doi.org/10.1126/scitranslmed.aam9171
|
| [13] |
Tang C, Inman MD, van Rooijen N, et al. (2001) Th type 1-stimulating activity of lung macrophages inhibits Th2-mediated allergic airway inflammation by an IFN-gamma-dependent mechanism. J Immunol 166: 1471-1481. https://doi.org/10.4049/jimmunol.166.3.1471
|
| [14] |
Tang L, Benjaponpitak S, DeKruyff RH, et al. (1998) Reduced prevalence of allergic disease in patients with multiple sclerosis is associated with enhanced IL-12 production. J Allergy Clin Immunol 102: 428-435. https://doi.org/10.1016/S0091-6749(98)70131-9
|
| [15] |
Okada H, Kuhn C, Feillet H, et al. (2010) The “hygiene hypothesis” for autoimmune and allergic diseases: an update. Clin Exp Immunol 160: 1-9. https://doi.org/10.1111/j.1365-2249.2010.04139.x
|
| [16] |
Bach JF (2002) The effect of infections on susceptibility to autoimmune and allergic diseases. N Engl J Med 347: 911-920. https://doi.org/10.1056/NEJMra020100
|
| [17] |
Cunniffe N, Coles A (2021) Promoting remyelination in multiple sclerosis. J Neurol 268: 30-44. https://doi.org/10.1007/s00415-019-09421-x
|
| [18] | Lazibat I, Rubinić-Majdak M, Županić S (2018) Multiple sclerosis: new aspects of immunopathogenesis. Acta Clin Croat 57: 352-361. https://doi.org/10.20471/acc.2018.57.02.17 |
| [19] |
Yamout B, Alroughani R (2018) Multiple sclerosis. Semin Neurol 38: 212-225. https://doi.org/10.1055/s-0038-1649502
|
| [20] |
Dobson R, Giovannoni G (2019) Multiple sclerosis—a review. Eur J Neurol 26: 27-40. https://doi.org/10.1111/ene.13819
|
| [21] |
Walton C, King R, Rechtman L, et al. (2020) Rising prevalence of multiple sclerosis worldwide: Insights from the Atlas of MS, third edition. Mult Scler 26: 1816-1821. https://doi.org/10.1177/1352458520970841
|
| [22] |
Filippi M, Bar-Or A, Piehl F, et al. (2018) Multiple sclerosis. Nat Rev Dis Primers 4: 43. https://doi.org/10.1038/s41572-018-0041-4
|
| [23] |
Lassmann H, Brück W, Lucchinetti CF (2007) The immunopathology of multiple sclerosis: an overview. Brain Pathol 17: 210-218. https://doi.org/10.1111/j.1750-3639.2007.00064.x
|
| [24] |
Kearney H, Altmann DR, Samson RS, et al. (2015) Cervical cord lesion load is associated with disability independently from atrophy in MS. Neurology 84: 367-373. https://doi.org/10.1212/WNL.0000000000001186
|
| [25] |
Schiess N, Calabresi PA (2016) Multiple sclerosis. Semin Neurol 36: 350-356. https://doi.org/10.1055/s-0036-1585456
|
| [26] |
Dendrou CA, Fugger L, Friese MA (2015) Immunopathology of multiple sclerosis. Nat Rev Immunol 15: 545-558. https://doi.org/10.1038/nri3871
|
| [27] |
Amato MP, Ponziani G, Siracusa G, et al. (2001) Cognitive dysfunction in early-onset multiple sclerosis: a reappraisal after 10 years. Arch Neurol-Chicago 58: 1602-1606. https://doi.org/10.1001/archneur.58.10.1602
|
| [28] |
Oh J, Vidal-Jordana A, Montalban X (2018) Multiple sclerosis: clinical aspects. Curr Opin Neurol 31: 752-759. https://doi.org/10.1097/WCO.0000000000000622
|
| [29] |
McGinley MP, Goldschmidt CH, Rae-Grant AD (2021) Diagnosis and treatment of multiple sclerosis: a review. JAMA 325: 765-779. https://doi.org/10.1001/jama.2020.26858
|
| [30] |
Przybek J, Gniatkowska I, Mirowska-Guzel D, et al. (2015) Evolution of diagnostic criteria for multiple sclerosis. Neurol Neurochir Pol 49: 313-321. https://doi.org/10.1016/j.pjnns.2015.07.006
|
| [31] |
Milo R, Miller A (2014) Revised diagnostic criteria of multiple sclerosis. Autoimmun Rev 13: 518-524. https://doi.org/10.1016/j.autrev.2014.01.012
|
| [32] |
Garg N, Smith TW (2015) An update on immunopathogenesis, diagnosis, and treatment of multiple sclerosis. Brain Behav 5: e00362. https://doi.org/10.1002/brb3.362
|
| [33] |
Klineova S, Lublin FD (2018) Clinical course of multiple sclerosis. Cold Spring Harb Perspect Med 8: a028928. https://doi.org/10.1101/cshperspect.a028928
|
| [34] | Hart FM, Bainbridge J (2016) Current and emerging treatment of multiple sclerosis. Am J Manag Care 22: s159-s170. |
| [35] |
Baecher-Allan C, Kaskow BJ, Weiner HL (2018) Multiple sclerosis: mechanisms and immunotherapy. Neuron 97: 742-768. https://doi.org/10.1016/j.neuron.2018.01.021
|
| [36] |
Alfredsson L, Olsson T (2019) Lifestyle and environmental factors in multiple sclerosis. Cold Spring Harb Perspect Med 9: a028944. https://doi.org/10.1101/cshperspect.a028944
|
| [37] | Selter RC, Hemmer B (2013) Update on immunopathogenesis and immunotherapy in multiple sclerosis. ImmunoTargets Ther 2: 21-30. https://doi.org/10.2147/ITT.S31813 |
| [38] |
Baxter AG (2007) The origin and application of experimental autoimmune encephalomyelitis. Nat Rev Immunol 7: 904-912. https://doi.org/10.1038/nri2190
|
| [39] |
Kuerten S, Lichtenegger FS, Faas S, et al. (2006) MBP-PLP fusion protein-induced EAE in C57BL/6 mice. J Neuroimmunol 177: 99-111. https://doi.org/10.1016/j.jneuroim.2006.03.021
|
| [40] |
Derdelinckx J, Cras P, Berneman ZN, et al. (2021) Antigen-specific treatment modalities in MS: The past, the present, and the future. Front Immunol 12: 624685. https://doi.org/10.3389/fimmu.2021.624685
|
| [41] |
D'Angelo C, Reale M, Costantini E, et al. (2018) Profiling of canonical and non-traditional cytokine levels in interferon-β-treated relapsing-remitting-multiple sclerosis patients. Front Immunol 9: 1240. https://doi.org/10.3389/fimmu.2018.01240
|
| [42] |
Marchetti L, Engelhardt B (2020) Immune cell trafficking across the blood-brain barrier in the absence and presence of neuroinflammation. Vasc Biol 2: H1-H18. https://doi.org/10.1530/VB-19-0033
|
| [43] |
Gold R, Wolinsky JS (2011) Pathophysiology of multiple sclerosis and the place of teriflunomide. Acta Neurol Scand 124: 75-84. https://doi.org/10.1111/j.1600-0404.2010.01444.x
|
| [44] |
Holman DW, Klein RS, Ransohoff RM (2011) The blood-brain barrier, chemokines and multiple sclerosis. Biochim Biophys Acta 1812: 220-230. https://doi.org/10.1016/j.bbadis.2010.07.019
|
| [45] |
Sonar SA, Lal G (2018) Blood-brain barrier and its function during inflammation and autoimmunity. J Leukocyte Biol 103: 839-853. https://doi.org/10.1002/JLB.1RU1117-428R
|
| [46] |
Thompson AJ, Baranzini SE, Geurts J, et al. (2018) Multiple sclerosis. Lancet 391: 1622-1636. https://doi.org/10.1016/S0140-6736(18)30481-1
|
| [47] |
Piehl F (2021) Current and emerging disease-modulatory therapies and treatment targets for multiple sclerosis. J Intern Med 289: 771-791. https://doi.org/10.1111/joim.13215
|
| [48] |
Claes N, Fraussen J, Stinissen P, et al. (2015) B cells are multifunctional players in multiple sclerosis pathogenesis: Insights from therapeutic interventions. Front Immunol 6: 642. https://doi.org/10.3389/fimmu.2015.00642
|
| [49] |
Milo R (2019) Therapies for multiple sclerosis targeting B cells. Croat Med J 60: 87-98. https://doi.org/10.3325/cmj.2019.60.87
|
| [50] |
McFarland HF, Martin R (2007) Multiple sclerosis: a complicated picture of autoimmunity. Nat Immunol 8: 913-919. https://doi.org/10.1038/ni1507
|
| [51] | Inglese M (2006) Multiple sclerosis: new insights and trends. Am J Neuroradiol 27: 954-957. |
| [52] |
Voet S, Prinz M, van Loo G (2019) Microglia in central nervous system inflammation and multiple sclerosis pathology. Trends Mol Med 25: 112-123. https://doi.org/10.1016/j.molmed.2018.11.005
|
| [53] |
Strik M, Cofré Lizama LE, Shanahan CJ, et al. (2021) Axonal loss in major sensorimotor tracts is associated with impaired motor performance in minimally disabled multiple sclerosis patients. Brain Commun 3: fcab032. https://doi.org/10.1093/braincomms/fcab032
|
| [54] |
Akdis CA (2006) Allergy and hypersensitivity: mechanisms of allergic disease. Curr Opin Immunol 18: 718-726. https://doi.org/10.1016/j.coi.2006.09.016
|
| [55] | Murphy K, Travers P, Walport M (2008) Allergy and hypersensitivity. Janeway's Immunobiology . UK: Garland Science. https://doi.org/10.1007/978-3-8274-2219-4 |
| [56] |
Simon D (2018) Recent advances in clinical allergy and immunology. Int Arch Allergy Imm 177: 324-333. https://doi.org/10.1159/000494931
|
| [57] |
Kumar Y, Bhatia A (2013) Immunopathogenesis of allergic disorders: current concepts. Expert Rev Clin Immunol 9: 211-226. https://doi.org/10.1586/eci.12.104
|
| [58] | Vaillant AAJ, Vashisht R, Zito PM (2022) Immediate hypersensitivity reactions In: StatPearls, Treasure Island (FL): StatPearls Publishing. |
| [59] |
Breiteneder H, Peng YQ, Agache I, et al. (2020) Biomarkers for diagnosis and prediction of therapy responses in allergic diseases and asthma. Allergy 75: 3039-3068. https://doi.org/10.1111/all.14582
|
| [60] |
Galli SJ, Tsai M, Piliponsky AM (2008) The development of allergic inflammation. Nature 454: 445-454. https://doi.org/10.1038/nature07204
|
| [61] |
Yao Y, Chen CL, Yu D, et al. (2021) Roles of follicular helper and regulatory T cells in allergic diseases and allergen immunotherapy. Allergy 76: 456-470. https://doi.org/10.1111/all.14639
|
| [62] | Muñoz-Carrillo JL, Castro-García FP, Chávez-Rubalcaba F, et al. (2018) Immune system disorders: hypersensitivity and autoimmunity. Immunoregulatory Aspects of Immunotherapy . London: InTechOpen 1-30. https://doi.org/10.5772/intechopen.75794 |
| [63] |
Remington B, Broekman HCH, Blom WM, et al. (2018) Approaches to assess IgE mediated allergy risks (sensitization and cross-reactivity) from new or modified dietary proteins. Food Chem Toxicol 112: 97-107. https://doi.org/10.1016/j.fct.2017.12.025
|
| [64] |
Kanagaratham C, El Ansari YS, Lewis OL, et al. (2020) IgE and IgG antibodies as regulators of mast cell and basophil functions in food allergy. Front Immunol 11: 603050. https://doi.org/10.3389/fimmu.2020.603050
|
| [65] | Janeway CA, Travers P, Walport M, et al. (2001) Immunobiology: The immune system in health and disease. Effector Mechanisms in Allergic Reactions . New York: Garland Science. |
| [66] |
Kitaura J, Song J, Tsai M, et al. (2003) Evidence that IgE molecules mediate a spectrum of effects on mast cell survival and activation via aggregation of the FcepsilonRI. P Natl Acad Sci USA 100: 12911-12916. https://doi.org/10.1073/pnas.1735525100
|
| [67] |
Dispenza MC (2019) Classification of hypersensitivity reactions. Allergy Asthma Proc 40: 470-473. https://doi.org/10.2500/aap.2019.40.4274
|
| [68] |
Miyake K, Karasuyama H (2017) Emerging roles of basophils in allergic inflammation. Allergol Int 66: 382-391. https://doi.org/10.1016/j.alit.2017.04.007
|
| [69] |
Prussin C, Metcalfe DD (2006) 5. IgE, mast cells, basophils, and eosinophils. J Allergy Clin Immunol 117: S450-S456. https://doi.org/10.1016/j.jaci.2005.11.016
|
| [70] |
Sampson AP (2000) The role of eosinophils and neutrophils in inflammation. Clin Exp Allergy 30: 22-27. https://doi.org/10.1046/j.1365-2222.2000.00092.x
|
| [71] |
Drazdauskaitė G, Layhadi JA, Shamji MH (2020) Mechanisms of allergen immunotherapy in allergic rhinitis. Curr Allergy Asthma Rep 21: 2. https://doi.org/10.1007/s11882-020-00977-7
|
| [72] | Akhouri S, House SA (2022) >Allergic rhinitis In: StatPearls, Treasure Island (FL): StatPearls Publishing. |
| [73] |
Yu W, Freeland DMH, Nadeau KC (2016) Food allergy: immune mechanisms, diagnosis and immunotherapy. Nat Rev Immunol 16: 751-765. https://doi.org/10.1038/nri.2016.111
|
| [74] |
Iweala OI, Choudhary SK, Commins SP (2018) Food allergy. Curr Gastroenterol Rep 20: 17. https://doi.org/10.1007/s11894-018-0624-y
|
| [75] |
Peters RL, Krawiec M, Koplin JJ, et al. (2021) Update on food allergy. Pediatr Allergy Immu 32: 647-657. https://doi.org/10.1111/pai.13443
|
| [76] | Rehman A, Amin F, Sadeeqa S (2018) Prevalence of asthma and its management: A review. J Pak Med Assoc 68: 1823-1827. |
| [77] | Ogeyingbo OD, Ahmed R, Gyawali M, et al. (2021) The relationship between vitamin D and asthma exacerbation. Cureus 13: e17279. https://doi.org/10.1111/pai.13443 |
| [78] |
Bush A (2019) Pathophysiological mechanisms of asthma. Front Pediatr 7: 68. https://doi.org/10.3389/fped.2019.00068
|
| [79] |
Nakamura Y, Tamaoki J, Nagase H, et al. (2020) Japanese guidelines for adult asthma. Allergol Int 69: 519-548. https://doi.org/10.1016/j.alit.2020.08.001
|
| [80] |
Bilò MB, Martini M, Tontini C, et al. (2021) Anaphylaxis. Eur Ann Allergy Clin Immunol 53: 4-17. https://doi.org/10.23822/EurAnnACI.1764-1489.158
|
| [81] | Pflipsen MC, Colon KMV (2020) Anaphylaxis: recognition and management. Am Fam Physician 102: 355-362. |
| [82] |
Hackett TL, Singhera GK, Shaheen F, et al. (2011) Intrinsic phenotypic differences of asthmatic epithelium and its inflammatory responses to respiratory syncytial virus and air pollution. Am J Resp Cell Mol 45: 1090-1100. https://doi.org/10.1165/rcmb.2011-0031OC
|
| [83] |
Siddiqui S, Johansson K, Joo A, et al. (2021) Epithelial miR-141 regulates IL-13-induced airway mucus production. JCI Insight 6: e139019. https://doi.org/10.1172/jci.insight.139019
|
| [84] |
Vercelli D (2008) Discovering susceptibility genes for asthma and allergy. Nat Rev Immunol 8: 169-182. https://doi.org/10.1038/nri2257
|
| [85] |
Akdis CA (2021) Does the epithelial barrier hypothesis explain the increase in allergy, autoimmunity and other chronic conditions?. Nat Rev Immunol 21: 739-751. https://doi.org/10.1038/s41577-021-00538-7
|
| [86] |
Kansen HM, Lebbink MA, Mul J, et al. (2020) Risk factors for atopic diseases and recurrent respiratory tract infections in children. Pediatr Pulm 55: 3168-3179. https://doi.org/10.1002/ppul.25042
|
| [87] |
D'Amato G, Chong-Neto HJ, Ortega OPM, et al. (2020) The effects of climate change on respiratory allergy and asthma induced by pollen and mold allergens. Allergy 75: 2219-2228. https://doi.org/10.1111/all.14476
|
| [88] |
Prescott S, Saffery R (2011) The role of epigenetic dysregulation in the epidemic of allergic disease. Clin Epigenetics 2: 223-232. https://doi.org/10.1007/s13148-011-0028-4
|
| [89] |
Wilson CB, Rowell E, Sekimata M (2009) Epigenetic control of T-helper-cell differentiation. Nat Rev Immunol 9: 91-105. https://doi.org/10.1038/nri2487
|
| [90] |
Thorburn AN, Macia L, Mackay CR (2014) Diet, metabolites, and “western-lifestyle” inflammatory diseases. Immunity 40: 833-842. https://doi.org/10.1016/j.immuni.2014.05.014
|
| [91] |
Yazdanbakhsh M, Kremsner PG, van Ree R (2002) Allergy, parasites, and the hygiene hypothesis. Science 296: 490-494. https://doi.org/10.1126/science.296.5567.490
|
| [92] |
Frei R, Lauener RP, Crameri R, et al. (2012) Microbiota and dietary interactions: an update to the hygiene hypothesis?. Allergy 67: 451-461. https://doi.org/10.1111/j.1398-9995.2011.02783.x
|
| [93] |
Raj D, Kabra SK, Lodha R (2014) Childhood obesity and risk of allergy or asthma. Immunol Allergy Clin 34: 753-765. https://doi.org/10.1016/j.iac.2014.07.001
|
| [94] |
Metsälä J, Lundqvist A, Virta LJ, et al. (2013) Mother's and offspring's use of antibiotics and infant allergy to cow's milk. Epidemiology 24: 303-309. https://doi.org/10.1097/EDE.0b013e31827f520f
|
| [95] |
Loh W, Tang MLK (2018) The epidemiology of food allergy in the global context. Int J Environ Res Public Health 15: 2043. https://doi.org/10.3390/ijerph15092043
|
| [96] |
Simon D (2019) Recent advances in clinical allergy and immunology 2019. Int Arch Allergy Imm 180: 291-305. https://doi.org/10.1159/000504364
|
| [97] |
Oro AS, Guarino TJ, Driver R, et al. (1996) Regulation of disease susceptibility: decreased prevalence of IgE-mediated allergic disease in patients with multiple sclerosis. J Allergy Clin Immunol 97: 1402-1408. https://doi.org/10.1016/S0091-6749(96)70210-5
|
| [98] |
Cameron MH, Nilsagard Y (2018) Balance, gait, and falls in multiple sclerosis. Handb Clin Neurol 159: 237-250. https://doi.org/10.1016/B978-0-444-63916-5.00015-X
|
| [99] |
Rosiak K, Zagożdżon P (2017) Quality of life and social support in patients with multiple sclerosis. Psychiatr Pol 51: 923-935. https://doi.org/10.12740/PP/64709
|
| [100] |
Beiske AG, Naess H, Aarseth JH, et al. (2007) Health-related quality of life in secondary progressive multiple sclerosis. Mult Scler 13: 386-392. https://doi.org/10.1177/13524585070130030101
|
| [101] |
Lock C, Hermans G, Pedotti R, et al. (2002) Gene-microarray analysis of multiple sclerosis lesions yields new targets validated in autoimmune encephalomyelitis. Nat Med 8: 500-508. https://doi.org/10.1038/nm0502-500
|
| [102] |
Pedotti R, DeVoss JJ, Youssef S, et al. (2003) Multiple elements of the allergic arm of the immune response modulate autoimmune demyelination. P Natl Acad Sci USA 100: 1867-1872. https://doi.org/10.1073/pnas.252777399
|
| [103] |
Musio S, Gallo B, Scabeni S, et al. (2006) A key regulatory role for histamine in experimental autoimmune encephalomyelitis: disease exacerbation in histidine decarboxylase-deficient mice. J Immunol 176: 17-26. https://doi.org/10.4049/jimmunol.176.1.17
|
| [104] |
Lapilla M, Gallo B, Martinello M, et al. (2011) Histamine regulates autoreactive T cell activation and adhesiveness in inflamed brain microcirculation. J Leukocyte Biol 89: 259-267. https://doi.org/10.1189/jlb.0910486
|
| [105] |
Gregory GD, Robbie-Ryan M, Secor VH, et al. (2005) Mast cells are required for optimal autoreactive T cell responses in a murine model of multiple sclerosis. Eur J Immunol 35: 3478-3486. https://doi.org/10.1002/eji.200535271
|
| [106] | Alonso A, Hernán MA, Ascherio A (2008) Allergy, family history of autoimmune diseases, and the risk of multiple sclerosis. Acta Neurol Scand 117: 15-20. |
| [107] |
Alonso A, Jick SS, Hernán MA (2006) Allergy, histamine 1 receptor blockers, and the risk of multiple sclerosis. Neurology 66: 572-575. https://doi.org/10.1212/01.wnl.0000198507.13597.45
|
| [108] | Karimi P, Modarresi SZ, Sahraian MA, et al. (2013) The relation of multiple sclerosis with allergy and atopy: a case control study. Iran J Allergy Asthma Immunol 12: 182-189. |
| [109] |
Krishna MT, Subramanian A, Adderley NJ, et al. (2019) Allergic diseases and long-term risk of autoimmune disorders: longitudinal cohort study and cluster analysis. Eur Respir J 54: 1900476. https://doi.org/10.1183/13993003.00476-2019
|
| [110] |
Mansouri B, Asadollahi S, Heidari K, et al. (2014) Risk factors for increased multiple sclerosis susceptibility in the Iranian population. J Clin Neurosci 21: 2207-2211. https://doi.org/10.1016/j.jocn.2014.04.020
|
| [111] |
Chen J, Taylor B, Winzenberg T, et al. (2020) Comorbidities are prevalent and detrimental for employment outcomes in people of working age with multiple sclerosis. Mult Scler 26: 1550-1559. https://doi.org/10.1177/1352458519872644
|
| [112] |
Lo LMP, Taylor BV, Winzenberg T, et al. (2021) Comorbidity patterns in people with multiple sclerosis: A latent class analysis of the Australian Multiple Sclerosis Longitudinal Study. Eur J Neurol 28: 2269-2279. https://doi.org/10.1111/ene.14887
|
| [113] |
Hill E, Abboud H, Briggs FBS (2019) Prevalence of asthma in multiple sclerosis: A United States population-based study. Mult Scler Relat Disord 28: 69-74. https://doi.org/10.1016/j.msard.2018.12.012
|
| [114] |
Sorensen A, Conway DS, Briggs FBS (2021) Characterizing relapsing remitting multiple sclerosis patients burdened with hypertension, hyperlipidemia, and asthma. Mult Scler Relat Disord 53: 103040. https://doi.org/10.1016/j.msard.2021.103040
|
| [115] |
Tremlett HL, Evans J, Wiles CM, et al. (2002) Asthma and multiple sclerosis: an inverse association in a case-control general practice population. QJM 95: 753-756. https://doi.org/10.1093/qjmed/95.11.753
|
| [116] |
Bergamaschi R, Villani S, Crabbio M, et al. (2009) Inverse relationship between multiple sclerosis and allergic respiratory diseases. Neurol Sci 30: 115-118. https://doi.org/10.1007/s10072-009-0036-8
|
| [117] |
Sahraian MA, Jafarian S, Sheikhbahaei S, et al. (2013) Respiratory tract rather than cutaneous atopic allergy inversely associate with multiple sclerosis: a case-control study. Clin Neurol Neurosur 115: 2099-2102. https://doi.org/10.1016/j.clineuro.2013.07.028
|
| [118] |
Pedotti R, Farinotti M, Falcone C, et al. (2009) Allergy and multiple sclerosis: a population-based case-control study. Mult Scler 15: 899-906. https://doi.org/10.1177/1352458509106211
|
| [119] |
Ren J, Ni H, Kim M, et al. (2017) Allergies, antibiotics use, and multiple sclerosis. Curr Med Res Opin 33: 1451-1456. https://doi.org/10.1080/03007995.2017.1325575
|
| [120] |
Skaaby T, Husemoen LL, Thuesen BH, et al. (2015) Specific IgE positivity against inhalant allergens and development of autoimmune disease. Autoimmunity 48: 282-288. https://doi.org/10.3109/08916934.2014.1003640
|
| [121] |
Manouchehrinia A, Edwards LJ, Roshanisefat H, et al. (2015) Multiple sclerosis course and clinical outcomes in patients with comorbid asthma: a survey study. BMJ Open 5: e007806. https://doi.org/10.1136/bmjopen-2015-007806
|
| [122] |
Ponsonby AL, Dwyer T, van der Mei I, et al. (2006) Asthma onset prior to multiple sclerosis and the contribution of sibling exposure in early life. Clin Exp Immunol 146: 463-470. https://doi.org/10.1111/j.1365-2249.2006.03235.x
|
| [123] |
Hughes AM, Lucas RM, McMichael AJ, et al. (2013) Early-life hygiene-related factors affect risk of central nervous system demyelination and asthma differentially. Clin Exp Immunol 172: 466-474. https://doi.org/10.1111/cei.12077
|
| [124] | Lopez CM, Yarrarapu SNS, Mendez MD (2022) Food allergies In: StatPearls, Treasure Island (FL): StatPearls Publishing. |
| [125] |
Yu JW, Pekeles G, Legault L, et al. (2006) Milk allergy and vitamin D deficiency rickets: a common disorder associated with an uncommon disease. Ann Allerg Asthma Im 96: 615-619. https://doi.org/10.1016/S1081-1206(10)63558-2
|
| [126] |
Correale J, Ysrraelit MC, Gaitán MI (2009) Immunomodulatory effects of vitamin D in multiple sclerosis. Brain 132: 1146-1160. https://doi.org/10.1093/brain/awp033
|
| [127] |
Ramagopalan SV, Dyment DA, Guimond C, et al. (2010) Childhood cow's milk allergy and the risk of multiple sclerosis: a population based study. J Neurol Sci 291: 86-88. https://doi.org/10.1016/j.jns.2009.10.021
|
| [128] | Pichler J, Gerstmayr M, Szepfalusi Z, et al. (2002) 1 alpha,25(OH)2D3 inhibits not only Th1 but also Th2 differentiation in human cord blood T cells. Pediatr Res 52: 12-18. https://doi.org/10.1203/00006450-200207000-00005 |
| [129] |
Sakaguchi S, Yamaguchi T, Nomura T, et al. (2008) Regulatory T cells and immune tolerance. Cell 133: 775-787. https://doi.org/10.1016/j.cell.2008.05.009
|
| [130] |
Mirzakhani H, Al-Garawi A, Weiss ST, et al. (2015) Vitamin D and the development of allergic disease: how important is it?. Clin Exp Allergy 45: 114-125. https://doi.org/10.1111/cea.12430
|
| [131] |
Danikowski KM, Jayaraman S, Prabhakar BS (2017) Regulatory T cells in multiple sclerosis and myasthenia gravis. J Neuroinflammation 14: 117. https://doi.org/10.1186/s12974-017-0892-8
|
| [132] | Ashtari F, Jamshidi F, Shoormasti RS, et al. (2013) Cow's milk allergy in multiple sclerosis patients. J Res Med Sci 18: S62-S65. |
| [133] | Ashtari F, Jamshidi F, Shoormasti RS, et al. (2013) Fish and egg specific immunoglobin e in multiple sclerosis patients. Int J Prev Med 4: S185-S188. |
| [134] |
Bourne T, Waltz M, Casper TC, et al. (2017) Evaluating the association of allergies with multiple sclerosis susceptibility risk and disease activity in a pediatric population. J Neurol Sci 375: 371-375. https://doi.org/10.1016/j.jns.2017.02.041
|
| [135] |
Fakih R, Diaz-Cruz C, Chua AS, et al. (2019) Food allergies are associated with increased disease activity in multiple sclerosis. J Neurol Neurosur Ps 90: 629-635. https://doi.org/10.1136/jnnp-2018-319301
|
| [136] |
Albatineh AN, Alroughani R, Al-Temaimi R (2020) Predictors of multiple sclerosis severity score in patients with multiple sclerosis. Int J MS Care 22: 233-238. https://doi.org/10.7224/1537-2073.2019-054
|
| [137] |
Parodi B, de Rosbo NK (2021) The gut-brain axis in multiple sclerosis. Is its dysfunction a pathological trigger or a consequence of the disease?. Front Immunol 12: 718220. https://doi.org/10.3389/fimmu.2021.718220
|
| [138] |
Agirman G, Yu KB, Hsiao EY (2021) Signaling inflammation across the gut-brain axis. Science 374: 1087-1092. https://doi.org/10.1126/science.abi6087
|
Figures(1) / Tables(2)

Lisa Aielli, Federica Serra, Erica Costantini. Multiple sclerosis and allergic diseases: is there a relationship?[J]. AIMS Allergy and Immunology, 2022, 6(3): 126-152. doi: 10.3934/Allergy.2022011


 DownLoad: