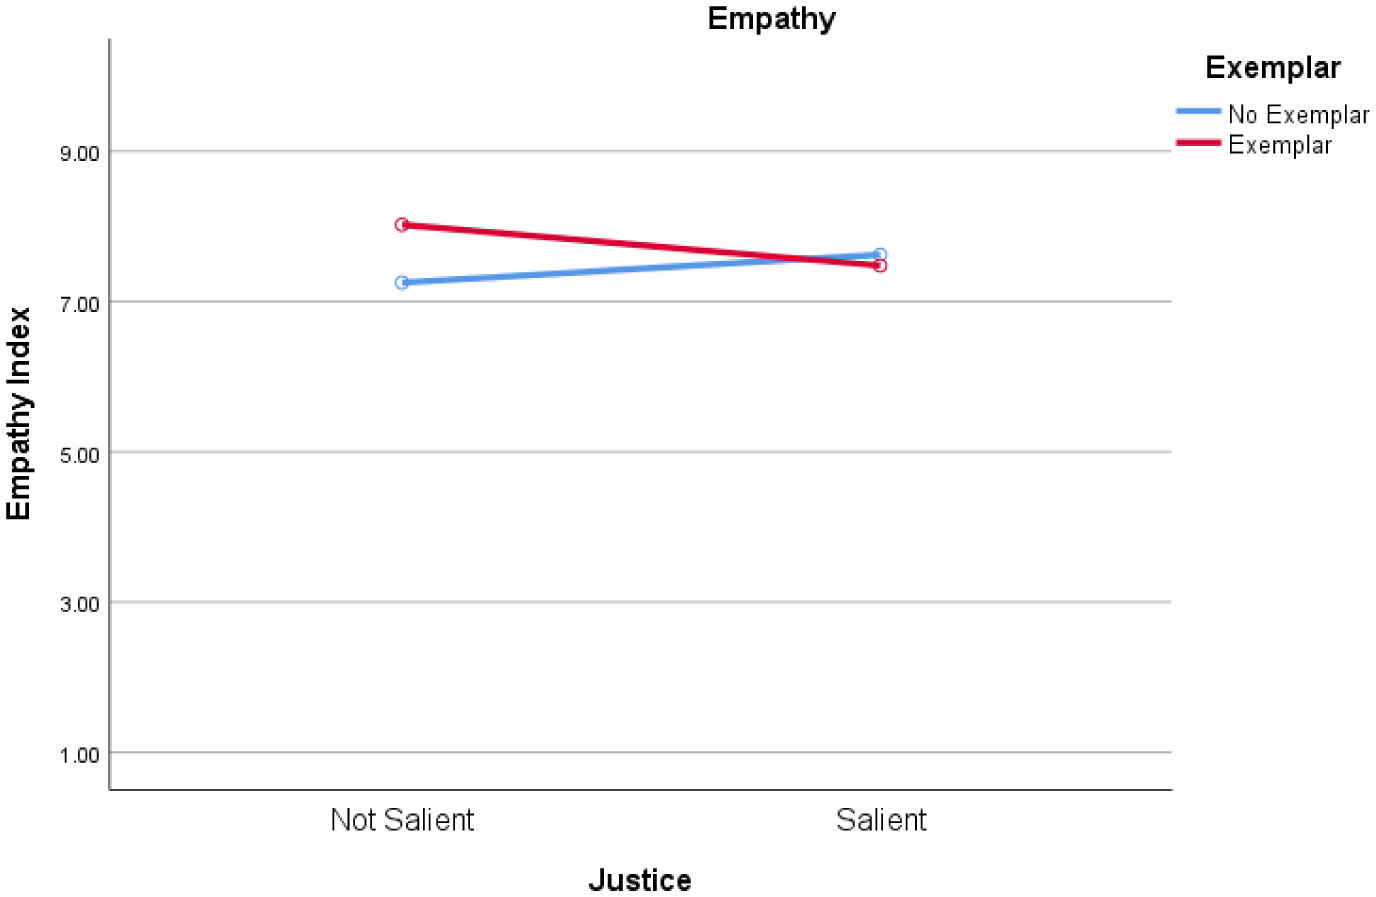
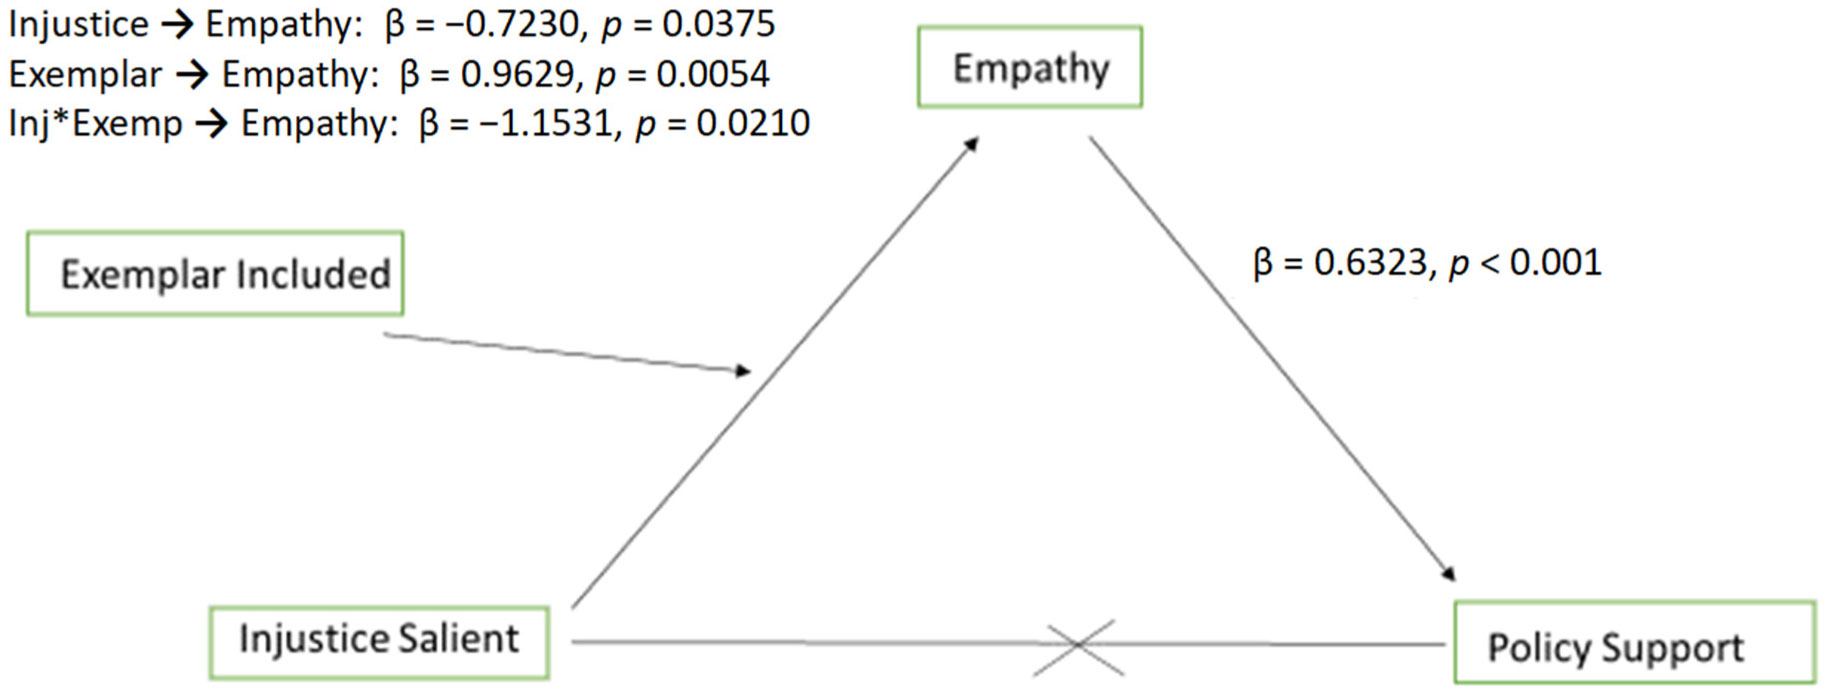
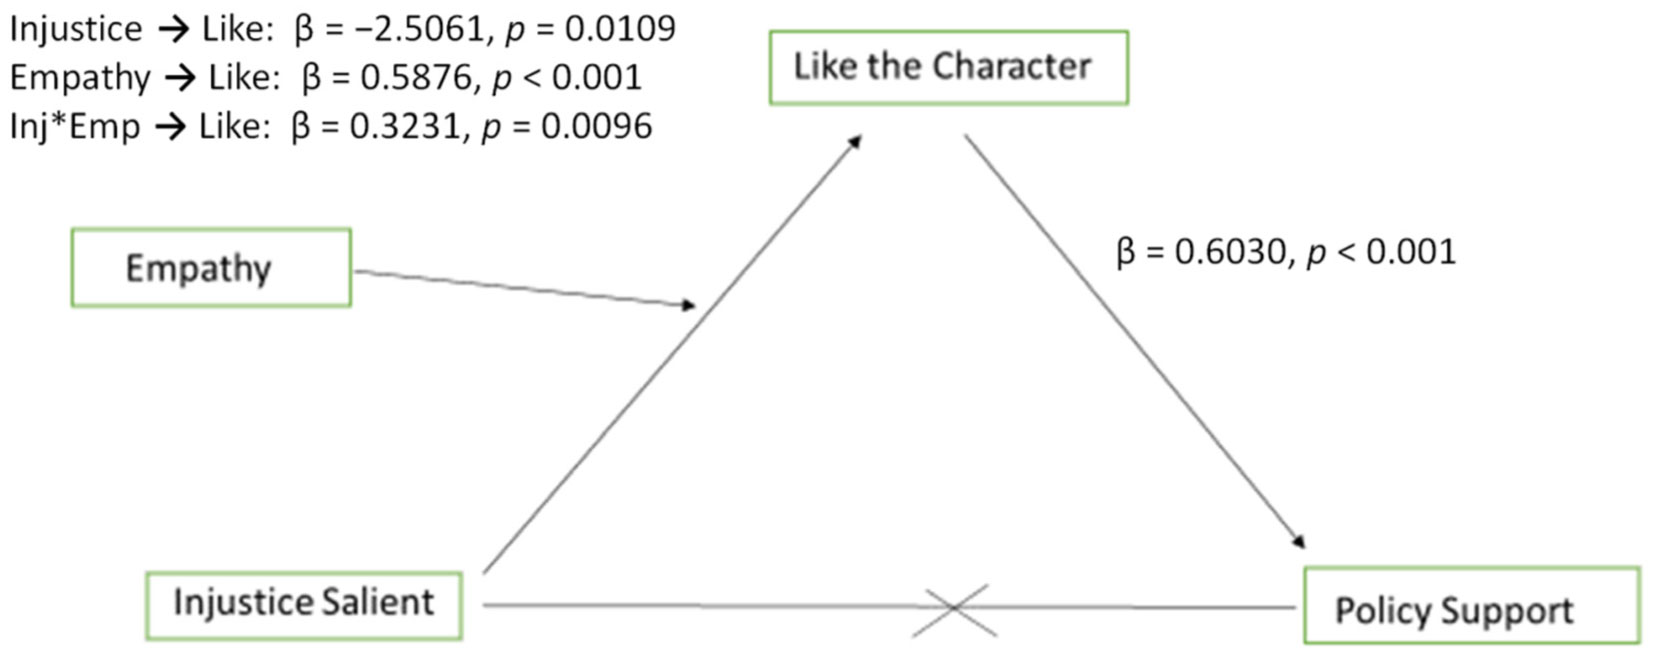
Social media posts intended to increase empathy thereby garnering support for public policy that improves the health and well-being of vulnerable populations can make salient the fact that vulnerable populations' experiences are unfair. For example, children with food allergies or diabetes often do not have access to emergency medication and can be isolated and treated poorly by peers. Raising awareness of this disparity, especially when paired with an image of an afflicted child, was expected to increase empathy which could then drive improvements in healthcare policy. However, data from two experimental studies suggest that making injustice salient in such a persuasive appeal can backfire, having the opposite effect as intended. When injustice salience was paired with an image of a patient with food allergies or diabetes, participants, especially those who self-identify as politically conservative, felt less empathy and were less supportive of protective policies. This study seeks to understand the counterintuitive responses people have when presented with clear examples of disparities in conjunction with patient images.
Citation: Melissa Foster. The backfiring effect of fairness salience in health messages regarding food allergies and diabetes[J]. AIMS Allergy and Immunology, 2022, 6(3): 106-125. doi: 10.3934/Allergy.2022010
Social media posts intended to increase empathy thereby garnering support for public policy that improves the health and well-being of vulnerable populations can make salient the fact that vulnerable populations' experiences are unfair. For example, children with food allergies or diabetes often do not have access to emergency medication and can be isolated and treated poorly by peers. Raising awareness of this disparity, especially when paired with an image of an afflicted child, was expected to increase empathy which could then drive improvements in healthcare policy. However, data from two experimental studies suggest that making injustice salient in such a persuasive appeal can backfire, having the opposite effect as intended. When injustice salience was paired with an image of a patient with food allergies or diabetes, participants, especially those who self-identify as politically conservative, felt less empathy and were less supportive of protective policies. This study seeks to understand the counterintuitive responses people have when presented with clear examples of disparities in conjunction with patient images.

| [1] | Besley JC (2009) Focusing on fairness in science and risk communication. Understanding and Communicating Science: New Agendas in Communication . Florence: Routledge. |
| [2] |
Dillard JP, Shen LJ (2005) On the nature of reactance and its role in persuasive health communication. Commun Monogr 72: 144-168. https://doi.org/10.1080/03637750500111815 
|
| [3] |
Nestler S, Egloff B (2010) When scary messages backfire: Influence of dispositional cognitive avoidance on the effectiveness of threat communications. J Res Pers 44: 137-141. https://doi.org/10.1016/j.jrp.2009.10.007
|
| [4] |
Colquitt JA (2001) On the dimensionality of organizational justice: A construct validation of a measure. J Appl Psychol 86: 386-400. https://doi.org/10.1037/0021-9010.86.3.386
|
| [5] | Bies RJ, Moag JF (1986) Interactional justice: Communication criteria of fairness. Research on Negotiations in Organizations . Greenwich: JAI Press 43-55. |
| [6] |
Greenberg J (1993) Stealing in the name of justice: Informational and interpersonal moderators of theft reactions to underpayment inequity. Organ Behav Hum Decis Process 54: 81-103. https://doi.org/10.1006/obhd.1993.1004
|
| [7] |
de Vignemont F, Singer T (2006) The empathic brain: how, when and why?. Trends Cogn Sci 10: 435-441. https://doi.org/10.1016/j.tics.2006.08.008
|
| [8] |
Hoffman ML (1975) Developmental synthesis of affect and cognition and its implications for altruistic motivation. Dev Psychol 11: 607-622. https://doi.org/10.1037/0012-1649.11.5.607
|
| [9] | Batson CD, Coke JS (1981) Empathy: A source of altruistic motivation for helping?. Altruism and Helping Behavior . Hillsdale: Erlbaum Associates 167-187. |
| [10] |
Johnson JD, Olivo N, Gibson N, et al. (2009) Priming media stereotypes reduces support for social welfare policies: The mediating role of empathy. Pers Soc Psychol Bull 35: 463-476. https://doi.org/10.1177/0146167208329856
|
| [11] |
Gault BA, Sabini J (2000) The roles of empathy, anger, and gender in predicting attitudes toward punitive, reparative, and preventative public policies. Cogn Emot 14: 495-520. https://doi.org/10.1080/026999300402772
|
| [12] |
Batson CD, Polycarpou MP, Harmon-Jones E, et al. (1997) Empathy and attitudes: Can feeling for a member of a stigmatized group improve feelings toward the group?. J Pers Soc Psychol 72: 105-118. https://doi.org/10.1037/0022-3514.72.1.105
|
| [13] |
Brosius HB (1994) The utility of exemplars in persuasive communications. Commun Res 21: 48-78. https://doi.org/10.1177/009365094021001004
|
| [14] |
Small DA, Loewenstein G (2003) Helping “A” victim or helping “The” victim: Altruism and Identifiability. J Risk Uncertain 26: 5-16. https://doi.org/10.1023/A:1022299422219
|
| [15] |
Small DA, Verrochi NM (2009) The face of need: Facial emotion expression on charity advertisements. J Mark Res 46: 777-787. https://doi.org/10.1509/jmkr.46.6.777
|
| [16] |
Zillman D (2006) Exemplification effects in the promotion of safety and health. J Commun 56: 221-237. https://doi.org/10.1111/j.1460-2466.2006.00291.x
|
| [17] |
Sampson HA, Muñoz-Furlong A, Campbell RL, et al. (2006) Second symposium on the definition and management of anaphylaxis: summary report—Second National Institute of Allergy and Infectious Disease/Food Allergy and Anaphylaxis Network symposium. J Allergy Clin Immun 117: 391-397. https://doi.org/10.1016/j.jaci.2005.12.1303
|
| [18] |
Gupta RS, Springston EE, Warrier MR, et al. (2011) The prevalence, severity, and distribution of childhood food allergy in the United States. Pediatrics 128: 9-17. https://doi.org/10.1542/peds.2011-0204
|
| [19] |
Avery NJ, King RM, Knight S, et al. (2003) Assessment of quality of life in children with peanut allergy. Pediatr Allergy Immu 14: 378-382. https://doi.org/10.1034/j.1399-3038.2003.00072.x
|
| [20] |
Nowak-Wegrzyn A, Hass S, Tilles S, et al. (2020) Peanut allergy burden survey: Impact of peanut allergy on global quality of life in adolescent patients. J Allergy Clin Immunol 145: AB146. https://doi.org/10.1016/j.jaci.2019.12.470
|
| [21] |
Nowak-Wegrzyn A, Hass SL, Donelson SM, et al. (2021) The peanut allergy burden study: Impact on the quality of life of patients and caregivers. World Allergy Organ J 14: 100512. https://doi.org/10.1016/j.waojou.2021.100512
|
| [22] |
Cummings AJ, Knibb RC, Erlewyn-Lajeunesse M, et al. (2010) Management of nut allergy influences quality of life and anxiety in children and their mothers. Pediatr Allergy Immu 21: 586-594. https://doi.org/10.1111/j.1399-3038.2009.00975.x
|
| [23] |
Warren C, Dyer A, Lombard L, et al. (2021) The psychosocial burden of food allergy among adults: A US population-based study. J Allergy Clin Immunol Pract 9: 2452-2460. https://doi.org/10.1016/j.jaip.2021.02.039
|
| [24] |
Williams N, Parra G, Elkin TD (2009) Subjective distress and emotional resources in parents of children with food allergies. Child Health Care 38: 213-227. https://doi.org/10.1080/02739610903038792
|
| [25] |
Powers J, Bergren MD, Finnegan L (2007) Comparison of school food allergy emergency plans to the food allergy and anaphylaxis network's standard plan. J Sch Nurs 23: 252-258. https://doi.org/10.1177/10598405070230050301
|
| [26] |
Rhim GS, McMorris MS (2001) School readiness for children with food allergies. Ann Allerg Asthma Im 86: 172-176. https://doi.org/10.1016/S1081-1206(10)62687-7
|
| [27] |
Weiss C, Muñoz-Furlong A, Furlong TJ, et al. (2004) Impact of food allergies on school nursing practice. J Sch Nurs 20: 268-278. https://doi.org/10.1177/10598405040200050501
|
| [28] |
Furlong TJ, DeSimone J, Sicherer SH (2001) Peanut and tree nut allergic reactions in restaurants and other food establishments. J Allergy Clin Immun 108: 867-870. https://doi.org/10.1067/mai.2001.119157
|
| [29] |
Tyler TR, Blader SL (2003) The group engagement model: Procedural justice, social identity, and cooperative behavior. Pers Soc Psychol Rev 7: 349-361. https://doi.org/10.1207/S15327957PSPR0704_07
|
| [30] |
Cohen J (2001) Defining identification: A theoretical look at the identification of audiences with media characters. Mass Commun Soc 4: 245-264. https://doi.org/10.1207/S15327825MCS0403_01
|
| [31] |
Johnson JMQ, Yilmaz G, Narjarian K (2017) Optimizing the presentation of mental health information in social media: The effects of health testimonials and platforms on source perceptions, message processing, and health outcomes. Health Commun 32: 1121-1132. https://doi.org/10.1080/10410236.2016.1214218
|
| [32] |
Davis MH (1983) Measuring individual differences in empathy: Evidence for a multidimensional approach. J Pers Soc Psychol 44: 113-126. https://doi.org/10.1037/0022-3514.44.1.113
|
| [33] | Hayes AF (2018) Introduction to Mediation, Moderation, and Conditional Process Analysis: A Regression-Based Approach. New York: The Guilford Press. |
| [34] | Brehm JW (1966) A Theory of Psychological Reactance. New York: Academic Press. |
| [35] |
Witte K (1994) Fear control and danger control: A test of the extended parallel process model. Commun Monogr 61: 113-134. https://doi.org/10.1080/03637759409376328
|
| [36] |
Leiberg S, Anders S (2006) The multiple facets of empathy: A survey of theory and evidence. Prog Brain Res 156: 419-440. https://doi.org/10.1016/S0079-6123(06)56023-6
|
| [37] |
Streisand R, Mackey ER, Elliot BM, et al. (2008) Parental anxiety and depression associated with caring for a child newly diagnosed with Type 1 diabetes: Opportunities for education and counseling. Patient Educ Couns 73: 333-338. https://doi.org/10.1016/j.pec.2008.06.014
|
| [38] |
Moltchanova EV, Schreier N, Lammi N, et al. (2009) Seasonal variation of diagnosis of Type 1 diabetes mellitus in children worldwide. Diabetic Med 26: 673-678. https://doi.org/10.1111/j.1464-5491.2009.02743.x
|
| [39] |
Flokstra-de Blok BMJ, Dubois AEJ, Vlieg-Boerstra BJ, et al. (2010) Health-related quality of life of food allergic patients: comparison with the general population and other diseases. Allergy 65: 238-244. https://doi.org/10.1111/j.1398-9995.2009.02121.x
|
| [40] |
Kogurt T (2011) Someone to blame: When identifying a victim decreases helping. J Exp Soc Psychol 47: 748-755. https://doi.org/10.1016/j.jesp.2011.02.011
|
| [41] |
Festinger L (1957) A Theory of Cognitive Dissonance. Redwood City: Stanford University Press. https://doi.org/10.1515/9781503620766
|
| [42] |
Blanton H, Ikizer EG (2019) Elegant science narratives and unintended influences: Agenda for the science of science communication. Soc Issues Policy Rev 13: 154-181. https://doi.org/10.1111/sipr.12055
|
| [43] |
Aust CF, Zillman D (1996) Effects of victim exemplification in television news on viewer perceptions of social issues. Journal Mass Commun Q 73: 787-803. https://doi.org/10.1177/107769909607300403
|
 allergy-06-03-010-s001.pdf allergy-06-03-010-s001.pdf |
 |
Figures(3) / Tables(3)

Melissa Foster. The backfiring effect of fairness salience in health messages regarding food allergies and diabetes[J]. AIMS Allergy and Immunology, 2022, 6(3): 106-125. doi: 10.3934/Allergy.2022010


 DownLoad: