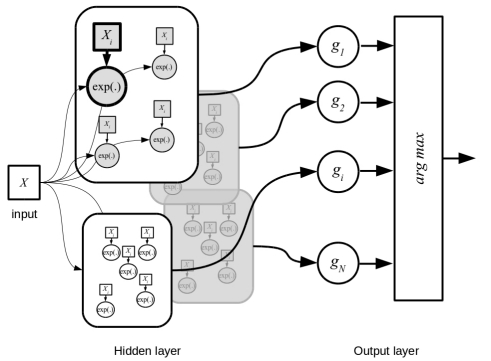
Bacteria classification has been deeply investigated with different tools for many purposes,such as early diagnosis, metagenomics, phylogenetics. Classification methods based on ribosomalDNA sequences are considered a reference in this area. We present a new classificatier for bacteriaspecies based on a dissimilarity measure of purely combinatorial nature. This measure is based onthe notion of Minimal Absent Words, a combinatorial definition that recently found applications inbioinformatics. We can therefore incorporate this measure into a probabilistic neural network in orderto classify bacteria species. Our approach is motivated by the fact that there is a vast literature on thecombinatorics of Minimal Absent Words in relation with the degree of repetitiveness of a sequence.We ran our experiments on a public dataset of Ribosomal RNA Sequences from the complex 16S. Ourapproach showed a very high score in the accuracy of the classification, proving hence that our methodis comparable with the standard tools available for the automatic classification of bacteria species.
Citation: Gabriele Fici, Alessio Langiu, Giosuè Lo Bosco, Riccardo Rizzo. Bacteria classification using minimal absent words[J]. AIMS Medical Science, 2018, 5(1): 23-32. doi: 10.3934/medsci.2018.1.23
Bacteria classification has been deeply investigated with different tools for many purposes,such as early diagnosis, metagenomics, phylogenetics. Classification methods based on ribosomalDNA sequences are considered a reference in this area. We present a new classificatier for bacteriaspecies based on a dissimilarity measure of purely combinatorial nature. This measure is based onthe notion of Minimal Absent Words, a combinatorial definition that recently found applications inbioinformatics. We can therefore incorporate this measure into a probabilistic neural network in orderto classify bacteria species. Our approach is motivated by the fact that there is a vast literature on thecombinatorics of Minimal Absent Words in relation with the degree of repetitiveness of a sequence.We ran our experiments on a public dataset of Ribosomal RNA Sequences from the complex 16S. Ourapproach showed a very high score in the accuracy of the classification, proving hence that our methodis comparable with the standard tools available for the automatic classification of bacteria species.

| [1] |
Nelson KE, Weinstock GM (2010) A catalog of reference genomes from the human microbiome. Science 328: 994–999. doi: 10.1126/science.1183605

|
| [2] | Soueidan H, NikolskiM(2016) Machine learning for metagenomics: methods and tools. Metagenomics 1: 1–19. |
| [3] | La Rosa M, Fiannaca A (2015) Probabilistic topic modeling for the analysis and classification of genomic sequences. BMC Bioinformatics 16. |
| [4] | Lo Bosco G, Pinello L (2015) A new feature selection methodology for K-mers representation of DNA sequences. In CIBB 2015 : 8623 of LNCS, 99–108. |
| [5] | Pinello L, Lo Bosco G, Hanlon B, et al. (2011) A motif-independent metric for DNA sequence specificity. BMC Bioinformatics 12. |
| [6] | Ferragina P, Giancarlo R, Greco V, et al. (2007) Compression-based classification of biological sequences and structures via the Universal Similarity Metric: experimental assessment. BMC Bioinformatics 8: 252. |
| [7] |
Fiannaca A, La Rosa M, Rizzo R, et al. (2015) A k-mer-based barcode DNA classification methodology based on spectral representation and a neural gas network. Artificial Intelligence Med 64: 173–184. doi: 10.1016/j.artmed.2015.06.002
|
| [8] |
Specht DF (1990) Probabilistic neural networks. Neural Networks 3: 109–118. doi: 10.1016/0893-6080(90)90049-Q
|
| [9] |
Chairungsee S, Crochemore M (2012) Using minimal absent words to build phylogeny. Theoretical Computer Sci 450: 109–116. doi: 10.1016/j.tcs.2012.04.031
|
| [10] |
Cole JR, Wang Q, Cardenas E, et al. (2009) The Ribosomal Database Project: improved alignments and new tools for rRNA analysis. Nucleic Acids Res 37: D141–D145. doi: 10.1093/nar/gkn879
|
| [11] | Fici G (2006) Minimal Forbidden Words and Applications. PhD thesis, Université de Marne-la-Vallée. |
| [12] | Crochemore M, Mignosi F, Restivo A, et al., (1999) Text compression using antidictionaries. In ICALP 1999 Volume: 1644 of LNCS, 261–270. |
| [13] | Barton C, Héliou A, Mouchard L, et al. (2014) Linear-time Computation of Minimal Absent Words Using Suffx Array. BMC Bioinformatics 15: 388. |
| [14] | Crochemore M, Fici G, Mercas¸ R, et al. (2016) Linear-Time Sequence Comparison Using Minimal Absent Words & Applications. In LATIN 2016 Volume: 9644 of LNCS, 334–346. |
| [15] | Pinho AJ, Ferreira PJSG, Garcia SP, et al. (2009) On finding minimal absent words. BMC Bioinformatics 10: 137. |
| [16] | Barton C, Héliou A, Mouchard L, et al. (2015) Parallelising the computation of minimal absent words. In PPAM 2015, Volume: 9574 of LNCS, 243–253. Springer. |
| [17] | Fukae H, Ota T, Morita H (2012) On fast and memory-effcient construction of an antidictionary array. In: ISIT 2012, 1092–1096. IEEE. |
| [18] |
Crochemore M, Mignosi F, Restivo A (1998) Automata and forbidden words. Information Processing Letters 67: 111–117. doi: 10.1016/S0020-0190(98)00104-5
|
| [19] | Online content: MAW: a suite on the computation and application of Minimal Absent Words. Available from: https://github.com/solonas13/maw. |
| [20] | Wang Q, Garrity GM, Tiedje JM, et al. (2007) Naive Bayesian classifier for rapid assignment of rRNA sequences into the new bacterial taxonomy, Applied Environmental Microbiology 73: 5261–5267. |
| [21] | Mao KZ, Tan KC, Ser W (2000) Probabilistic neural-network structure determination for pattern classification IEEE Transactions on neural networks. 11: 1009–1016. |
Figures(4) / Tables(2)

Gabriele Fici, Alessio Langiu, Giosuè Lo Bosco, Riccardo Rizzo. Bacteria classification using minimal absent words[J]. AIMS Medical Science, 2018, 5(1): 23-32. doi: 10.3934/medsci.2018.1.23


 DownLoad: