Research lacks an integrated approach that incorporates body composition, postural asymmetries, plantar pressure distribution, and sex comparisons to comprehensively understand the complex relationship between these variables and pain levels.
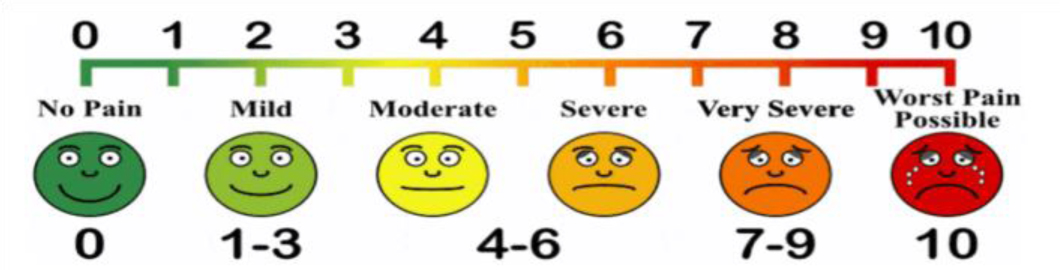
The study employed an observational cross-sectional design. The study sample comprised 52 participants of both sexes. The average age of participants was 57.35 years for males and 64.69 years for females. Pain levels were assessed using the numeric pain rating scale. Group comparisons (t-test) and machine learning algorithms were employed for analysis.
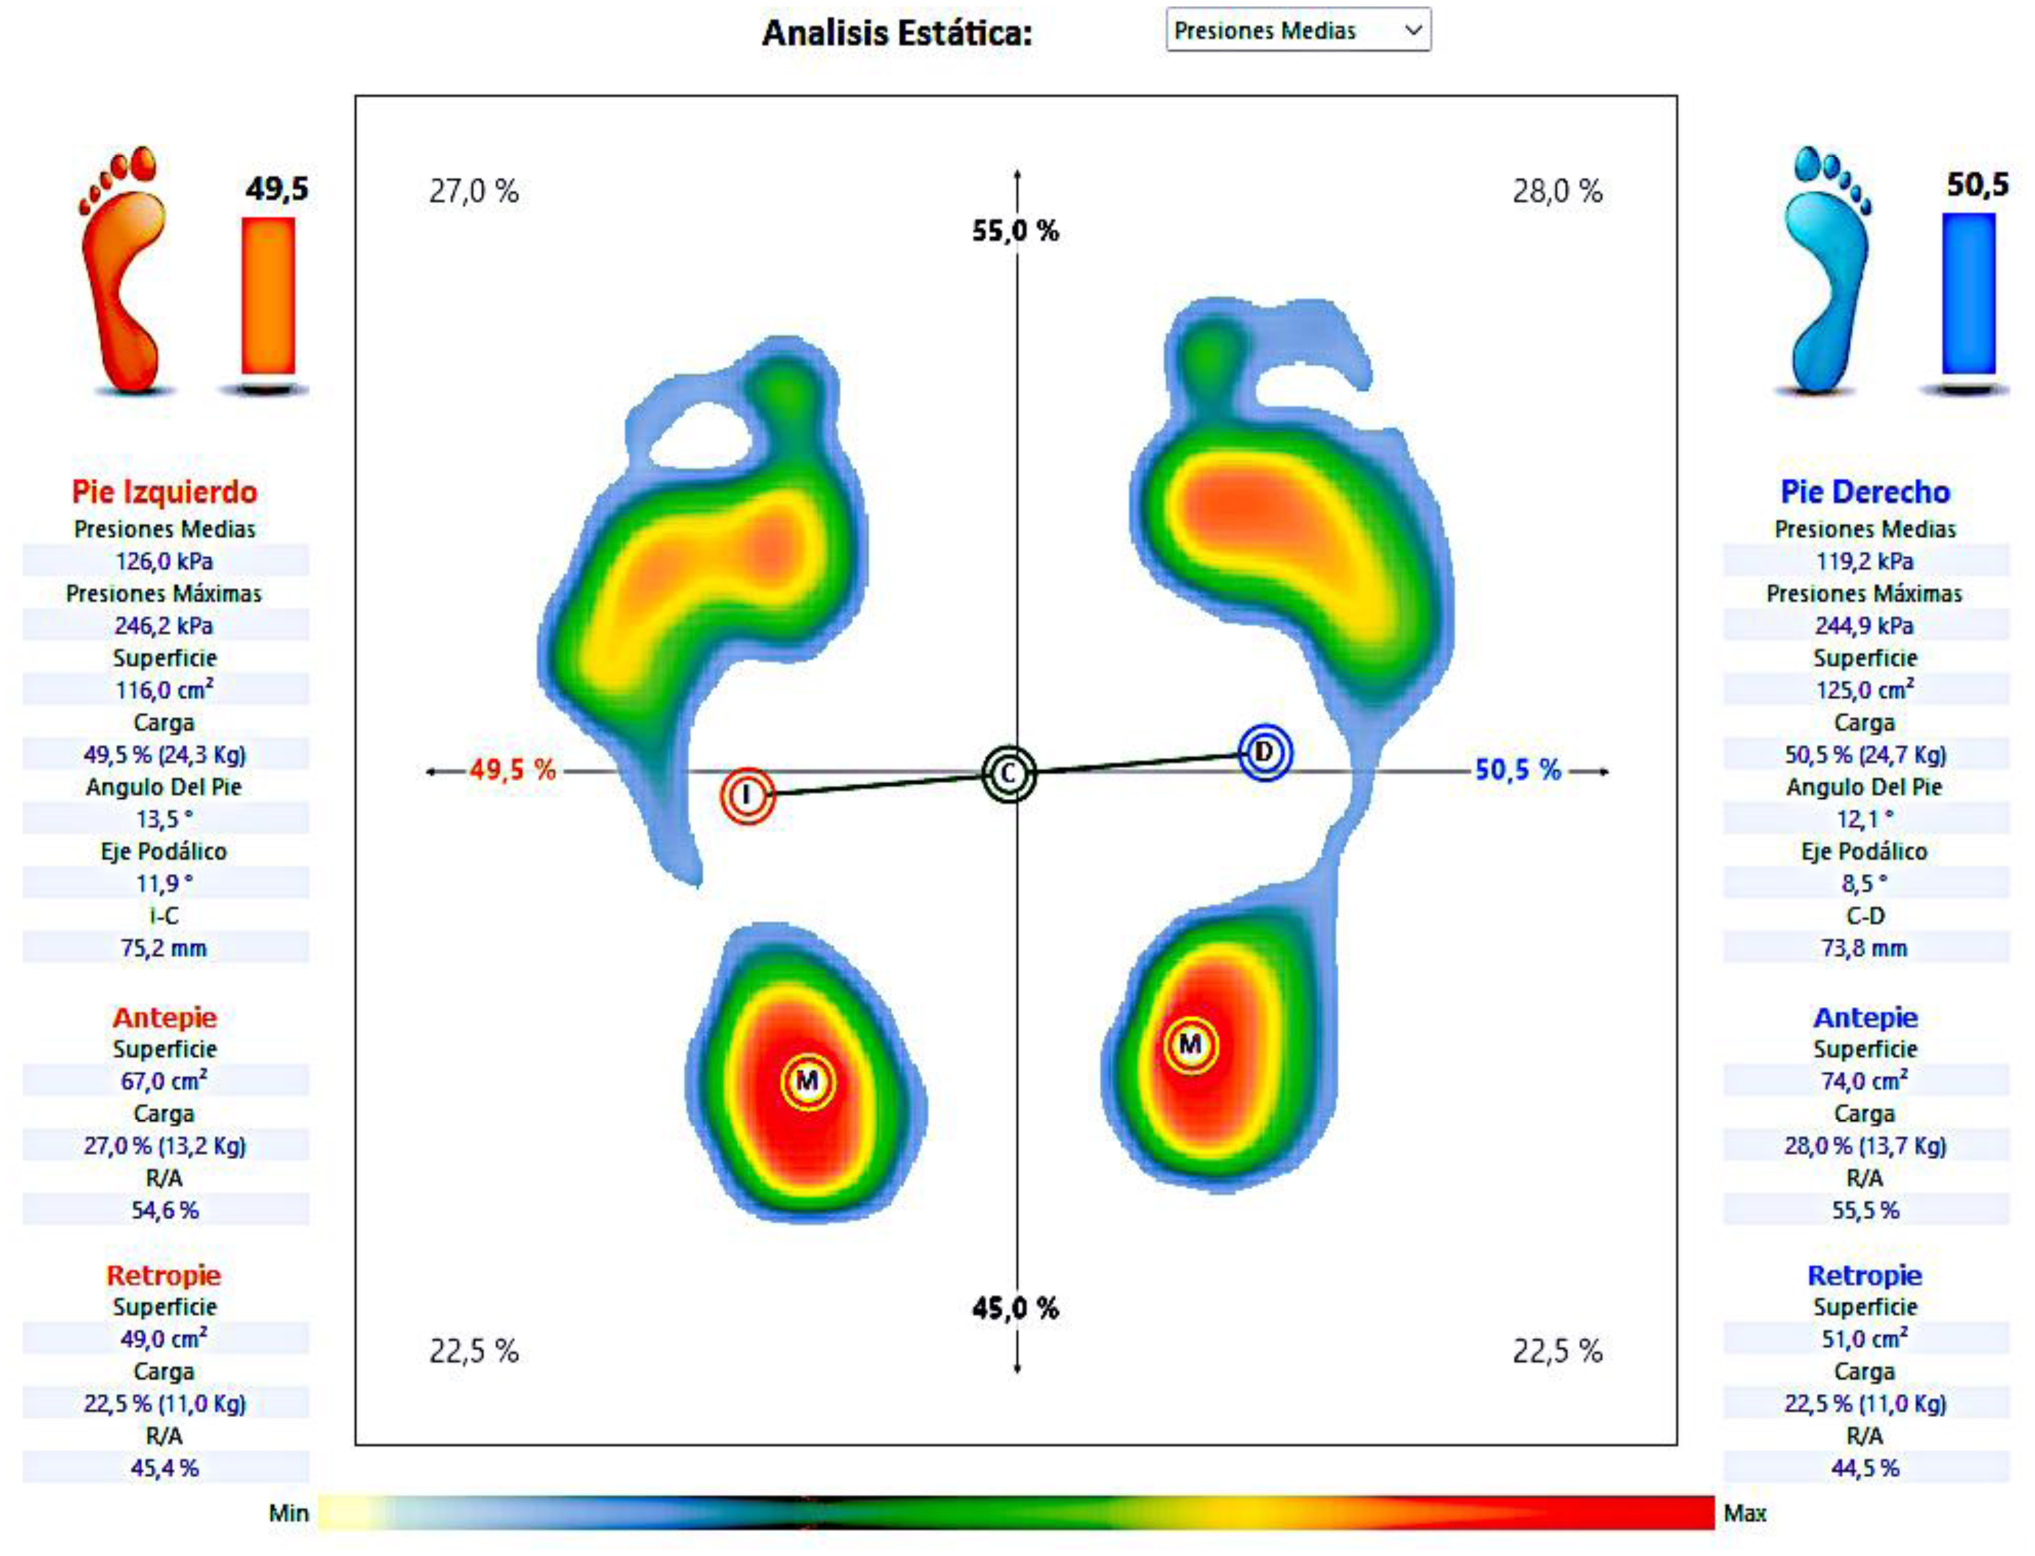
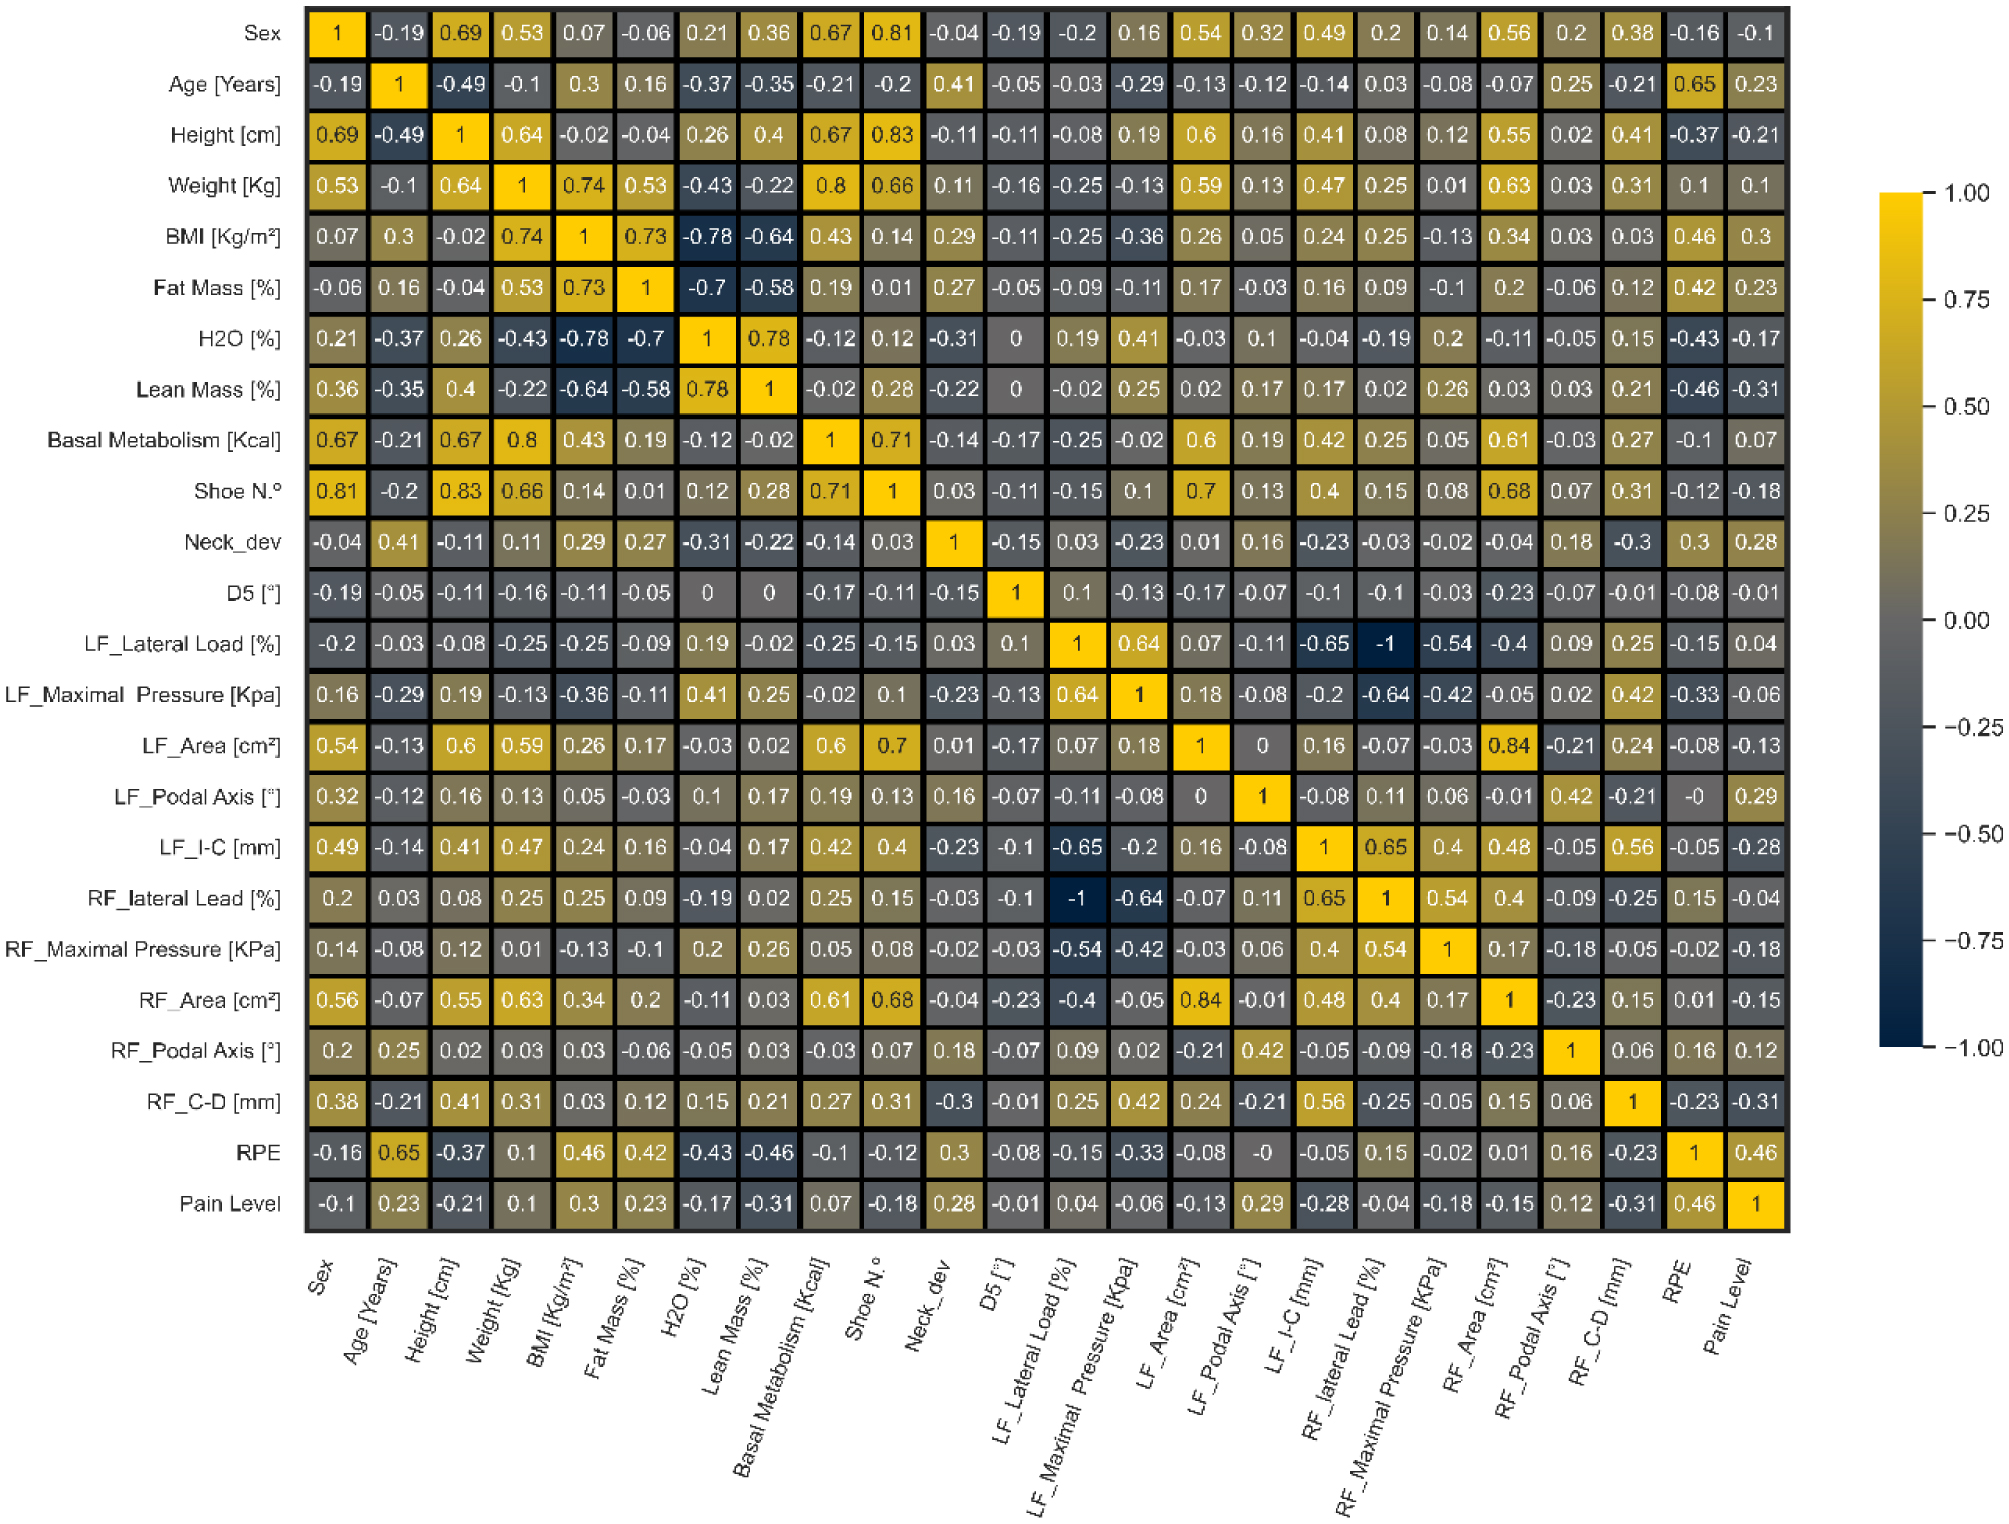
The results indicated sex differences in height, weight, lean mass percentage, basal metabolism, shoe size, left foot area, podal axis, and distance between foot and body center of pressure (COPs). Significant differences between sexes were also observed in shoulder angles (p = 0.002). Machine learning analysis revealed that neck left deviation and left knee angle were predictive of participants' pain levels.
In conclusion, this study highlights differences in baropodometry and anthropometrics between sexes, with neck deviation and left knee angle identified as predictors of pain levels.
Citation: Svitlana Dikhtyarenko, Samuel Encarnação, Dulce Esteves, Pedro Forte. The role of postural and plantar pressure asymmetries predicting pain in aging adults[J]. AIMS Biophysics, 2025, 12(2): 144-163. doi: 10.3934/biophy.2025009
Research lacks an integrated approach that incorporates body composition, postural asymmetries, plantar pressure distribution, and sex comparisons to comprehensively understand the complex relationship between these variables and pain levels.
The study employed an observational cross-sectional design. The study sample comprised 52 participants of both sexes. The average age of participants was 57.35 years for males and 64.69 years for females. Pain levels were assessed using the numeric pain rating scale. Group comparisons (t-test) and machine learning algorithms were employed for analysis.
The results indicated sex differences in height, weight, lean mass percentage, basal metabolism, shoe size, left foot area, podal axis, and distance between foot and body center of pressure (COPs). Significant differences between sexes were also observed in shoulder angles (p = 0.002). Machine learning analysis revealed that neck left deviation and left knee angle were predictive of participants' pain levels.
In conclusion, this study highlights differences in baropodometry and anthropometrics between sexes, with neck deviation and left knee angle identified as predictors of pain levels.

| [1] | Hrysomallis C, Goodman C (2001) A review of resistance exercise and posture realignment. J Strength Cond Res 15: 385-390. |
| [2] | Bell AC, Richards J, Zakrzewski-Fruer JK, et al. (2022) Sedentary behaviour—A target for the prevention and management of cardiovascular disease. Int J Env Res Pub He 20: 532. https://doi.org/10.3390/ijerph20010532 |
| [3] | Bertolazzi A, Quaglia V, Bongelli R (2024) Barriers and facilitators to health technology adoption by older adults with chronic diseases: an integrative systematic review. BMC Public Health 24: 506. https://doi.org/10.1186/s12889-024-18036-5 |
| [4] | Santos CI, Cunha AB, Braga VP, et al. (2009) Ocorrência de desvios posturais em escolares do ensino público fundamental de Jaguariúna, São Paulo. Revista Paulista de Pediatria 27: 74-80. https://doi.org/10.1590/S0103-05822009000100012 |
| [5] | Wojtkow M, Szkoda-Poliszuk K, Szotek S (2018) Influence of body posture on foot load distribution in young school-age children. Acta Bioeng Biomech 20: 101-107. https://doi.org/10.5277/ABB-01079-2018-01 |
| [6] | Kuriyan R (2018) Body composition techniques. Indian J Med Res 148: 648-658. https://doi.org/10.4103/ijmr.ijmr\_1777\_18 |
| [7] | Azevedo N, Ribeiro JC, Machado L (2022) Balance and posture in children and adolescents: a cross-sectional study. Sensors 22: 4973. https://doi.org/10.3390/s22134973 |
| [8] |
Menz HB, Dufour AB, Riskowski JL, et al. (2013) Foot posture, foot function and low back pain: The Framingham Foot Study. Rheumatology (Oxford, England) 52: 2275-2282. https://doi.org/10.1093/rheumatology/ket298 
|
| [9] |
Eriksson O, Jauhiainen A, Maad Sasane S, et al. (2019) Uncertainty quantification, propagation and characterization by Bayesian analysis combined with global sensitivity analysis applied to dynamical intracellular pathway models. Bioinformatics 35: 284-292. https://doi.org/10.1093/bioinformatics/bty607
|
| [10] | Gutiérrez-Vilahú L, Guerra-Balic M (2021) Footprint measurement methods for the assessment and classification of foot types in subjects with Down syndrome: a systematic review. J Orthop Surg Res 16: 537. https://doi.org/10.1186/S13018-021-02667-0/TABLES/2 |
| [11] |
Wong WY, Wong MS, Lo KH (2007) Clinical applications of sensors for human posture and movement analysis: a review. Prosthet Orthot Int 31: 62-75. https://doi.org/10.1080/03093640600983949
|
| [12] |
Cramer H, Mehling WE, Saha FJ, et al. (2018) Postural awareness and its relation to pain: Validation of an innovative instrument measuring awareness of body posture in patients with chronic pain. BMC Musculoskel Dis 19: 1-10. https://doi.org/10.1186/S12891-018-2031-9/TABLES/7
|
| [13] |
Alves R, Borel WP, Rossi BP, et al. (2018) Test-retest reliability of baropodometry in young asyntomatic individuals during semi static and dynamic analysis. Fisioterapia em Movimento 31: e003114. https://doi.org/10.1590/1980-5918.031.AO14
|
| [14] |
Baumfeld D, Baumfeld T, da Rocha RL, et al. (2017) Reliability of baropodometry on the evaluation of plantar load distribution: a transversal study. BioMed Res Int 2017: 5925137. https://doi.org/10.1155/2017/5925137
|
| [15] |
Fortin C, Ehrmann Feldman D, et al. (2011) Clinical methods for quantifying body segment posture: a literature review. Disabil Rehabil 33: 367-383. https://doi.org/10.3109/09638288.2010.492066
|
| [16] |
Gouveia JP, Forte P, Ribeiro J, et al. (2021) Study of the association between postural misalignments in school students. Symmetry 13: 1959. https://doi.org/10.3390/sym13101959
|
| [17] |
Singla D, Veqar Z (2017) Association between forward head, rounded shoulders, and increased thoracic kyphosis: a review of the literature. J Chiropr Med 16: 220-229. https://doi.org/10.1016/j.jcm.2017.03.004
|
| [18] |
Luo J, Wang Z, Xu L, et al. (2019) Flexible and durable wood-based triboelectric nanogenerators for self-powered sensing in athletic big data analytics. Nat Commun 10: 5147. https://doi.org/10.1038/s41467-019-13166-6
|
| [19] |
Biamonte J, Wittek P, Pancotti N, et al. (2017) Quantum machine learning. Nature 549: 195-202. https://doi.org/10.1038/nature23474
|
| [20] |
Silva AM, Siqueira GR, Silva GA (2013) Repercussões do uso do calçado de salto alto na postura corporal de adolescentes. Revista Paulista de Pediatria 31: 265-271. https://doi.org/10.1590/S0103-05822013000200020
|
| [21] |
Eickemberg M, Oliveira CC, Roriz AK, et al. (2011) Bioimpedância elétrica e sua aplicação em avaliação nutricional. Rev Nutr 24: 883-893. https://doi.org/10.1590/S1415-52732011000600009
|
| [22] |
Palmieri RM, Ingersoll CD, Stone MB, et al. (2002) Center-of-pressure parameters used in the assessment of postural control. J Sport Rehabil 11: 51-66. https://doi.org/10.1123/JSR.11.1.51
|
| [23] |
Castelo LD, Saad M, Tamaoki MJ, et al. (2022) Correlation between baropodometric parameters and functional evaluation in patients with surgically treated congenital idiopathic clubfoot. J Pediatr Orthop Part B 31: 391-396. https://doi.org/10.1097/BPB.0000000000000937
|
| [24] | Choi S, Ashdown SP 3D body scan analysis of dimensional change in lower body measurements for active body positions (2010)81: 81-93. https://doi.org/10.1177/0040517510377822 |
| [25] |
Duarte M, Freitas SM (2010) Revision of posturography based on force plate for balance evaluation. Braz J Phys Ther 14: 183-192. https://doi.org/10.1590/S1413-35552010000300003
|
| [26] | Mochizuki L, Amadio AC (2003) Aspectos biomecânicos da postura ereta: a relação entre o centro de massa e o centro de pressão. Rev Port Cien Desp 3: 77-83. |
| [27] |
Bonfim TR, Grossi DB, Paccola CA, et al. (2009) Efeito de informação sensorial adicional na propriocepção e equilíbrio de indivíduos com lesão do LCA. Acta Ortop Bras 17: 291-296. https://doi.org/10.1590/S1413-78522009000500008
|
| [28] |
Mutalimov RK, Kravtsova KV, Bairamkulova AM, et al. (2021) Diseases of the musculoskeletal system and rheumatic diseases: prevention and rehabilitation in modern conditions. J Pharm Res Int 33: 419-424. https://doi.org/10.9734/jpri/2021/v33i46B32956
|
| [29] |
Al Kuwaiti A, Nazer K, Al-Reedy A, et al. (2023) A review of the role of artificial intelligence in healthcare. J Pers Med 13: 951. https://doi.org/10.3390/jpm13060951
|
| [30] | Naveed MA (2023) Transforming healthcare through artificial intelligence and machine learning. Pak J Health Sci 4: 1. https://doi.org/10.54393/pjhs.v4i05.844 |
| [31] |
Nichols E, Steinmetz JD, Vollset SE, et al. (2022) Estimation of the global prevalence of dementia in 2019 and forecasted prevalence in 2050: an analysis for the Global Burden of Disease Study 2019. Lancet Public Health 7: e105-e125. https://doi.org/10.1016/S2468-2667(21)00249-8
|
| [32] |
Unpingco J (2016) Python for Probability, Statistics, and Machine Learning. Springer.
|
| [33] |
Brunelli C, Zecca E, Martini C, et al. (2010) Comparison of numerical and verbal rating scales to measure pain exacerbations in patients with chronic cancer pain. Health Qual Life Out 8: 1-8. https://doi.org/10.1186/1477-7525-8-42/TABLES/4
|
| [34] |
Li L, Liu X, Herr K (2007) Postoperative pain intensity assessment: a comparison of four scales in Chinese adults. Pain Med 8: 223-234. https://doi.org/10.1111/J.1526-4637.2007.00296.X/2/PME_296_F4.JPEG
|
| [35] |
Michener LA, Snyder AR, Leggin BG (2011) Responsiveness of the numeric pain rating scale in patients with shoulder pain and the effect of surgical status. J Sport Rehabil 20: 115-128. https://doi.org/10.1123/JSR.20.1.115
|
| [36] |
Moisset X, Attal N, de Andrade DC (2022) An emoji-based visual analog scale compared with a numeric rating scale for pain assessment. JAMA 328: 1980-1980. https://doi.org/10.1001/JAMA.2022.16940
|
| [37] |
Miró J, Castarlenas E, Huguet A (2009) Evidence for the use of a numerical rating scale to assess the intensity of pediatric pain. Eur J Pain 13: 1089-1095. https://doi.org/10.1016/J.EJPAIN.2009.07.002
|
| [38] |
Pagé MG, Katz J, Stinson J, et al. (2012) Validation of the numerical rating scale for pain intensity and unpleasantness in pediatric acute postoperative pain: sensitivity to change over time. J Pain 13: 359-369. https://doi.org/10.1016/j.jpain.2011.12.010
|
| [39] |
Kim JM, Kim MW, Do HJ (2016) Influence of hyperlipidemia on the treatment of supraspinatus tendinopathy with or without tear. Ann Rehabil Med 40: 463-469. https://doi.org/10.5535/ARM.2016.40.3.463
|
| [40] |
Hjermstad MJ, Fayers PM, Haugen DF, et al. (2011) Studies comparing numerical rating scales, verbal rating scales, and visual analogue scales for assessment of pain intensity in adults: a systematic literature review. J Pain Symptom Manag 41: 1073-1093. https://doi.org/10.1016/j.jpainsymman.2010.08.016
|
| [41] |
Pieh C, Neumeier S, Loew T, et al. (2014) Effectiveness of a multimodal treatment program for somatoform pain disorder. Pain Pract 14: E146-E151. https://doi.org/10.1111/PAPR.12144
|
| [42] |
Cohen J (2013) Statistical Power Analysis for the Behavioral Sciences. Routledge. https://doi.org/10.4324/9780203771587
|
| [43] |
Cai J, Luo J, Wang S, et al. (2018) Feature selection in machine learning: a new perspective. Neurocomputing 300: 70-79. https://doi.org/10.1016/j.neucom.2017.11.077
|
| [44] | Python, março 8, Welcome to Python.org, Python, 2023. Available from: https://www.python.org |
| [45] |
Singh D, Singh B (2020) Investigating the impact of data normalization on classification performance. Appl Soft Comput 97: 105524. https://doi.org/10.1016/j.asoc.2019.105524
|
| [46] |
Hicks SA, Strümke I, Thambawita V, et al. (2022) On evaluation metrics for medical applications of artificial intelligence. Sci Rep-UK 12: 5979. https://doi.org/10.1038/s41598-022-09954-8
|
| [47] |
Chai T, Draxler RR (2014) Root mean square error (RMSE) or mean absolute error (MAE)?—Arguments against avoiding RMSE in the literature. Geosci Model Dev 7: 1247-1250. https://doi.org/10.5194/gmd-7-1247-2014
|
| [48] | Xgboost: XGBoost Python Package (Versão 2.1.4) [Python; OS Independent], 2024. Available from: https://pypi.org/project/xgboost/ |
| [49] | BayesianRidge, Scikit-Learn, 2007. Available from: https://scikit-learn.org/stable/modules/generated/sklearn.linear_model.BayesianRidge.html |
| [50] | LinearRegression, Scikit-Learn, 2007. Available from: https://scikit-learn.org/stable/modules/generated/sklearn.linear_model.LinearRegression.html |
| [51] | Scikit-learn, RandomForestRegressor, Scikit-Learn, 2007. Available from: https://scikit-learn.org/stable/modules/generated/sklearn.ensemble.RandomForestRegressor.html |
| [52] | DecisionTreeRegressor, Scikit-Learn, 2007. Available from: https://scikit-learn.org/stable/modules/generated/sklearn.tree.DecisionTreeRegressor.html |
| [53] | SVR, Scikit-Learn, 2007. Available from: https://scikit-learn.org/stable/modules/generated/sklearn.svm.SVR.html |
| [54] |
Chicco D, Warrens MJ, Jurman G (2021) The coefficient of determination R-squared is more informative than SMAPE, MAE, MAPE, MSE and RMSE in regression analysis evaluation. PeerJ Comput Sci 7: e623. https://doi.org/10.7717/peerj-cs.623
|
| [55] |
Bradshaw TJ, Huemann Z, Hu J, et al. (2023) A guide to cross-validation for artificial intelligence in medical imaging. Radiol Artif Intell 5: 220232. https://doi.org/10.1148/ryai.220232
|
| [56] |
Hooker SA, Oswald LB, Reid KJ, et al. (2020) Do physical activity, caloric intake, and sleep vary together day to day? Exploration of intraindividual variability in 3 key health behaviors. J Phys Act Health 17: 45-51. https://doi.org/10.1123/jpah.2019-0207
|
| [57] |
Caselli A, Pham H, Giurini JM, et al. (2002) The forefoot-to-rearfoot plantar pressure ratio is increased in severe diabetic neuropathy and can predict foot ulceration. Diabetes Care 25: 1066-1071. https://doi.org/10.2337/diacare.25.6.1066
|
| [58] |
Henriksson H, Henriksson P, Tynelius P, et al. (2020) Cardiorespiratory fitness, muscular strength, and obesity in adolescence and later chronic disability due to cardiovascular disease: a cohort study of 1 million men. Eur Heart J 41: 1503-1510. https://doi.org/10.1093/eurheartj/ehz774
|
| [59] |
Cheung JT, Zhang M, Leung AK, et al. (2005) Three-dimensional finite element analysis of the foot during standing—A material sensitivity study. J Biomech 38: 1045-1054. https://doi.org/10.1016/j.jbiomech.2004.05.035
|
| [60] |
Koes BW, Van Tulder M, Lin CW, et al. (2010) An updated overview of clinical guidelines for the management of non-specific low back pain in primary care. Eur Spine J 19: 2075-2094. https://doi.org/10.1007/s00586-010-1502-y
|
| [61] |
Field S, Treleaven J, Jull G (2008) Standing balance: a comparison between idiopathic and whiplash-induced neck pain. Manual Ther 13: 183-191. https://doi.org/10.1016/j.math.2006.12.005
|
| [62] | Storsveen M (2013) Observational pain scales in critically Ill adults. Crit Care Nurse 33: 68-78. https://doi.org/10.4037/ccn2013804 |
| [63] |
Roué JM, Rioualen S, Gendras J, et al. (2018) Multi-modal pain assessment: are near-infrared spectroscopy, skin conductance, salivary cortisol, physiologic parameters, and Neonatal Facial Coding System interrelated during venepuncture in healthy, term neonates?. J Pain Res 11: 2257-2267. https://doi.org/10.2147/JPR.S165810
|
| [64] |
Yücel MA, Aasted CM, Petkov MP, et al. (2015) Specificity of hemodynamic brain responses to painful stimuli: a functional near-infrared spectroscopy study. Sci Rep 5: 9469. https://doi.org/10.1038/srep09469
|
| [65] | Tu Y, Tan A, Bai Y, et al. (2016) Decoding subjective intensity of nociceptive pain from pre-stimulus and post-stimulus brain activities. Front Comput Neurosc 10: 32. https://doi.org/10.3389/fncom.2016.00032 |
| [66] |
Bak N, Rostrup E, Larsson HB, et al. (2013) Concurrent functional magnetic resonance imaging and electroencephalography assessment of sensory gating in schizophrenia. Hum Brain Mapp 35: 3578-3587. https://doi.org/10.1002/hbm.22422
|
| [67] |
Ocay DD, Teel EF, Luo OD, et al. (2022) Electroencephalographic characteristics of children and adolescents with chronic musculoskeletal pain. Pain Rep 7: e1054. https://doi.org/10.1097/PR9.0000000000001054
|
| [68] |
Gibson RM, Fernández-Espejo D, Gonzalez-Lara LE, et al. (2014) Multiple tasks and neuroimaging modalities increase the likelihood of detecting covert awareness in patients with disorders of consciousness. Front Hum Neurosci 8: 950. https://doi.org/10.3389/fnhum.2014.00950
|
| [69] |
Vijayakumar V, Case M, Shirinpour S, et al. (2017) Quantifying and characterizing tonic thermal pain across subjects from EEG data using random forest models. IEEE T Bio-Med Eng 64: 2988-2996. https://doi.org/10.1109/TBME.2017.2756870
|
| [70] |
Ruhe A, Fejer R, Walker B (2011) Center of pressure excursion as a measure of balance performance in patients with non-specific low back pain compared to healthy controls: a systematic review of the literature. Eur Spine J 20: 358-368. https://doi.org/10.1007/s00586-010-1543-2
|
| [71] |
Kirchengast S (2010) Gender differences in body composition from childhood to old age: an evolutionary point of view. J Life Sc 2: 1-10. https://doi.org/10.1080/09751270.2010.11885146
|
| [72] |
Capodaglio P, Cimolin V, Tacchini E, et al. (2012) Balance control and balance recovery in obesity. Curr Obes Rep 1: 166-173. https://doi.org/10.1007/s13679-012-0018-7
|
| [73] | Lövdal SS, Den Hartigh RJ, Azzopardi G (2021) Injury prediction in competitive runners with machine learning. Int J Sport Physiol 16: 1522-1531. https://doi.org/10.1123/ijspp.2020-0518 |
| [74] |
Fillingim RB, King CD, Ribeiro-Dasilva MC (2009) Sex, gender, and pain: a review of recent clinical and experimental findings. J Pain 10: 447-485. https://doi.org/10.1016/j.jpain.2008.12.001
|
| [75] |
Balthillaya GM, Parsekar SS, Gangavelli R, et al. (2022) Effectiveness of posture-correction interventions for mechanical neck pain and posture among people with forward head posture: protocol for a systematic review. BMJ Open 12: e054691. https://doi.org/10.1136/bmjopen-2021-054691
|
| [76] |
Mahmoud NF, Hassan KA, Abdelmajeed SF, et al. (2019) The relationship between forward head posture and neck pain: a systematic review and meta-analysis. Curr Rev Musculoske 12: 562-577. https://doi.org/10.1007/s12178-019-09594-y
|
Figures(3) / Tables(5)

Svitlana Dikhtyarenko, Samuel Encarnação, Dulce Esteves, Pedro Forte. The role of postural and plantar pressure asymmetries predicting pain in aging adults[J]. AIMS Biophysics, 2025, 12(2): 144-163. doi: 10.3934/biophy.2025009


 DownLoad: