Loading [MathJax]/jax/output/SVG/jax.js

Vaccination strategies through intra—compartmental dynamics

  • Received: 01 April 2021 Revised: 01 July 2021 Published: 23 March 2022
  • Primary: 92D30; Secondary: 35L65

  • We present a new epidemic model highlighting the roles of the immunization time and concurrent use of different vaccines in a vaccination campaign. To this aim, we introduce new intra-compartmental dynamics, a procedure that can be extended to various other situations, as detailed through specific case studies considered herein, where the dynamics within compartments are present and influence the whole evolution.

    Citation: Rinaldo M. Colombo, Francesca Marcellini, Elena Rossi. Vaccination strategies through intra—compartmental dynamics[J]. Networks and Heterogeneous Media, 2022, 17(3): 385-400. doi: 10.3934/nhm.2022012

    Related Papers:

    [1] Qi Luo, Ryan Weightman, Sean T. McQuade, Mateo Díaz, Emmanuel Trélat, William Barbour, Dan Work, Samitha Samaranayake, Benedetto Piccoli . Optimization of vaccination for COVID-19 in the midst of a pandemic. Networks and Heterogeneous Media, 2022, 17(3): 443-466. doi: 10.3934/nhm.2022016
    [2] Prateek Kunwar, Oleksandr Markovichenko, Monique Chyba, Yuriy Mileyko, Alice Koniges, Thomas Lee . A study of computational and conceptual complexities of compartment and agent based models. Networks and Heterogeneous Media, 2022, 17(3): 359-384. doi: 10.3934/nhm.2022011
    [3] Xia Li, Chuntian Wang, Hao Li, Andrea L. Bertozzi . A martingale formulation for stochastic compartmental susceptible-infected-recovered (SIR) models to analyze finite size effects in COVID-19 case studies. Networks and Heterogeneous Media, 2022, 17(3): 311-331. doi: 10.3934/nhm.2022009
    [4] Eiman, Kamal Shah, Muhammad Sarwar, Thabet Abdeljawad . On rotavirus infectious disease model using piecewise modified $ ABC $ fractional order derivative. Networks and Heterogeneous Media, 2024, 19(1): 214-234. doi: 10.3934/nhm.2024010
    [5] Ryan Weightman, Temitope Akinode, Benedetto Piccoli . Optimal control of pandemics via a sociodemographic model of non-pharmaceutical interventions. Networks and Heterogeneous Media, 2024, 19(2): 500-525. doi: 10.3934/nhm.2024022
    [6] Guillaume Cantin, Cristiana J. Silva, Arnaud Banos . Mathematical analysis of a hybrid model: Impacts of individual behaviors on the spreading of an epidemic. Networks and Heterogeneous Media, 2022, 17(3): 333-357. doi: 10.3934/nhm.2022010
    [7] Xavier Blanc, Claude Le Bris, Frédéric Legoll, Tony Lelièvre . Beyond multiscale and multiphysics: Multimaths for model coupling. Networks and Heterogeneous Media, 2010, 5(3): 423-460. doi: 10.3934/nhm.2010.5.423
    [8] Richard Carney, Monique Chyba, Taylor Klotz . Using hybrid automata to model mitigation of global disease spread via travel restriction. Networks and Heterogeneous Media, 2024, 19(1): 324-354. doi: 10.3934/nhm.2024015
    [9] Yimamu Maimaiti, Zunyou Lv, Ahmadjan Muhammadhaji, Wang Zhang . Analyzing vegetation pattern formation through a time-ordered fractional vegetation-sand model: A spatiotemporal dynamic approach. Networks and Heterogeneous Media, 2024, 19(3): 1286-1308. doi: 10.3934/nhm.2024055
    [10] Xia Li, Andrea L. Bertozzi, P. Jeffrey Brantingham, Yevgeniy Vorobeychik . Optimal policy for control of epidemics with constrained time intervals and region-based interactions. Networks and Heterogeneous Media, 2024, 19(2): 867-886. doi: 10.3934/nhm.2024039
  • We present a new epidemic model highlighting the roles of the immunization time and concurrent use of different vaccines in a vaccination campaign. To this aim, we introduce new intra-compartmental dynamics, a procedure that can be extended to various other situations, as detailed through specific case studies considered herein, where the dynamics within compartments are present and influence the whole evolution.


    In this paper we propose an epidemiological compartmental model where the efficacy time of vaccinations, i.e., the time a dosed individual needs to become immune, plays a key role. Furthermore, we also account for the concurrent effect of different vaccines, differing, for instance, in the time they need to provide immunization. The role of age can also be accounted for, letting vaccines' efficacy and immunization times depend on age, as well as on the choice of the vaccine type. These features are well known to be relevant in the present Covid-19 pandemic.

    Compartmental models are a formidable tool in the description of a variety of real situations. The techniques above suggest a general framework able to introduce a specific dynamic evolution within compartments. In these models, each individual is considered to be of one compartment at any given time, its evolution consisting in passing from one compartment to another one, based on the structure and on the parameters of the model. In other words, the global dynamics consist in individuals entering the system (e.g., newborns), others leaving the system (e.g., casualties) and, during the evolution, passing from one compartment to another (e.g., getting ill, being vaccinated, recovering, ). Intra-compartmental dynamics allows both to group the movements among specific compartments into a smooth evolution, and to detail the evolution within given compartments.

    In the context of epidemiological models describing the spread of infectious diseases, the SIR model, named after its three compartments (Susceptible, Infected and Recovered), is the traditional prototype. This epidemic model dates back to 1927, see [16], less than a decade after the 1918 influenza pandemic. In what is probably its simplest form [22,§10.2], a prototype SIR model reads

    SIR{˙S=ρIS˙I=ρIS(ϑ+μ)I˙R=ϑI (1)

    where t is time, ρ and ϑ describe the transmission of the disease and the speed of recovery. Mortality of infected individuals is measured by μ.

    The popularity of (1) is due partly to its simplicity, which allows to describe the disease behavior by estimating a small number of parameters, and partly to its being amenable to a variety of extensions. The dynamics of the SIR epidemic model are widely considered, here we recall for instance [1,4,21,25], or [14,Chapter 6], [22,Chapter 10], and [23,§1.5.1].

    The literature on SIR-type models, typically containing additional compartments, is indeed huge. For instance, SEIR and SEIRS-type models contain also the compartment E (Exposed) where infected individuals spend a latent/incubation period prior to become infective, see [12,13,18,19] and the references therein. Vaccination campaigns and effects are described in SVIR-type models which consider individuals that get vaccinated, see [9,17,20] or also the different approach in [5].

    Recall also, for instance, the SIHR model proposed in [6], where infected individuals are either Infective (I) or Hospitalized (H), the former ones spreading the disease, while the latter ones being isolated, typically hospitalized or in quarantine, thus taking into account lockdown effects.

    Since 2020, with the Covid-19 pandemic, the development and use of these models boomed. The need to explicitly introduce the immunization time of a vaccine and the concurrent use of different vaccines lead us to introduce a dynamics within compartments. This machinery allows to fix a priori the time an individual spends in a compartment, as in the case of the immunization time of a vaccine, see §2, allowing also this time to be age dependent, as in §3. This general framework is sufficiently flexible to account for the simultaneous adoption of different vaccines, as in model (4).

    In other instances, it might be appropriate to smoothen the change of status related to the change of compartment, an example being the SEIR model as modified in §4. Indeed, pass from (15) to (16) allows to account for a somewhat continuous evolution from exposed to infective. In all these examples, key statistics, such as the basic reproduction number, are naturally extended to these new frameworks keeping their original meaning.

    Worth mentioning is the recent SIDARTHE model from [11], consisting of 8 compartments. Indeed, while simplicity is a peculiarity of the SIR model, it is also a limit. The need to describe more complex dynamics often leads to more elaborate models. The framework we present below, at the expense of a few analytic technicalities, also allows to regroup similar compartments together obtaining a conceptual simplification, as in the extension to the SIDARTHE model proposed in §5.

    In §6, the SIHR model is modified to comprehend spatial (geographic) movements. The introduction of the age structure, where advisable, is in general possible, as shown in §7. These two steps, namely the introduction of space and age structures, are indeed doable in all the examples discussed.

    Remark that the present framework indeed provides an extension to the current compartmental modeling habits. In fact, suitable choices of various functions or parameters allow to trivialize intra–compartmental dynamics, thus recovering known models.

    Pandemic dynamics can clearly be described through many other tools. For instance, the recent work [2] proposes a multiscale approach and discusses the current kinetic literature on the subject. Cellular automata are used for instance in [10] in a probabilistic setting, still with a compartmental structure, see [10,Figure 1 (b)]. The literature also offers essays correlating pandemics to other human activities, primarily to economy, see for instance [8].

    Figure 1. 

    Solutions to (3)–(7)–(8) in the 4 cases T=7,21,35,49

    .

    In the effective application of the models discussed below, a key issue is parameters' estimation. We defer for instance to [24] and to [27] for two entirely different approaches.

    From the analytic point of view, a rigorous abstract approach to these classes of models is possible but at the cost of a quite intricate PDE based formalism, see a first attempt in [7]. Therefore, the sequel is devoted to show that intra-compartmental dynamics can both refine usual models, and also take into account new features, not captured by standard compartmental models.

    The model presented in [20], here slightly modified, amounts to this extension of (1):

    VSIR{˙S=ρSISp(t,S)˙V=p(t,S)ρVIVϑVV˙I=(ρSS+ρVV)I(ϑI+μ)I˙R=ϑII+ϑVV. (2)

    Here, V is the number of vaccinated individuals, p(t,S) measures the speed with which vaccinations of at most S individuals take place at time t, while μ is the mortality rate, ρS,ρV measure infectivity, ϑI and ϑV are the recovery rates.

    Before introducing the immunization time in (2), we remark that setting p(t,S)=αS and introducing the usual mortality terms for the S, V and R populations, we recover precisely the case considered in [20].

    The effect of doses, as is well known, is not immediate. On the contrary, the time T that dosed individuals need to wait to get immunization plays a key role. Whenever a vaccine needs two (or more) doses, T measures the time from the first dose to full immunization. Therefore, we propose the following model:

    V(0)V(T)SIR{˙S=ρSISp(t,S)tV+τV=ρVIV˙I=(ρSS+T0ρVV)IϑIμI˙R=ϑI+V(t,T)V(t,0)=p(t,S(t)). (3)

    Here, the number of individuals at time t that were dosed at time tτ is V=V(t,τ), defined for tR+ and τ[0,T]. In other words, τ is the time since (the first) vaccination occurred. Note moreover that it is very reasonable to assume that ρV is τ dependent, since ρV(τ) measures the ease with which vaccinated but not yet immunized individuals may get infected after time τ from the (first) dose. Note that also in the former model (2) the term ρVIV is present and it implies that vaccinated individuals actually can get infected, but therein independently of the time from vaccination.

    In connection with the present Covid-19 pandemic, we remark that model (3) can be easily extended to the case of different, say m, vaccines having different efficacy times T1,,Tm. Indeed, denote by V, for =1,,m, the number of individuals dosed with the –th vaccine. We have

    V(0)V(T)=1,,mSIR{˙S=ρSISm=1p(t,S)tV+τV=ρVIV˙I=(ρSS+m=1T0ρVV)I(ϑ+μ)I˙R=ϑI+m=1V(t,T)V(t,0)=p(t,S(t)). (4)

    Note that, as is to be expected, according to (4) the total number of individuals is affected only by mortality, in the sense that

    ddt(S(t)+m=1T0V(t,τ)dτ+I(t)+R(t))=μI(t).

    A parameter often used to describe the tendency of the pandemic is the (time dependent) basic reproduction number Ro(t). Within (4), it is explicitly computed:

    Ro(t)=ρSS(t)+m=1T0ρV(τ)V(t,τ)dτϑ+μ, (5)

    so that the increasing in the infected individuals at time t is equivalent to Ro(t)>1:

    ddtI(t)0Ro(t)1. (6)

    The above equivalence holds also in the case of the parameters ρS, ρV, ϑ and μ being time dependent.

    At first sight, the numerator in the right hand side of (5) is misleading, for it apparently implies that higher values of V lead to an increase in Ro(t). On the contrary, increasing V causes a decrease in S and, even more important, individuals remain in the V compartment only for a finite time T, then passing to the R compartment and thus reducing the value of Ro. Moreover, it is reasonable to assume that ρSρV.

    A direct comparison between (2) and (3), though suggestive, is inevitably highly arbitrary. Clearly, V(t) in (2) has to be compared to T0V(t,τ)dτ in (3). However the key mechanism with which V individuals enter the R population in (2) can hardly be related to that transforming V into R in (3). In the former case, at any time t, the prescribed portion ϑVV(t) of the V population enters R. On the contrary, in (3), at time t all V(t,T) individuals after time T from vaccination enter R. Formally, this difference is evident noting that the parameter ϑV in (2) has no counterpart in (3) while, on the other hand, the time T in (3) has no analogue in (2).

    Thus, below, to investigate the role of T, we compare the evolutions of instances of (3) differing only in the time necessary for vaccination to ensure immunization. Referring to (3), we choose the following parameters1

    1 χA is the characteristic function of the set A: χA(x)=1xA and χA(x)=0xA.

    ρS=5×10⁴ϑ=1×10³μ=1×10⁴ρV(τ)=ρS1τTp(t,S)=0.5χ[10,+[(t)χR+(S) (7)

    and initial data

    So=99.9,Vo(τ)0,Io=0.1,Ro=0. (8)

    We consider 8 sample choices for the time required by vaccination to become effective and compute the corresponding number of deaths, the results are in Table 1. Clearly, a shorter value of T is preferable. We provide in Figure 1 diagrams of the solutions corresponding to T=7,21,35,49. Note first that the dynamics of the S compartment is hardly affected by the changes in T, the key differences being in the I and R populations.

    Table 1. 

    Times necessary for the vaccination to provide immunity and corresponding casualties according to model (3)–(7)–(8). The initial total population is 100

    .
    T (days) 1 7 14 21 28 35 42 49
    Deaths: 0.28 0.32 0.37 0.43 0.49 0.56 0.63 0.70

     | Show Table
    DownLoad: CSV

    The relevant differences in the diagram of the map tT0V(t,τ)dτ heavily depend on the different lengths of the time interval where V is integrated. Moreover, higher values of T results in more members of the V population get infected, coherently with (3). This explains the rather horizontal plateau in the V diagram for T=7, which is replaced by a clearly decreasing profile when T=35 and T=49.

    In Figure 1, the differences in the I diagrams are evident and clear: higher values of T enhance the spreading of the virus, causing a higher number of infected individuals and, hence, of casualties.

    The evolutions in the R populations are similar. Note however that they are slightly translated one with respect to the other, due to the delay with which dosed individuals are immunized and, hence, enter the R population according to (3). It is mostly this delay that explains the differences in the casualties, as reported in Table 1.

    The flexibility introduced by dynamics internal to the dosed (V) population allows also to take into consideration variations in this evolution. Assume, for instance, that vaccines are unavailable between times, say, 30 and 120, so that we replace p in (7) with

    p(t,S)=0.5χ[10,30][120,+[(t)χR+(S). (9)

    Then, the number of casualties sharply grows with respect to the number of casualties in (3)–(7)–(8), as clearly shown when comparing Table 1 with Table 2.

    Table 2. 

    Times necessary for the vaccination to provide immunity and corresponding casualties, according to model (3)–(7)–(8), in the case vaccinations are suspended as detailed in (9). The initial total population is 100

    .
    T 1 7 14 21 28 35 42 49
    Deaths: 1.11 1.18 1.25 1.32 1.38 1.43 1.48 1.53

     | Show Table
    DownLoad: CSV

    The diagrams in Figure 2 also confirm the negative effect in a suspension of the vaccination campaign.

    Figure 2. 

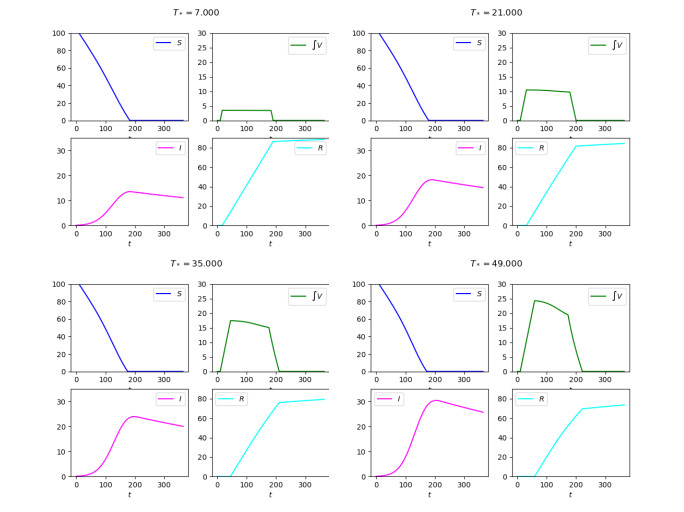
    Diagrams of the solutions to (3)–(7)–(8) with a suspension in the vaccination campaign as detailed in (9) in the 4 cases T=7,21,35,49

    .

    As a further example, we consider the problem of choosing between two different vaccines. We integrate (4) with m=2 and supplement the data and parameters in (7)–(8)

    T1=7ρV1(τ)=ρS1τT1p1(t,S)=ωχ[20,+[(t)χR+(S)T2=35ρV2(τ)=0.2ρS1τT2p2(t,S)=(0.5ω)χ[20,+[(t)χR+(S), (10)

    with the parameter ω[0,0.5] determining the amount of vaccines of the two types dosed at each time. These choices correspond to the situation where two different vaccines are available. The first one is effective after only T1=7 days, while the latter needs T2=35 days to provide full immunization. On the other hand, the second vaccine provides a far better protection immediately after the first shot, as it follows from ρV1=5ρV2 in (10). The resulting integrations in Figure 3 show that the two rather different strategies resulting from ω=0.1 and ω=0.4 actually lead to similar results for what concerns the number of casualties. In the two cases, however, the global costs of the two campaigns might be significantly different, due to the different costs of the vaccines and of their distribution.

    Figure 3. 

    Diagrams of the solutions to (4)–(7)–(8)–(10). On the left with ω=0.1 and, on the right, with ω=0.4

    .

    The insertion of an intra–compartmental dynamics is not limited to ODE models. As it is well known, age differences often have a role in the spreading of diseases. Therefore, we introduce the following extension of (3):

    {tS+aS=R+ρ(t,a,α)I(t,α)dαSp(t,a,S)tV+aV+τV=ρVIVtI+aI=R+ρ(t,a,α)I(t,α)dαS+R+T0ρV(t,a,τ,α)V(t,α,τ)dαdτIϑIμItR+aR=ϑI+V(t,a,T), (11)

    Vaccination entering also as boundary datum in the evolution of the V population:

    V(t,a,0)=p(t,a,S(t,a)). (12)

    In (11)–(12), we use the same symbols as in (3), allowing the various parameters to depend also on age. For instance ρ=ρ(t,a,α) describes the ease with which I individuals of age α infect members of the S population of age a at time t, and similarly for ρV.

    System (11) needs to be supplied with initial and boundary data, such as

    {S(0,a)=So(a)V(0,a,τ)=Vo(a,τ)I(0,a)=Io(a)R(0,a)=Ro(a){S(t,0)=Sb(t)V(t,0,τ)=0I(t,0)=0R(t,0)=0 (13)

    where, as it is realistic, we set to 0 the birth rate of vaccinated, infected and recovered individuals.

    Note that setting all data and parameters in (11)–(12)–(13) constant in a, we essentially reobtain the previous model (3), essentially meaning that S,V,I,R in (3) have to be replaced by their integrals over aR+.

    Extending the analogous property valid for system (3), note that the total number of individuals varies not only due to mortality but also due to the natality Sb(t), indeed

    ddtR+(S(t,a)+T0V(t,a,τ)dτ+I(t,a)+R(t,a))da=R+μ(t,a)I(t,a)da+Sb(t).

    The present model realistically allows infection to be propagated across different ages. Therefore, we can only have an index Ro(t) averaged over all ages. Indeed, defining

    Ro(t)=R+R+(ρ(t,α,a)S(t,α)+T0ρV(t,a,τ,α)V(t,α,τ)dτ)dαI(t,a)daR+(ϑ(t,a)+μ(t,a))I(t,a)da

    we have the following extension of (6):

    ddtR+I(t,a)da0Ro(t)1. (14)

    Remark that also model (11) can easily be extended to the case of different vaccines having different full efficacy times through the introduction of different vaccinated populations V1,,VM, now with V=V(t,a,τ), for =1,,m. The corresponding extensions of the above {formul\ae} for the variation of the total population and for the definition of Ro(t) are straightforward.

    The use of model (11)–(12)–(13) allows to tackle the key issue of optimizing the use of the available vaccines on the basis of their different efficacy on different age classes.

    The description provided by (1) is often too approximate. For instance, it might be necessary to distinguish between exposed (E) and infective (I) individuals, extending (1) to

    SEIR{˙S=ρIS˙E=ρIS(ϑE+μE+κ)E˙I=κE(ϑI+μI)I˙R=ϑEE+ϑII, (15)

    where we introduced the term κE representing the speed at which exposed individuals become infective. Refer for instance to [12,13,18] for various results about developments of SEIR models.

    Assume now that individuals infected at time t typically become infective at a later time. It is then natural, see also [15,16], to introduce the number I(t,τ) of individuals at time t that were infected at time tτ, so that (1) becomes

    SI(0)I(τ)R{˙S=R+ρ(τ)I(t,τ)dτStI+τI=ϑ(τ)Iμ(τ)I˙R=ϑ(τ)I(t,τ)dτI(t,0)=R+ρ(τ)I(t,τ)dτS(t). (16)

    Observe that the last line above is in fact a boundary condition, prescribing how many individuals get infected at time t.

    Remark that the dependence of ρ, ϑ and μ on τ allows to account for different infectivity, recovery and mortality rate at different stages of the infection. For instance, if an individual infected at time t becomes infective at time t+ti, then we set ρ(τ)=0 for τ[0,ti].

    Observe that, as is to be expected, the variation in the total number of individuals resulting from (16) is due exclusively to mortality. Indeed

    ddt(S(t)+R+I(t,τ)dτ+R(t))=R+μ(τ)I(t,τ)dτ. (17)

    Within the framework of (16), an explicit expression for the basic reproduction number Ro(t) at time t is available:

    Ro(t)=R+ρ(τ)I(t,τ)dτS(t)R+(ϑ(τ)+μ(τ))I(t,τ)dτ

    and it is immediate to see that its exceeding unity is equivalent to the increase of the total number of infected individuals:

    ddt(R+I(t,τ)dτ)0Ro(t)1. (18)

    It goes without saying that suitable choices of initial data and parameters in (16) allow to recover within (16) the solutions of (1). Here we only provide a quick example of a comparison among solutions to (1), (15) and (16), with data and parameters in (1) being an average of those in (15), while the choices in (16) are an interpolation of those in (15), as detailed in (19).

    (1)(15)(16)ρ=0.1ρ=0.1ρ(τ)=0.1(1e0.2τ)ϑ=3(ϑE,ϑI)=(7,1)ϑ(τ)={7τ<21τ2μ=0.5(μE,μI)=(0.1,0.9)μ(τ)=0.90.8e2τκ=5So=10So=10So=10Io=6.(Eo,Io)=(1,5)Io(τ)={0.5τ[0,2[2.5τ[2,4]Ro=0Ro=0Ro=0. (19)

    Figure 4 shows sample integrations of (1), (15) and (16). In the situation considered, according to mortality, the mixed ODE–PDE system (16) can be seen in some senses in the middle between the other two classical purely ODE based compartmental models (1) and (15). Intra-compartmental dynamics can thus recover the dynamics described through standard compartmental models.

    Figure 4. 

    Above, the integrations of (1) and (15), below on the left that of (16) (19). The rightmost diagram on the second line displays the total number of living individuals in the three cases, showing that, with respect to mortality, the ODE–PDE model (16) can be seen in some senses in the middle between the ODE models (1) and (15)

    .

    On the other hand, other scenarios can hardly be recovered through the use of only standard compartments. Indeed, for instance, it can be reasonable to assume that infected individuals are most infective in given time intervals after infection where, in general, these intervals depend on the specific disease under consideration. Such a situation, within Model (16), is easily described and we consider, for instance, the following choices:

    ρ(τ)=ˉρteα(tˉT)2 with ρ=0.1 and (i)α=1.0,ˉT=10.0,(ii)α=1.0,ˉT=4.0,(iii)α=0.25,ˉT=4.0. (20)

    The sample choices (20) differ in the time ˉT at which I individual are most infective and in the coefficient α ruling the width of the infective time interval.

    The results are summarized in Figure 5. The differences in the evolutions prescribed by (16) corresponding to the choices (20) are very intuitive, Case (ii) being the reference situation. In Case (i), infected individuals mostly either die or recover before being infective. In Case (iii), the wider distribution of ρ helps the spreading of the infection.

    Figure 5. 

    Above, from left to right, the integrations of Case (i), Case (ii) and Case (iii) in (20) with parameters and data as prescribed in (19). Below, the corresponding choices of the ρ function as detailed in (20). The differences in the displayed evolutions are due to the intra–compartmental dynamics in the I population

    .

    We now consider the SIDARTHE model introduced in [11]. It consists of 8 populations, which we briefly recall in Table 3, leaving the detailed explanation to [11].

    Table 3. 

    Populations in model (21) from [11]

    .
    S Susceptible healthy can be infected
    I Infected asymptomatic infective undetected
    D Diagnosed asymptomatic infective detected
    A Ailing symptomatic infective undetected
    R Recognized symptomatic infective detected
    T Threatened acutely symptomatic infected detected
    H Healed healthy immune
    E Extinct

     | Show Table
    DownLoad: CSV

    Its block diagram and the corresponding system of ordinary differential equations read:

    SIDHARET{˙S=αISγASβDSδRS˙I=αIS+γAS+βDS+δRS(ε+ζ+λ)I˙D=εI(η+ρ)D˙A=ζI(ϑ+μ+κ)A˙R=ηD+ϑA(ν+ξ)R˙T=μA+νR(σ+τ)T˙H=λI+ρD+κA+ξR+σT˙E=τT. (21)

    We refer to [11] for the specific meaning of each constant and for the motivations of this model.

    Here, we note that both the evolutions IA and DRT are due to the development and worsening of the symptoms. It is therefore natural to single out these parts, namely

    (22)

    Introduce now the populations I=I(t,s) and R=R(t,s). The former comprehends I and A, while the latter consists of D, R and T, as it stems comparing the scheme (22) above with (23) below. The evolution of the symptoms is then described through the dependence on the s variable, in completely independent ways in the two different compartments.

    SI(0)I(s)R(0)R(s)E H  (23)
    {˙S=α(s)I(t,s)dsSδ(s)R(t,s)dsStI+sI=α(s)I(t,s)dsS+δ(s)R(t,s)dsSε(s)I(t,s)dsϑ(s)I(t,s)dstR+sR=ϑ(s)I(t,s)sη(s)R(t,s)ds˙H=ε(s)Ids˙E=η(s)R(t,s)ds, (24)

    All integrals being computed over R+. Careful piecewise constant choices of the various functions α, δ, ε, ϑ and η allow to recover [11,Formulæ (1)–(8)]. However, system (24) is far more flexible, although it actually consists of only 3 differential equations, since H and E are easily found once S, I and R are available.

    Note also that in model (24) the explicit expression of the basic reproduction number is immediately at hand. Indeed, defining

    Ro(t)=(α(s)I(t,s)+δ(s)R(t,s))dsS(t)(ε(s)+ϑ(s))I(t,s)ds

    the key property (18) still holds.

    As a further example of intra-compartmental dynamics we consider movements. Indeed, as a prototype for the description of the role of quarantine in the spreading of a pandemic, consider the model [6,Formula (9)]

    SIRH{tS+μSS=ρIStI+μII=ρISκIϑItH+μHH=κIηHtR+μRR=ϑI+ηH, (25)

    where we used the standard notation for the S, I and R populations, while H stands for the individuals that are infected but are hospitalized, or in quarantine. Here, ρ describes, as usual, infectivity; κ the hospitalization rate; η, respectively ϑ, the recovery rate of hospitalized, respectively infected, individuals. The mortality terms μSS and μRR might as well be neglected on short time intervals.

    In this connection, it can be relevant to take into consideration events that provoked relevant gatherings of crowds, a well known example being the Atalanta vs. Valencia football match played in Milan (Italy) on February 19th, 2020, see [26]. To this aim, following [6], we introduce a geographical movement as follows

    S(x)I(x)R(x)H{tS+div(vSS)+μSS=ρIStI+div(vII)+μII=ρISκIϑItH+μHH=κIηHtR+div(vRR)+μRR=ϑI+ηH. (26)

    Above, all populations are also space dependent, so that, for instance, S=S(t,x), x being the geographical coordinate in R2. The various movements are described by the 2d vectors vS, vI and vR, while H individuals are not assumed to be moving. We defer to [6,Section 6] for further details and for a sample integration of (26), while its well posedness is proven in [7].

    Introducing age structure in the SIS model [15], see also [3,Formula 10.1], we get

    SI{tS+aS=ρIS+γItI+aI=ρISγI. (27)

    In this model, when infected individuals recover, they get back to being susceptible at a rate governed by the, possibly age dependent, parameter γ. However, it might be reasonable to assume that, after infection, immunization lasts for a, possibly age dependent, time interval. Therefore, we are lead to introduce an R population of individuals that recovered and are immune, but only for a predetermined age dependent time T=T(a):

    SIR(0)R(T){tS+aS=ρIS+R(t,a,T(a))tI+aI=ρISγItR+aR+τR=0R(t,a,0)=γI(t,a). (28)

    Note however that the very simple nature of the third equation allows to rewrite (28) as a system of 2 PDEs with "delay" in both the t and a variables:

    {tS+aS=ρIS+γI(tT(a),aT(a))tI+aI=ρISγI(t,a). (29)

    The form (28) is more prone to extensions than (29), since it allows to specify various evolutions of the R population. Indeed, from the modeling point of view, systems (28) can easily be extended to comprise other factors, such as a τ–dependent rate of re-infection of the R individuals, for instance.

    From the analytic point of view, we remark that (28) provides a first minimal example of a "junction" in 2 space dimensions. Indeed, the line τ=T(a) splits the plane of the "space" variables (a,τ).


    [1] Mathematical modeling of immunity to malaria. Nonlinearity in biology and medicine. Math. Biosci. (1988) 90: 385-396.
    [2] A multiscale model of virus pandemic: Heterogeneous interactive entities in a globally connected world. Math. Models Methods Appl. Sci. (2020) 30: 1591-1651.
    [3]

    F. Brauer and C. Castillo-Chavez, Mathematical Models in Population Biology and Epidemiology, 2nd edition, Texts in Applied Mathematics, 40, Springer, New York, 2012.

    [4] Models for transmission of disease with immigration of infectives. Math. Biosci. (2001) 171: 143-154.
    [5] Well posedness and control in a nonlocal SIR model. Appl. Math. Optim. (2021) 84: 737-771.
    [6]

    R. M. Colombo, M. Garavello, F. Marcellini and E. Rossi, An age and space structured SIR model describing the Covid-19 pandemic, J. Math. Ind., 10 (2020), 20pp.

    [7]

    R. M. Colombo, M. Garavello, F. Marcellini and E. Rossi, IBVPs for inhomogeneous systems of balance laws in several space dimensions motivated by biology and epidemiology, preprint, 2021.

    [8]

    G. Dimarco, L. Pareschi, G. Toscani and M. Zanella, Wealth distribution under the spread of infectious diseases, Phys. Rev. E, 102 (2020), 14pp.

    [9] Bifurcation thresholds in an SIR model with information-dependent vaccination. Math. Model. Nat. Phenom. (2007) 2: 23-38.
    [10]

    S. Ghosh and S. Bhattacharya, A data-driven understanding of COVID-19 dynamics using sequential genetic algorithm based probabilistic cellular automata, Appl. Soft Comput., 96 (2020).

    [11] Modelling the COVID-19 epidemic and implementation of population-wide interventions in Italy. Nature Medicine (2020) 26: 855-860.
    [12]

    A. Godio, F. Pace and A. Vergnano, SEIR modeling of the Italian epidemic of SARS-CoV-2 using computational swarm intelligence, Internat. J. Environ. Res. Public Health, 17 (2020).

    [13] Some results for an SEIR epidemic model with density dependence in the death rate. IMA J. Math. Appl. Med. Biol. (1992) 9: 67-106.
    [14]

    H. Inaba, Age-structured SIR epidemic model, in Age-Structured Population Dynamics in Demography and Epidemiology, Springer, 2017,287–331.

    [15] Contributions to the mathematical theory of epidemics. II. The problem of endemicity. Proc. Roy. Soc. Lond. A (1932) 138: 55-83.
    [16] A contribution to the mathematical theory of epidemics. Proc. Roy. Soc. Lond. A (1927) 115: 700-721.
    [17] A simple vaccination model with multiple endemic states. Math. Biosci. (2000) 164: 183-201.
    [18] Global stability of a SEIR epidemic model with infectious force in latent, infected and immune period. Chaos Solitons Fractals (2005) 25: 1177-1184.
    [19] Global dynamics an SEIR epidemic model with vertical transmission. SIAM J. Appl. Math. (2001) 62: 58-69.
    [20] SVIR epidemic models with vaccination strategies. J. Theoret. Biol. (2008) 253: 1-11.
    [21] Dynamic models of infectious diseases as regulators of population sizes. J. Math. Biol. (1992) 30: 693-716.
    [22]

    J. D. Murray, Mathematical Biology. I. An Introduction, 3rd edition, Interdisciplinary Applied Mathematics, 17, Springer-Verlag, New York, 2002.

    [23]

    B. Perthame, Transport Equations in Biology, Frontiers in Mathematics, Birkhäuser Verlag, Basel, 2007.

    [24]

    C. Piazzola, L. Tamellini and R. Tempone, A note on tools for prediction under uncertainty and identifiability of SIR-like dynamical systems for epidemiology, Math. Biosci., 332 (2021), 21pp.

    [25] Epidemic and demographic interaction in the spread of potentially fatal diseases in growing populations. Math. Biosci. (1992) 111: 99-130.
    [26]

    H. Wackerhage, R. Everett, K. Krüger, M. Murgia and P. Simon, et al., Sport, exercise and COVID-19, the disease caused by the SARS-CoV-2 coronavirus, Dtsch. Z. Sportmed., 71 (2020), E1–E12.

    [27] Using a genetic algorithm to fit parameters of a COVID-19 SEIR model for US states. Math. Comput. Simulation (2021) 185: 687-695.
  • This article has been cited by:

    1. Rinaldo M. Colombo, Mauro Garavello, Infectious Disease Spreading Fought by Multiple Vaccines Having a Prescribed Time Effect, 2023, 71, 0001-5342, 10.1007/s10441-022-09452-4
    2. Lihong Sun, Qiang He, Yueyang Teng, Qi Zhao, Xin Yan, Xingwei Wang, A complex network-based vaccination strategy for infectious diseases, 2023, 136, 15684946, 110081, 10.1016/j.asoc.2023.110081
    3. R.M. Colombo, M. Garavello, M. Tandy, On the coupling of well posed differential models, 2023, 232, 0362546X, 113290, 10.1016/j.na.2023.113290
    4. Rinaldo M. Colombo, Mauro Garavello, Francesca Marcellini, Elena Rossi, 2024, Chapter 28, 978-3-031-55263-2, 325, 10.1007/978-3-031-55264-9_28
  • Reader Comments
  • © 2022 the Author(s), licensee AIMS Press. This is an open access article distributed under the terms of the Creative Commons Attribution License (http://creativecommons.org/licenses/by/4.0)
通讯作者: 陈斌, bchen63@163.com
  • 1. 

    沈阳化工大学材料科学与工程学院 沈阳 110142

  1. 本站搜索
  2. 百度学术搜索
  3. 万方数据库搜索
  4. CNKI搜索

Metrics

Article views(1196) PDF downloads(225) Cited by(4)

Figures and Tables

Figures(5)  /  Tables(3)

/

DownLoad:  Full-Size Img  PowerPoint
Return
Return

Catalog