Research article

Estimation of time-parameters of Barker binary phase coded radar signal using instantaneous power based methods

  • Received: 24 July 2020 Accepted: 08 November 2020 Published: 16 November 2020
  • This paper deals with analysis of the Barker binary phase radar signal as part of ways to counteract upcoming threats in the field of electronic warfare support (ES) system. The ES part of electronic warfare (EW) provides tactical support by providing key information to other sections responsible for providing response in the form of attack and protection. The analysis of this paper focused on the correct estimation of the basic time parameters (pulse width and pulse repetition period) of this radar signal using instantaneous power obtained from the time-marginal of the time-frequency distribution (TFD), the maxima (power) of the TFD and directly from the product of signal. The main TFD is a modified version of the most common quadratic TFD (QTFD), the Wigner-Ville distribution (WVD) using appropriately chosen separable kernels. This analysis and estimation method developed is tested in the presence of white noise of Gaussian probability density function at different signal-to-noise ratios (SNR). Results obtained show that instantaneous power gotten from the maxima of TFD outshines the other methods with a minimum SNR of?14 dB when the specific threshold of 37.5% is used. It also shows that the proposed methods chosen outperform previous works of similar objectives and therefore, making it suitable for practical EW systems.

    Citation: Ashraf A. Ahmad, Ameer Mohammed, Mohammed Ajiya, Zainab Yunusa, Habibu Rabiu. Estimation of time-parameters of Barker binary phase coded radar signal using instantaneous power based methods[J]. AIMS Electronics and Electrical Engineering, 2020, 4(4): 347-358. doi: 10.3934/ElectrEng.2020.4.347

    Related Papers:

    [1] Ch Priyanka, D Venkata Ratnam, Sai Krishna Santosh G . A Review on design of low noise amplifiers for global navigational satellite system. AIMS Electronics and Electrical Engineering, 2021, 5(3): 206-228. doi: 10.3934/electreng.2021012
    [2] Vani H Y, Anusuya M A . Improving speech recognition using bionic wavelet features. AIMS Electronics and Electrical Engineering, 2020, 4(2): 200-215. doi: 10.3934/ElectrEng.2020.2.200
    [3] Nazim F. Habbani, Sharief F. Babikir . Coherence of oscillations generated by single-electronic two-dimensional arrays of tunnel junctions. AIMS Electronics and Electrical Engineering, 2020, 4(2): 188-199. doi: 10.3934/ElectrEng.2020.2.188
    [4] Vasudevan Karuppiah, UmaMaheswari Gurusamy . Compact EBG structure for ground bounce noise suppression in high-speed digital systems. AIMS Electronics and Electrical Engineering, 2022, 6(2): 124-143. doi: 10.3934/electreng.2022008
    [5] Mulualem T. Yeshalem, Baseem Khan, Om Prakash Mahela . Conducted electromagnetic emissions of compact fluorescent lamps and electronic ballast modeling. AIMS Electronics and Electrical Engineering, 2022, 6(2): 178-187. doi: 10.3934/electreng.2022011
    [6] Akram Zardadi . Data selection with set-membership affine projection algorithm. AIMS Electronics and Electrical Engineering, 2019, 3(4): 359-369. doi: 10.3934/ElectrEng.2019.4.359
    [7] Tarun Naruka, Debasis Tripathy, Prangya Mohanty . Power quality enhancement by a solar photovoltaic-based distribution static compensator. AIMS Electronics and Electrical Engineering, 2025, 9(2): 192-214. doi: 10.3934/electreng.2025010
    [8] Nazim F. Habbani, Sharief F. Babikir . Study of single-electron tunneling oscillations using monte-carlo based modeling algorithms to a capacitive slanted two-dimensional array of tunnel junctions. AIMS Electronics and Electrical Engineering, 2021, 5(1): 55-67. doi: 10.3934/electreng.2021004
    [9] Manisha R. Bansode, Surendra S. Rathod . A bandwidth enhanced multilayer electromagnetic bandgap structure to reduce the simultaneous switching noise. AIMS Electronics and Electrical Engineering, 2023, 7(4): 406-420. doi: 10.3934/electreng.2023021
    [10] Tadele A. Abose, Fanuel O. Ayana, Thomas O. Olwal, Yihenew W. Marye . BER performance analysis of polar-coded FBMC/OQAM in the presence of AWGN and Nakagami-m fading channel. AIMS Electronics and Electrical Engineering, 2024, 8(3): 311-331. doi: 10.3934/electreng.2024014
  • This paper deals with analysis of the Barker binary phase radar signal as part of ways to counteract upcoming threats in the field of electronic warfare support (ES) system. The ES part of electronic warfare (EW) provides tactical support by providing key information to other sections responsible for providing response in the form of attack and protection. The analysis of this paper focused on the correct estimation of the basic time parameters (pulse width and pulse repetition period) of this radar signal using instantaneous power obtained from the time-marginal of the time-frequency distribution (TFD), the maxima (power) of the TFD and directly from the product of signal. The main TFD is a modified version of the most common quadratic TFD (QTFD), the Wigner-Ville distribution (WVD) using appropriately chosen separable kernels. This analysis and estimation method developed is tested in the presence of white noise of Gaussian probability density function at different signal-to-noise ratios (SNR). Results obtained show that instantaneous power gotten from the maxima of TFD outshines the other methods with a minimum SNR of?14 dB when the specific threshold of 37.5% is used. It also shows that the proposed methods chosen outperform previous works of similar objectives and therefore, making it suitable for practical EW systems.


    Electronic warfare support (ES) is one of three parts of the electronic warfare (EW) support system charged with responsibility of providing tactical information to the electronic attack (EA) and the electronic protection (EP) parts of EW. It also involves interpulse analysis, intrapulse analysis, direction finding, emitter location and transmitter power estimation among many other communication based objectives [1]. The sole purpose of the interpulse analysis is to determine time or pulse-to-pulse characteristics of a captured radar signal. The Barker phase coded radar signal is one of the key forms of intentional intrapulse modulation radar waveform used for pulse compression. The first step of intercepting this type of signal involves determining its external pulse characteristics as considered in this paper before determining its internal pulse modulation characteristics. This consideration is also because there is always the need for effective deduction of radar parameters by ES system so as to determine the radar capabilities and specific radar identities [1].

    The conventional use of the interpulse analysis output; the pulse width (PW) and pulse repetition period (PRP) is to determine range resolution and unambiguous range respectively [2], but can also be used to estimate angle of target [3]. Recently in this field of radar applications using time-frequency analysis, a method based on compressive sensing joint time-frequency (CSJTF) distribution was used and developed to differentiate backscattering data from several structures of interest, including a pipe, rotating turbine blades, and a moving human [4]. Results obtained showed that CSJTF provided better resolution. A comparison of the spectrogram and the scalogram for the characterization of low probability of intercept (LPI) frequency hopping signal of 4-components and 8-components type was presented [5]. Results obtained showed the superiority of scalogram by 11% in terms of direction estimation. The blind estimation of the instantaneous frequency hopping (FH) spectrum was considered without the knowledge of hopping patterns using the joint time-frequency domain [6]. Simulation results clearly showed that the proposed approach outperformed other similar approaches under the same conditions using a sampling frequency of 60 MHz at SNR of 10 dB. The Cross Wigner Hough transform - XWHT was considered for detection and parameter extraction of frequency modulated continuous waveforms (FMCW) signals [7]. Simulation results show the chirp rate estimation performance of 99% at ‒3dB and above. Also, a method for grouping LPI radar signals either based on phase or frequency modulation using time-frequency analysis was proposed [8]. Results obtained showed that the grouping depended on the internal modulation of the signals with grouping accuracy of 100% at minimum SNR of ‒1dB. A brief comprehensive review of the use of time-frequency analysis for radar applications can be found in [9].

    This paper in line with these researches focused on the investigation of instantaneous power (IP) from the peaks of the time-frequency distribution (TFD), i.e. its maxima (IPm), time-marginal of the TFD (IPtm) and also using its conjugate (IPd). The main TFD that was used in this work is a modified version of Wigner-Ville distribution (WVD) TFD [10,11]. Thereafter the estimation of the PW and PRP of the Barker binary phase coded radar signal was carried out and performance analysis of this estimation at different signal-to-noise ratio (SNR) and at different thresholds was determined. The rest of paper is as follows; section 2 presents the barker binary phase radar signal, section 3 present the methodology carried out in this paper for PW and PRP estimations while results obtained and their discussion are presented in section 4. The paper is then thereafter and finally concluded.

    The radar signal has two main pulse/time characteristics; PW, the time in which the radar system radiates each pulse and PRP or the interpulse period, the time between the beginning of one pulse and the start of the next pulse. The difference between the PW and PRP in time is the listening time (LT); i.e. the time taken to wait for the echo signal. The pulse repetition frequency (PRF) is the reciprocal of the PRP and can be defined as the number of pulses that are transmitted per second [12]. The CW is the building block foundation of LPI signals where the radar signal is modulated according to different signal parameters (frequency and phase) in order to achieve low detection capability. Hence it becomes clear that apart from increase cost in hardware and software of using LPI, the principal cost would be associated with digital processing throughput and therefore the aim of the research. The first block of classifying the radar signals can be divided into two based on the preceding discussion; LPI-based signal and the non-LPI based signal. The non-LPI based signal is conventionally referred to as the simple pulsed radar signal whereby the signal is modulated sinuosoidally with a single frequency with no advanced frequency or phase modulation internally (intrapulse) for pulse compression purpose [1].

    LPI is a term used to describe the idea behind reducing (or lowering) the emitter radar's electromagnetic emission detection by the intercept radar receiver. This goal of LPI can be achieved through various ways. However the scope of this research has been limited to key aspect of the LPI design whereby wideband CW radar waveform is used to achieve pulse compression. Therefore the intercept ES receiver must focus on counteracting the goal of the LPI radar design by coming up with better signal processing tools. The phase modulating LPI radar signals are gotten from phase shifting keying (PSK) techniques and generally classified into two; binary phase modulation and polyphase modulation. A complex modulated digital phase signal can be simply represented by (1).

    s(t)=Aej(2πfct+k) (1)

    where A is the amplitude of the signal, k is the phase modulation function that is shifted in time t and carrier information contain in the frequency, fc. The most common, famous and widely used form of the PSK is the Barker binary PSK (BPSK) code developed by R.H. Barker in 1953 for synchronization purposes in communication systems [13]. The BPSK codes have phase value of either zero or 1800 (k=0 or k=π). The barker sequence can has a finite length sequence of 2 values (+1/-1 or + /- or 0/1) with a code length of at least two such that is aperiodic autocorrelation of (2) must satisfy the conditions of (3) for non-zero shift and (4) for reversal transformation in order to make the 'codes perfect'.

    rk=nkj=1ajaj+k (2)
    |rk|1fork0 (3)
    rk=rk (4)

    where rk is the aperiodic autocorrelation and a is the code. The only known binary sequence for Barker codes for these aforementioned conditions are code length of 2, 3, 4, 5, 7, 11 and 13 and are given in Table 1 [14].

    Table 1.  All known barker codes for digital binary phase modulation.
    Code Length Code
    2 11, 10
    3 110
    4 1110, 1101
    5 11101
    7 1110010
    11 11100010010
    13 1111100110101

     | Show Table
    DownLoad: CSV

    It is observed from Table 1, that there are two possible codes for even numbered code length and one for odd numbered code. For a pictorial depiction of BPSK based on Table 1, the time and frequency representation of the Barker BPSK for code length of seven based on the sequence given in Table 1 is shown in Figure 1.

    Figure 1.  Time and frequency representation of 7-length Barker binary code signal.

    Careful examination of the Time Plot of Figure 1 shows that there are three phase changes and hence in accordance with the 7-length sequence of 1110010. Also the frequency representation obtained from the fast Fourier transform (FFT) of the signals shows a constant frequency modulation in the Frequency Plot. However, it is clear that each of plots is not sufficient to capture the characteristics of the signal and hence, the need for a joint time-frequency representation.

    Time-frequency analysis is a progression of mathematical ideas (the TFD) used in the analysis of time-varying spectra of signals in order to cater for various problems in numerous fields. The TFDs can be classified based on linearity or being adaptive. For example, the bionic wavelet transform is a linear adaptive TFD of wavelet transform and active biological auditory system origin and was recently used for improved speech recognition [15]. However, the modified WVD (mWVD) considered in this paper is a non-adaptive quadratic TFD (QTFD) with origin from the most common QTFD, the WVD [16].The WVD is mathematically given in (5).

    Wz(t,f)=z(t+τ2)z(tτ2)ej2πfτdτ (5)

    where z(t) is the analytical or the complex form associate of the signal s(t), and denotes the complex conjugate of the signal of interest. When the WVD is modified in order to cater for its various shortcoming using two separable kernels for time smoothing and filtering, (6) is obtained;

    pz(t,f)=g1(t)tWz(t,f)fG2(f) (6)

    The time smooth kernel (g1(t)) allows for smoothing of WVD along the time domain while the filter kernel G2(f) allows for smoothing of WVD along the frequency domain and hence the t and f under the respectively shown in (6). Specifically, (6) translates into the (7) when implementation is done in the time-lag domain (t,τ) which was used in this paper.

    pz,m(t,f)=g2(τ)g1(t)z(t+τ2)z(tτ2)ej2πfτdτ (7)

    Since the focus of this paper is currently on time parameter estimation, the hamming window (an extension of Von Hann window) of minimum side lobe advantage was used for the time-lag kernel. The better ripple factor controlling window, the Kaiser window was used for the time-smoothing kernel [17]. As such the mWVD based on the mathematical expressions of these windows is given in (8);

    pz,m(t,f)=0.540.46cos(2πτT)I0{β1(tuT)2}I0{β}z(u+τ2)z(uτ2)ej2πfτdudτ (8)

    where an acceptable default value of β=12 is used and I0{.} is the modified zero-order Bessel function in the form of power series, u is the convolution control parameter, the double integral represents the convolution and Fourier transforms operations and T is the window length. The convolution operation comes first as intergral with respect to convolution control parameter is given in (8) before that of the Fourier tansform. Moreover, Fourier transform is always the last operation of a TFD as evident in the conventional WVD presented in (5). Furthermore, the interpulse analysis is then carried out by obtaining instantaneous power (IP, Pi(t)) through three steps. Firstly directly by the product of the signal and its conjugate version; secondly through conversion of the 3D TFD (power, time and frequency) of the mWVD to 2D parameters of time and power through tracing the local maximum of the TFD maxima (IPm) and thirdly through the integral of TFD with respect to frequency or the TFD time marginal (IPtm) [10]. These steps are mathematically given by (9)–(11);

    IPd=Pi,d(t)=|z(t)|2=z(t)z(t) (9)
    IPm=Pi,m(t)=max(pz,m(t,f)) (10)
    IPtm=Pi,tm(t)=pz,m(t,f)df (11)

    where z(t) is the conjugate of z(t). Finally, smoother versions of these IPs are also gotten to smoothen out the rough edges due to noise and phase changing modulation interactions making the total path of getting IPs to be six. Suffices of '-s' and '-ns' are used to differentiate between the smooth and non-smooth versions of the IPs respectively. An algorithm is strategically constructed to measure the all PWs and PRPs of the signal based on a chosen threshold by determining the duration of the signal for which its amplitude is higher or lower than the chosen threshold respectively. The structure of this algorithm was based on inserting a supporting algorithm into the main algorithm. The flow chart for the supporting algorithm is given in Figure 2

    Figure 2.  Flow chart of the supporting algorithm.

    The supporting algorithm as shown in Figure 2 sequentially enumerates the number of samples which are higher (the PW) and then lower (the PRP) signals than the specified threshold within the specific time duration chosen from the main algorithm. The threshold is a percentage value of the maximum value of the signal, where, signal in the case is the obtained IP. On the other hand, the main algorithm controls specific time for a single set of time parameter estimation. It also associates the estimation with the pulse position and end the algorithm when the whole signal is checked. The flow chart for the main algorithm is given in Figure 3.

    Figure 3.  Flow chart of the main algorithm.

    The main algorithm as seen from Figure 3 estimates the delay samples at the beginning of each signal and outputs the result of the PW and PRP based on the specified required number of pulses desired. The delay is simply a PRP with no value of PW, present at the beginning of an intercepted signal. Also, the signal in Figure 3 makes reference to the IP in consideration.

    The test simulation setup was designed to estimate PWs and PRPs at specific range SNR over the full duration of the signal for specific number times. Average number of PWs and PRPs measurement is noted for this duration and presented in the form of probability of correct estimation (PCE) in percentage to indicate ratio of correct estimations to total number of estimations. The noise models the random nature of the various type of noise associated with the practical radar scenario through the use of white noise of Gaussian probability density function [18,19]. The test barker BPSK radar signal contains four standard pulse sets with a PW value of 3 μs to cater for the binary phase changes adequately and PRP of 100 μs of medium range PRF. It also has a phase change of seven length barker codes of equal time-slice, sampling frequency of 40 MHz due to current radar technology and center frequency of 10MHz to adequately avoid aliasing [14]. The Three thresholds are considered for the performance analysis; 25% conventionally for LPI signals, 50% conventionally for non-LPI signals and threshold in between this two at 37.5% [1,14]. The result obtained for the BPSK radar signal using barker at various thresholds for the PW estimations is given in Figure 4.

    Figure 4.  PW estimation performance results for Barker BPSK radar signal at threshold of (a) 25% (b) 37.5% (c) 50%.

    There are some deductions that can be made from the results of Figure 4 based on the various chosen thresholds. Firstly, the random nature of the AWGN is responsible for the zigzag nature noticed in the estimation performance result gotten from Figure 4 (a)-(c) (and also in Figure 5). This deduction is similar to other works highly related in nature to this work [20,21]. The smoothed version of IPd remains the most versatile method while its non-smooth version performs poorest probably due to the fact of the phase changing. Infact, the IPd-s is the only method that achieves 100% estimation accuracy at threhsold of 50%, Figure 4c. The approximate IPs recorded from the mWVD makes correct estimation at mostly better SNR than the most versatile IPd –S at a threshold of 37.5% from Figure 4b. It is also noticed that the smooth versions of the IP provide better estimations than the non-smooth versions thereby justify the use of smoothing filter. Conclusively, for a fixed threshold of 37.5% as seen from Figure 4b, the IPm-S seems to be the best method to choose due to 100% PCE at SNR of ‒14dB while the IPd-S will be the best choice if a multi-threshold based method is required. The result for the PRP estimations for this same signal is presented in Figure 5.

    Figure 5.  PRP estimation performance results for Barker BPSK radar signal at threshold of (a) 25% (b) 37.5% (c) 50%.

    A slightly better result is obtained in Figure 5 as compared to that of the PW estimations of Figure 4 due to presence of higher samples in PRP. Also IPd-NS performs worst as no 100% PCE is achieved at any set threshold as observed in Figure 5a, 5b and 5c. This can be associated with the fact that poor PW estimations would necessarily translates into poor PRP estimations due to the nature of the method used. Similarly, it is also seen that the smooth versions perform better than the non-smooth versions for the reasons earlier mentioned. Best choice of IP goes out to IPm-S at any threshold selected with a 100% constant PCE at SNR of ‒14dB irrespective of the threshold selected (Figure 5a, 5b and 5c). This is followed by time marginal IP (IPtm-S) with minimum SNR of ‒13dB (Figure 5b and 5c) and then the IPd-S coming last with minimum SNR of ‒11dB (Figure 5b). In summary, for the Barker BPSK radar signal, the best choice of IP method seems to be IPm-S with 100% PCE having the lowest minimum SNR of ‒14dB.

    In order to further justify the superiority of the proposed method developed, a comparison is done with some previous works given in Table 2.

    Table 2.  Comparison of various time parameter estimation methods.
    Method Minimum SNR
    TFD approximate instantaneous power (This paper) ‒5dB
    Filters and Fast Fourier transform [22] 4dB
    Smoothed Instantaneous Energy [21] 5dB
    Short time Fourier transform [20] 9dB
    Auto-Convolution/Peak Estimates [23] 20dB

     | Show Table
    DownLoad: CSV

    The use of Fourier transform together with filters provided a unique and simple method of time parameter estimation. The smoothed instanteneous energy method examined the effect of various smoothing windows for estimation of time parameters of few radar signals while short time Fourier transform presented this estimation using a linear TFD. The method based on auto-convolution and peak estimates was proposed over a decade ago and was included in the comparison analysis for the sake of completion. However, it is clear from Table 2 that the proposed methods of this paper outperformed previous related methods as they are able to estimate time parameters at higher noise power at negative SNR values compared to the previous methods of other papers. Therefore, further analysis can be carried out involving frequency and phase parameters using the main tool, the mWVD to determine the complete identity of the radar signal.

    This paper presented an overview of the mWVD development in order to obtain basic time parameters of a radar signal. This obtainment is precisely from the further analysis of the mWVD through various forms of instantaneous powers (IPs). It was found from the results obtained that the smooth versions always perform better than the non-smooth versions. It was also found that the most versatile method when any threshold is selected is smooth version of the IP gotten directly while the best choice of IP goes to the smooth version of the approximate IP obtained from the peak of the TFD. Finally, it was also observed that the proposed methods outperform previous methods with similar objectives of time parameter estimation with minimum SNR difference of 9 dB.

    All authors declare no conflicts of interest in this paper.


    [1] Wiley RG (2006) ELINT: The Interception and Analysis of Radar Signals. Massachusetts: Artech House.
    [2] Skolnik M (2008) Radar handbook. Chicago: McGrawHill Companies.
    [3] Weihong L, Yongshun Z, Guo Z, et al. (2009) A method for angle estimation using pulse width of target echo. 2009 International Conference on Wireless Communications & Signal Processing, 1-5.
    [4] Whitelonis N, Ling H (2014) Radar Signature Analysis using a Joint Time-Frequency Distribution based on Compressed Sensing. IEEE T Antenn Propag 62: 755-763.
    [5] Stevens DL, Schuckers SA (2016) Low probability of Intercept Frequency Hopping Signal Characterization Comparison using the Spectrogram and the Scalogram. Global Journal of Research In Engineering 16: 13-23.
    [6] Liu S, Zhang YD, Shan T, et al. (2016) Structure-Aware Bayesian Compressive Sensing for Frequency-Hopping Spectrum Estimation. Compressive Sensing V: From Diverse Modalities to Big Data Analytics 9857: 98570N. International Society for Optics and Photonics.
    [7] Erdogan AY, Gulum TO, Durak-Ata Lt, et al. (2017) FMCW Signal Detection and Parameter Extraction by Cross Wigner-Hough Transform. IEEE T Aero Elec Sys 53: 334-344.
    [8] Ahmad AA, Lawan AM, Ajiya M, et al. (2019) Sorting of Low Probability of Intercept Radar Signals Based on Frequency Modulation Constancy Using Wigner-Ville Distribution. 2019 IEEE Asia-Pacific Conference on Applied Electromagnetics (APACE), 1-5.
    [9] Ahmad AA, Abubakar SA, Muhammad AL (2015) Recent Developments in the Use of Time-Frequency Analysis for Radar-Based Applications. AFRICON 2015, 1-5.
    [10] Boashash B (2016) Time-Frequency Signal Analysis and Processing: A Comprehensive Reference. London: Academic Press.
    [11] Ahmad AA, Lawan S, Ajiya M, et al. (2020) Extraction of the pulse width and pulse repetition period of linear FM radar signal using time-frequency analysis. Journal of Advances in Science and Engineering 3: 1-8.
    [12] Skolnik M (2001) Introduction to Radar Systems. Singapore: McGraw Hill.
    [13] Barker RH (1953) Communication theory: Group Sysnchronizing of Binary Digital Systems. London: Butterworth.
    [14] Levanon N, Mozeson E (2004) Radar Signals. New Jersey: John Wiley & Sons.
    [15] Vani H, Anusuya M (2020) Improving speech recognition using bionic wavelet features. AIMS Electronics and Electrical Engineering 4: 200-215.
    [16] Chen VC, Ling H (2002) Time-frequency Transforms for Radar Imaging and Signal Analysis. Massachusetts: Artech House.
    [17] Shenoi BA (2005) Introduction to Digital Signal Processing and Filter Design. New Jersey: John Wiley & Sons.
    [18] Ziemer RE, Peterson RL (2001) Introduction to Digital Communication. New Jersey: Prentice Hall.
    [19] Zhang Q (2019) Performance enhanced Kalman filter design for non-Gaussian stochastic systems with data-based minimum entropy optimisation. AIMS Electronics and Electrical Engineering 3: 382-396.
    [20] Ahmad AA, Daniyan A, Gabriel DO (2015) Selection of Window for Inter-pulse Analysis of Simple Pulsed Radar Signal using the Short Time Fourier Transform. International Journal of Engineering & Technology 4: 531-537.
    [21] Adam A, Adegboye B, Ademoh I (2016) Inter-Pulse Analysis of Airborne Radar Signals using Smoothed Instantaneous Energy. International Journal of Signal Processing Systems (IJSPS) 4: 139-143.
    [22] Pei W, Bin T (2013) Detection and Estimation of Non-Cooperative Uniform Pulse Position Modulated Radar Signals at Low SNR. 2013 International Conference on Communications, Circuits and Systems (ICCCAS) 2: 214-217.
    [23] Lee B, Inkol R, Chan F (2006) Estimation of Pulse Parameters by Convolution. 2006 Canadian Conference on Electrical and Computer Engineering, 17-20.
  • This article has been cited by:

    1. Ashraf A. Ahmad, Abel E. Airoboman, Ayodeji Olalekan Salau, Mohammed Ajiya Zainab Yunusa, 2021, Estimation of Time Parameters of Simple Pulsed Radar Signals Using Instantaneous Power Approximation Methods, 978-1-6654-1984-0, 1, 10.1109/AFRICON51333.2021.9570888
    2. Ashraf Adam Ahmad, Mustapha Malah Aji, Samuel Farayola Kolawole, Isah Musa Danjuma, 2024, Frequency Estimations of Normal and Frequency Hopping Radar Signals using Wigner-Ville Distributions, 979-8-3315-4255-9, 1, 10.1109/NIGERCON62786.2024.10927267
  • Reader Comments
  • © 2020 the Author(s), licensee AIMS Press. This is an open access article distributed under the terms of the Creative Commons Attribution License (http://creativecommons.org/licenses/by/4.0)
通讯作者: 陈斌, bchen63@163.com
  • 1. 

    沈阳化工大学材料科学与工程学院 沈阳 110142

  1. 本站搜索
  2. 百度学术搜索
  3. 万方数据库搜索
  4. CNKI搜索

Metrics

Article views(4027) PDF downloads(189) Cited by(2)

Figures and Tables

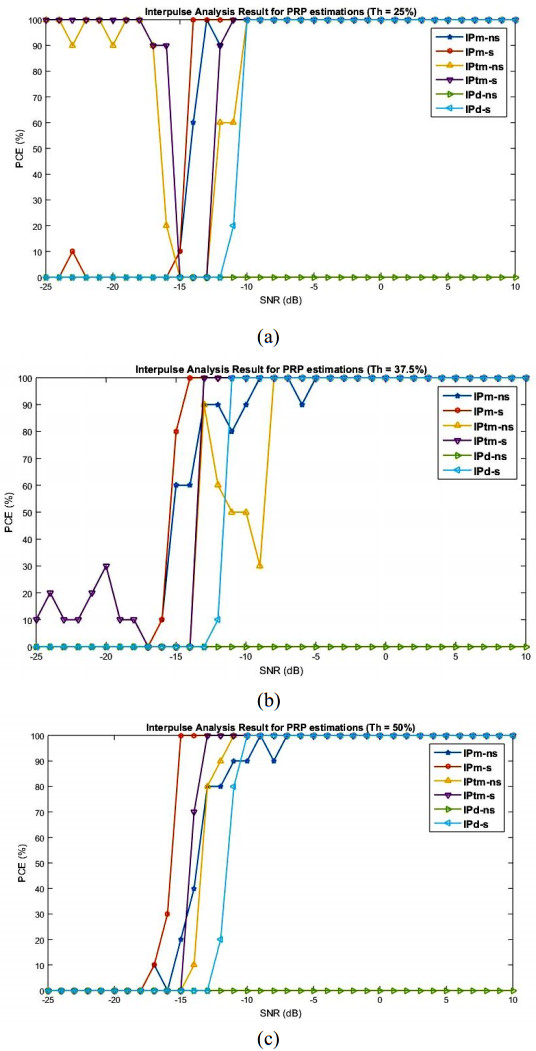
Figures(5)  /  Tables(2)

/

DownLoad:  Full-Size Img  PowerPoint
Return
Return

Catalog