Diabetes is a category of metabolic disease commonly known as a chronic illness. It causes the body to generate less insulin and raises blood sugar levels, leading to various issues and disrupting the functioning of organs, including the retinal, kidney and nerves. To prevent this, people with chronic illnesses require lifetime access to treatment. As a result, early diabetes detection is essential and might save many lives. Diagnosis of people at high risk of developing diabetes is utilized for preventing the disease in various aspects. This article presents a chronic illness prediction prototype based on a person's risk feature data to provide an early prediction for diabetes with Fuzzy Entropy random vectors that regulate the development of each tree in the Random Forest. The proposed prototype consists of data imputation, data sampling, feature selection, and various techniques to predict the disease, such as Fuzzy Entropy, Synthetic Minority Oversampling Technique (SMOTE), Convolutional Neural Network (CNN) with Stochastic Gradient Descent with Momentum (SGDM), Support Vector Machines (SVM), Classification and Regression Tree (CART), K-Nearest Neighbor (KNN), and Naïve Bayes (NB). This study uses the existing Pima Indian Diabetes (PID) dataset for diabetic disease prediction. The predictions' true/false positive/negative rate is investigated using the confusion matrix and the receiver operating characteristic area under the curve (ROCAUC). Findings on a PID dataset are compared with machine learning algorithms revealing that the proposed Random Forest Fuzzy Entropy (RFFE) is a valuable approach for diabetes prediction, with an accuracy of 98 percent.
Citation: A. Usha Ruby, J George Chellin Chandran, TJ Swasthika Jain, BN Chaithanya, Renuka Patil. RFFE – Random Forest Fuzzy Entropy for the classification of Diabetes Mellitus[J]. AIMS Public Health, 2023, 10(2): 422-442. doi: 10.3934/publichealth.2023030
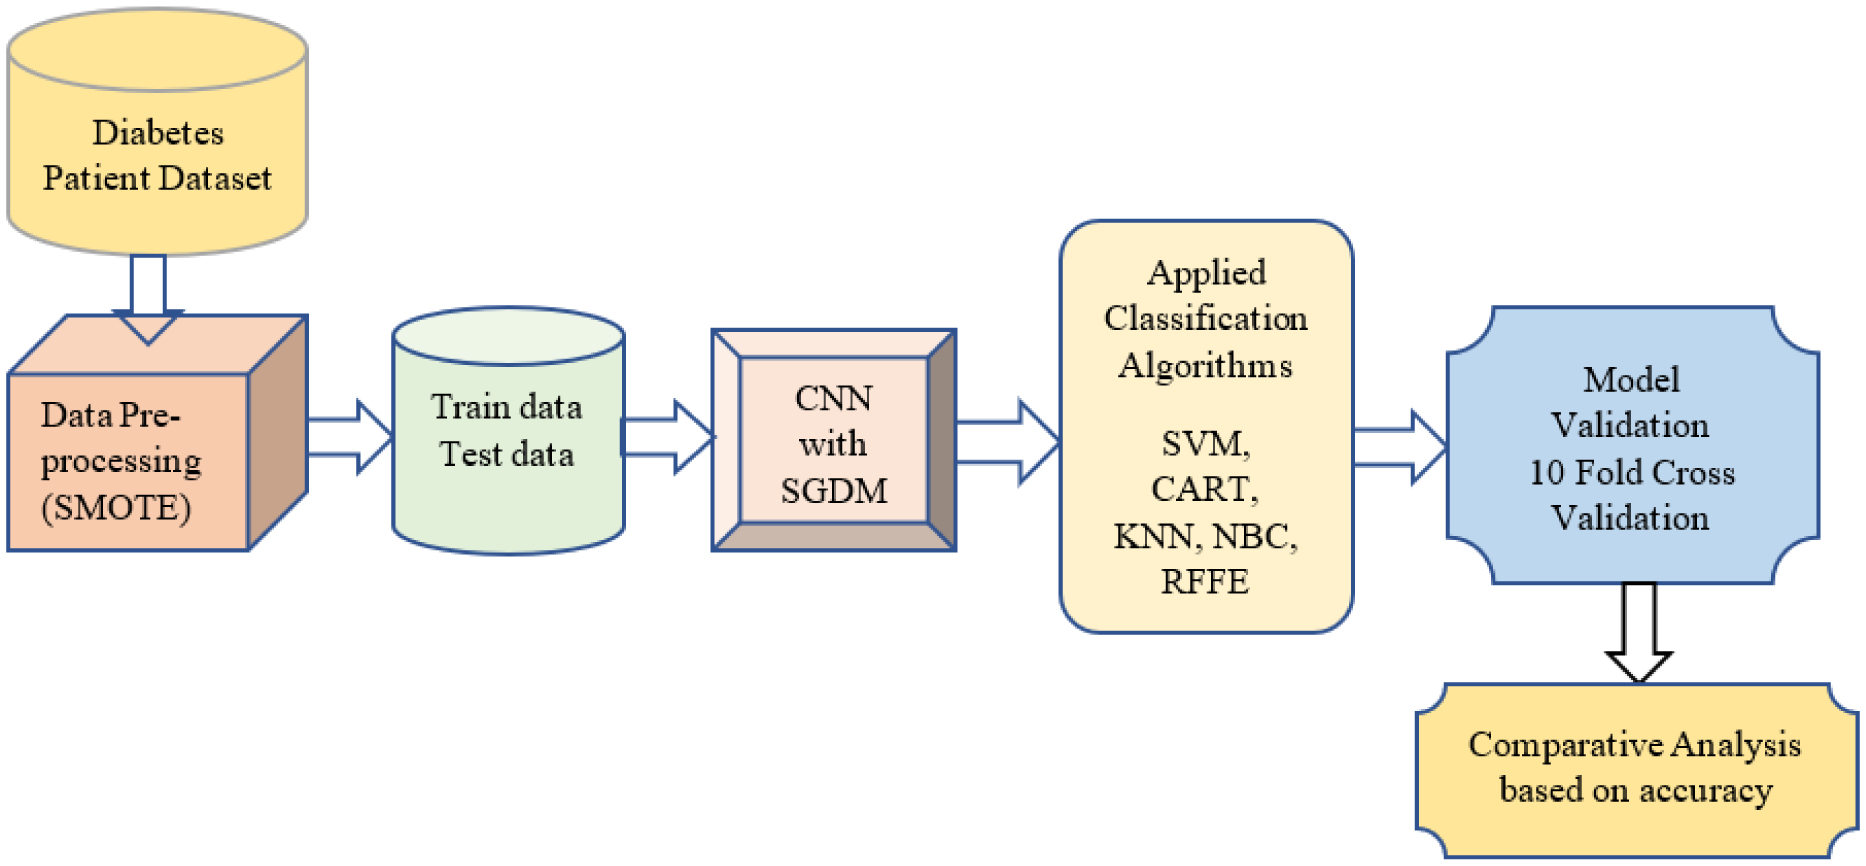
Diabetes is a category of metabolic disease commonly known as a chronic illness. It causes the body to generate less insulin and raises blood sugar levels, leading to various issues and disrupting the functioning of organs, including the retinal, kidney and nerves. To prevent this, people with chronic illnesses require lifetime access to treatment. As a result, early diabetes detection is essential and might save many lives. Diagnosis of people at high risk of developing diabetes is utilized for preventing the disease in various aspects. This article presents a chronic illness prediction prototype based on a person's risk feature data to provide an early prediction for diabetes with Fuzzy Entropy random vectors that regulate the development of each tree in the Random Forest. The proposed prototype consists of data imputation, data sampling, feature selection, and various techniques to predict the disease, such as Fuzzy Entropy, Synthetic Minority Oversampling Technique (SMOTE), Convolutional Neural Network (CNN) with Stochastic Gradient Descent with Momentum (SGDM), Support Vector Machines (SVM), Classification and Regression Tree (CART), K-Nearest Neighbor (KNN), and Naïve Bayes (NB). This study uses the existing Pima Indian Diabetes (PID) dataset for diabetic disease prediction. The predictions' true/false positive/negative rate is investigated using the confusion matrix and the receiver operating characteristic area under the curve (ROCAUC). Findings on a PID dataset are compared with machine learning algorithms revealing that the proposed Random Forest Fuzzy Entropy (RFFE) is a valuable approach for diabetes prediction, with an accuracy of 98 percent.

| [1] |
Ambady R, Chamukuttan S (2008) Early diagnosis and prevention of diabetes in developing countries. Rev Endocr Metab Disord 9: 193-201. https://doi.org/10.1007/s11154-008-9079-z 
|
| [2] |
Khuwaja AK, Khowaja LA, Cosgrove P (2010) The economic costs of diabetes in developing countries: some concerns and recommendations. Diabetologia 53: 389-390. https://doi.org/10.1007/s00125-009-1581-7
|
| [3] | Kumari S, Kumar D, Mittal M (2021) An ensemble approach for classification and prediction of diabetes mellitus using soft voting classifier. Int J Cogn Comput Eng 2: 40-46. https://doi.org/10.1016/j.ijcce.2021.01.001 |
| [4] |
Sisodia D, Sisodia DS (2018) Prediction of diabetes using classification algorithms. Procedia Comput Sci 132: 1578-1585. https://doi.org/10.1016/j.procs.2018.05.122
|
| [5] | Reddy SS, Sethi N, Rajender R A review of data mining schemes for prediction of diabetes mellitus and correlated ailments (2019) 1-5. https://doi.org/10.1109/ICCUBEA47591.2019.9128880 |
| [6] |
Zhu T, Li K, Herrero P, et al. (2020) Deep learning for diabetes: a systematic review. IEEE J Biomed Health Inform 25: 2744-2757. https://doi.org/10.1109/JBHI.2020.3040225
|
| [7] |
Wang Q, Cao W, Guo J, et al. (2019) DMP_MI: an effective diabetes mellitus classification algorithm on imbalanced data with missing values. IEEE Access 7: 102232-102238. https://doi.org/10.1109/ACCESS.2019.2929866
|
| [8] |
Barakat N, Bradley AP, Barakat MNH (2010) Intelligible support vector machines for diagnosis of diabetes mellitus. IEEE Trans Inf Technol Biomed 14: 1114-1120. https://doi.org/10.1109/TITB.2009.2039485
|
| [9] |
Wang Y, Li PF, Tian Y, et al. (2016) A shared decision-making system for diabetes medication choice utilizing electronic health record data. IEEE J Biomed Health Inform 21: 1280-1287. https://doi.org/10.1109/JBHI.2016.2614991
|
| [10] |
Wen D, Li P, Zhou Y, et al. (2020) Feature classification method of resting-state EEG signals from amnestic mild cognitive impairment with type 2 diabetes mellitus based on multi-view convolutional neural network. IEEE Trans Neural Syst Rehabil Eng 28: 1702-1709. https://doi.org/10.1109/TNSRE.2020.3004462
|
| [11] |
Tripoliti EE, Fotiadis DI, Manis G (2011) Automated diagnosis of diseases based on classification: dynamic determination of the number of trees in random forests algorithm. IEEE Trans Inf Technol Biomed 16: 615-622. https://doi.org/10.1109/TITB.2011.2175938
|
| [12] | Ruby AU, Chaithanya BN, TJ SJ, et al. (2022) An effective feature descriptor method to classify plant leaf diseases using eXtreme Gradient Boost. J Integr Sci Technol 10: 43-52. |
| [13] |
Ouyang C, Gan Z, Zhen J, et al. (2021) Inter-patient classification with encoded peripheral pulse series and multi-task fusion cnn: application in type 2 diabetes. IEEE J Biomed Health Inform 25: 3130-3140. https://doi.org/10.1109/JBHI.2021.3061114
|
| [14] |
Recenti M, Ricciardi C, Edmunds KJ, et al. (2020) Healthy aging within an image: Using muscle radiodensitometry and lifestyle factors to predict diabetes and hypertension. IEEE J Biomed Health Inform 25: 2103-2112. https://doi.org/10.1109/JBHI.2020.3044158
|
| [15] |
Longato E, Fadini GP, Sparacino G, et al. (2021) A deep learning approach to predict diabetes' cardiovascular complications from administrative claims. IEEE J Biomed Health Inform 25: 3608-3617. https://doi.org/10.1109/JBHI.2021.3065756
|
| [16] |
Lekha S, Suchetha M (2017) Real-time non-invasive detection and classification of diabetes using modified convolution neural network. IEEE J Biomed Health Inform 22: 1630-1636. https://doi.org/10.1109/JBHI.2017.2757510
|
| [17] |
Cheng SC, Huang YM (2003) A novel approach to diagnose diabetes based on the fractal characteristics of retinal images. IEEE Trans Inf Technol Biomed 7: 163-170. https://doi.org/10.1109/TITB.2003.813792
|
| [18] |
Syed AH, Khan T (2020) Machine learning-based application for predicting risk of type 2 diabetes mellitus (T2DM) in Saudi arabia: a retrospective cross-sectional study. IEEE Access 8: 199539-199561. https://doi.org/10.1109/ACCESS.2020.3035026
|
| [19] | Atwany MZ, Sahyoun AH, Yaqub M (2022) Deep learning techniques for diabetic retinopathy classification: A survey. IEEE Access . https://doi.org/10.1109/ACCESS.2022.3157632 |
| [20] |
Kölle K, Biester T, Christiansen S, et al. (2019) Pattern recognition reveals characteristic postprandial glucose changes: Non-individualized meal detection in diabetes mellitus type 1. IEEE J Biomed Health Inform 24: 594-602. https://doi.org/10.1109/JBHI.2019.2908897
|
| [21] |
Zarkogianni K, Litsa E, Mitsis K, et al. (2015) A review of emerging technologies for the management of diabetes mellitus. IEEE Trans Biomed Eng 62: 2735-2749. https://doi.org/10.1109/TBME.2015.2470521
|
| [22] |
Gayathri S, Krishna AK, Gopi VP, et al. (2020) Automated binary and multiclass classification of diabetic retinopathy using haralick and multiresolution features. IEEE Access 8: 57497-57504. https://doi.org/10.1109/ACCESS.2020.2979753
|
| [23] |
Islam MT, Al-Absi HRH, Ruagh EA, et al. (2021) DiaNet: A deep learning based architecture to diagnose diabetes using retinal images only. IEEE Access 9: 15686-15695. https://doi.org/10.1109/ACCESS.2021.3052477
|
| [24] | Yin H, Mukadam B, Dai X, et al. (2019) DiabDeep: Pervasive diabetes diagnosis based on wearable medical sensors and efficient neural networks. IEEE T Emerg Top Com 9: 1139-1150. https://doi.org/10.1109/TETC.2019.2958946 |
| [25] |
Theis J, Galanter WL, Boyd AD, et al. (2021) Improving the in-hospital mortality prediction of diabetes ICU patients using a process mining/deep learning architecture. IEEE J Biomed Health Inform 26: 388-399. https://doi.org/10.1109/JBHI.2021.3092969
|
| [26] |
Hasan MK, Alam MA, Das D, et al. (2020) Diabetes prediction using ensembling of different machine learning classifiers. IEEE Access 8: 76516-76531. https://doi.org/10.1109/ACCESS.2020.2989857
|
| [27] |
Shynu PG, Menon VG, Kumar RL, et al. (2021) Blockchain-based secure healthcare application for diabetic-cardio disease prediction in fog computing. IEEE Access 9: 45706-45720. https://doi.org/10.1109/ACCESS.2021.3065440
|
| [28] |
Philip NY, Razaak M, Chang J, et al. (2022) A data analytics suite for exploratory predictive, and visual analysis of type 2 diabetes. IEEE Access 10: 13460-13471. https://doi.org/10.1109/ACCESS.2022.3146884
|
| [29] |
Zhang B, Kumar BVKV, Zhang D (2013) Detecting diabetes mellitus and nonproliferative diabetic retinopathy using tongue color, texture, and geometry features. IEEE Trans Biomed Eng 61: 491-501. https://doi.org/10.1109/TBME.2013.2282625
|
| [30] | Lee BJ, Ku B, Nam J, et al. (2013) Prediction of fasting plasma glucose status using anthropometric measures for diagnosing type 2 diabetes. IEEE J Biomed Health Inform 18: 555-561. https://doi.org/10.1109/JBHI.2013.2264509 |
| [31] |
Khan FA, Zeb K, Al-Rakhami M, et al. (2021) Detection and prediction of diabetes using data mining: a comprehensive review. IEEE Access 9: 43711-43735. https://doi.org/10.1109/ACCESS.2021.3059343
|
| [32] |
Nuankaew P, Chaising S, Temdee P (2021) Average weighted objective distance-based method for type 2 diabetes prediction. IEEE Access 9: 137015-137028. https://doi.org/10.1109/ACCESS.2021.3117269
|
| [33] |
Bilal A, Sun G, Li Y, et al. (2021) Diabetic retinopathy detection and classification using mixed models for a disease grading database. IEEE Access 9: 23544-23553. https://doi.org/10.1109/ACCESS.2021.3056186
|
| [34] |
Güemes A, Cappon G, Hernandez B, et al. (2019) Predicting quality of overnight glycaemic control in type 1 diabetes using binary classifiers. IEEE J Biomed Health Inform 24: 1439-1446. https://doi.org/10.1109/JBHI.2019.2938305
|
| [35] |
Zhang B, Zhang D (2013) Noninvasive diabetes mellitus detection using facial block color with a sparse representation classifier. IEEE Trans Biomed Eng 61: 1027-1033. https://doi.org/10.1109/TBME.2013.2292936
|
| [36] | Le TM, Vo TM, Pham TN, et al. (2020) A novel wrapper–based feature selection for early diabetes prediction enhanced with a metaheuristic. IEEE Access 9: 7869-7884. https://doi.org/10.1109/ACCESS.2020.3047942 |
| [37] |
Shokrekhodaei M, Cistola DP, Roberts RC, et al. (2021) Non-invasive glucose monitoring using optical sensor and machine learning techniques for diabetes applications. IEEE Access 9: 73029-73045. https://doi.org/10.1109/ACCESS.2021.3079182
|
| [38] |
Chawla NV, Bowyer KW, Hall LO, et al. (2002) SMOTE: synthetic minority over-sampling technique. J Artif Intell Res 16: 321-357. https://doi.org/10.1613/jair.953
|
| [39] |
Mukherjee M, Khushi M (2021) SMOTE-ENC: A novel SMOTE-based method to generate synthetic data for nominal and continuous features. Appl Syst Innov 4: 18. https://doi.org/10.3390/asi4010018
|
| [40] | Chaithanya BN, Swasthika Jain TJ, Usha Ruby A, et al. (2021) An approach to categorize chest X-ray images using sparse categorical cross entropy. Indones J Elect Eng Comput Sci : 1700-1710. https://doi.org/10.11591/ijeecs.v24.i3.pp1700-1710 |
| [41] |
Aslan MF, Sabanci K, Durdu A (2021) A CNN-based novel solution for determining the survival status of heart failure patients with clinical record data: numeric to image. Biomed Signal Proces 68: 102716. https://doi.org/10.1016/j.bspc.2021.102716
|
| [42] | Schuldt C, Laptev I, Caputo B (2004) Recognizing human actions: a local SVM approach. Proceedings of the 17th International Conference on Pattern Recognition, 2004. ICPR 2004. IEEE 3: 32-36. https://doi.org/10.1109/ICPR.2004.1334462 |
| [43] | Breiman L, Friedman JH, Olshen RA, et al. (1984) Classification and regression trees (Wadsworth, Belmont, CA). ISBN–13 : 978-0412048418. |
| [44] | Altman NS (1992) An introduction to kernel and nearest-neighbor nonparametric regression. Am Stat 46: 175-185. https://doi.org/10.1080/00031305.1992.10475879 |
| [45] |
Yager RR (2006) An extension of the naive Bayesian classifier. Informa Sciences 176: 577-588. https://doi.org/10.1016/j.ins.2004.12.006
|
| [46] |
Breiman L (2001) Random forests. Mach Learn 45: 5-32. https://doi.org/10.1023/A:1010933404324
|
| [47] |
Wu Y, Ding Y, Tanaka Y, et al. (2014) Risk factors contributing to type 2 diabetes and recent advances in the treatment and prevention. Int J Med Sci 11: 1185. https://doi.org/10.7150/ijms.10001
|
| [48] |
Joshi RD, Dhakal CK (2021) Predicting type 2 diabetes using logistic regression and machine learning approaches. Int J Environ Res Public Health 18: 7346. https://doi.org/10.3390/ijerph18147346
|
| [49] | [Global Dataset] Pima Indians Diabetes, GPL 2 License. Available from: https://www.kaggle.com/datasets/gargmanas/pima-indians-diabetes. |


Figures(9) / Tables(4)

A. Usha Ruby, J George Chellin Chandran, TJ Swasthika Jain, BN Chaithanya, Renuka Patil. RFFE – Random Forest Fuzzy Entropy for the classification of Diabetes Mellitus[J]. AIMS Public Health, 2023, 10(2): 422-442. doi: 10.3934/publichealth.2023030


 DownLoad: