Loading [MathJax]/jax/output/SVG/jax.js
Research article

Cecum microbiota in rats fed soy, milk, meat, fish, and egg proteins with prebiotic oligosaccharides

  • Received: 03 November 2020 Accepted: 12 January 2021 Published: 14 January 2021
  • Diet is considered the most influential factor in modulating the gut microbiota but how dietary protein sources differ in their modulatory effects is not well understood. In this study, soy, meat (mixture of beef and pork), and fish proteins (experiment 1) and soy, milk (casein), and egg proteins (experiment 2) were fed to rats with cellulose (CEL) and raffinose (RAF); the microbiota composition and short-chain fatty acid concentration in the cecum were determined. Egg protein feeding decreased the concentration of acetic acid and the richness and diversity of the cecum microbiota. RAF feeding increased the concentrations of acetic and propionic acids and decreased the richness and diversity of the cecum microbiota. When fed with CEL, the abundance of Ruminococcaceae and Christensenellaceae, Akkermansiaceae and Tannerellaceae, and Erysipelotrichaceae enhanced with soy protein, meat and fish proteins, and egg protein, respectively. The effects of dietary proteins diminished with RAF feeding and the abundance of Bifidobacteriaceae, Erysipelotrichaceae, and Lachnospiraceae increased and that of Ruminococcaceae and Christensenellaceae decreased regardless of the protein source. These results indicate that, although the effect of prebiotics is more robust and distinctive, dietary protein sources may influence the composition and metabolic activities of the gut microbiota. The stimulatory effects of soy, meat, and egg proteins on Christensenellaceae, Akkermansiaceae, and Erysipelotrichaceae deserve further examination to better elucidate the dietary manipulation of the gut microbiota.

    Citation: 
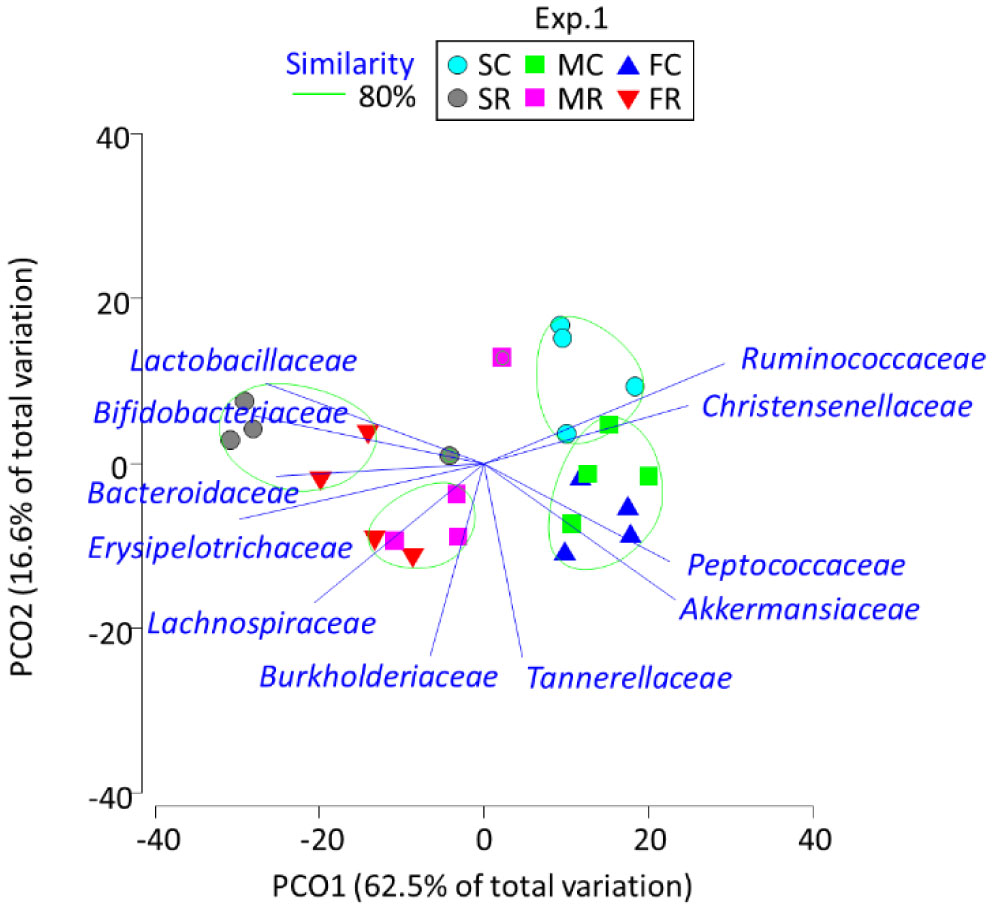
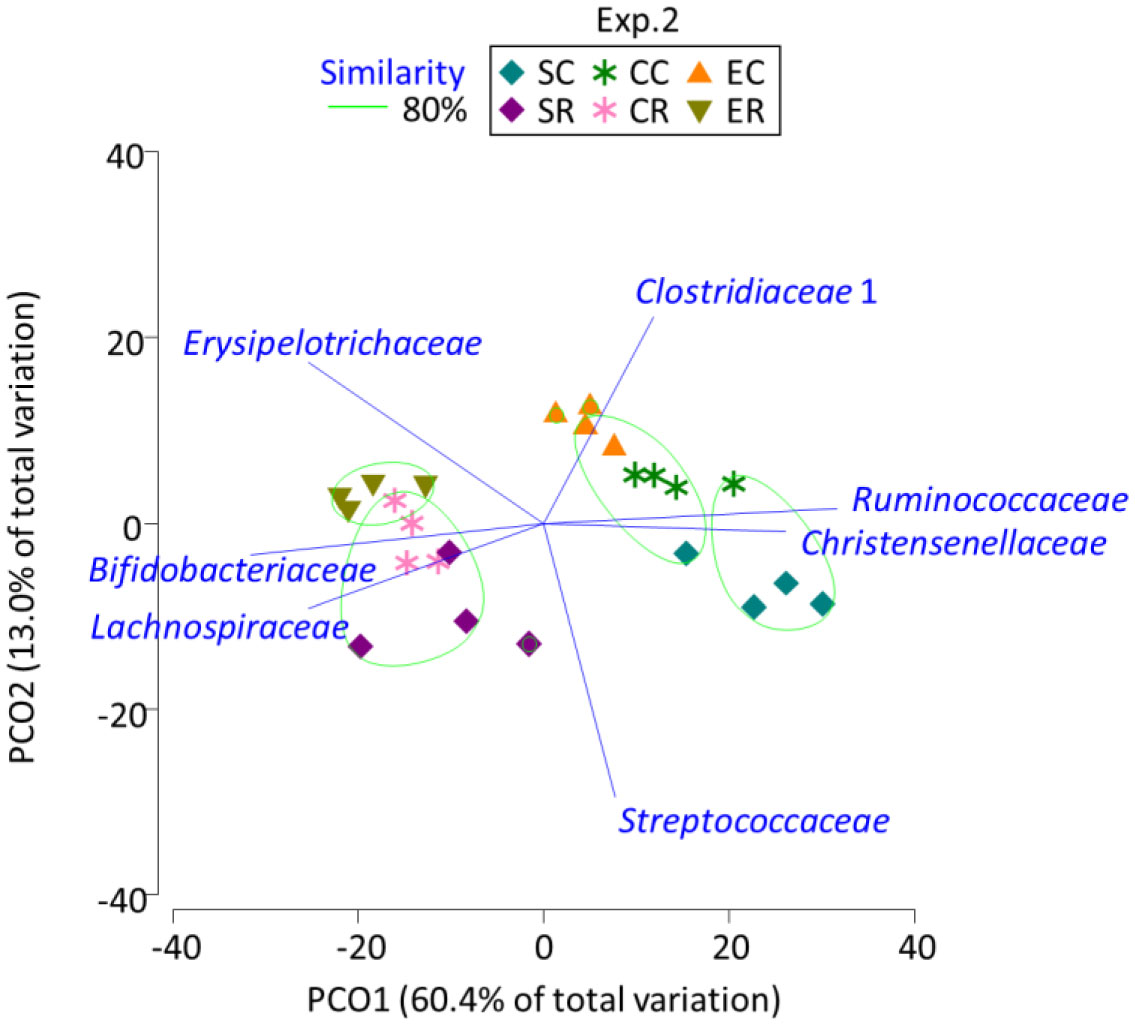
Souliphone Sivixay, Gaowa Bai, Takeshi Tsuruta, Naoki Nishino. Cecum microbiota in rats fed soy, milk, meat, fish, and egg proteins with prebiotic oligosaccharides[J]. AIMS Microbiology, 2021, 7(1): 1-12. doi: 10.3934/microbiol.2021001

    Related Papers:

    [1] Kawkab Al Amri, Qamar J. A Khan, David Greenhalgh . Combined impact of fear and Allee effect in predator-prey interaction models on their growth. Mathematical Biosciences and Engineering, 2024, 21(10): 7211-7252. doi: 10.3934/mbe.2024319
    [2] Saheb Pal, Nikhil Pal, Sudip Samanta, Joydev Chattopadhyay . Fear effect in prey and hunting cooperation among predators in a Leslie-Gower model. Mathematical Biosciences and Engineering, 2019, 16(5): 5146-5179. doi: 10.3934/mbe.2019258
    [3] Dirk Stiefs, Ezio Venturino, Ulrike Feudel . Evidence of chaos in eco-epidemic models. Mathematical Biosciences and Engineering, 2009, 6(4): 855-871. doi: 10.3934/mbe.2009.6.855
    [4] Yuhong Huo, Gourav Mandal, Lakshmi Narayan Guin, Santabrata Chakravarty, Renji Han . Allee effect-driven complexity in a spatiotemporal predator-prey system with fear factor. Mathematical Biosciences and Engineering, 2023, 20(10): 18820-18860. doi: 10.3934/mbe.2023834
    [5] Yuanfu Shao . Bifurcations of a delayed predator-prey system with fear, refuge for prey and additional food for predator. Mathematical Biosciences and Engineering, 2023, 20(4): 7429-7452. doi: 10.3934/mbe.2023322
    [6] Hongqiuxue Wu, Zhong Li, Mengxin He . Dynamic analysis of a Leslie-Gower predator-prey model with the fear effect and nonlinear harvesting. Mathematical Biosciences and Engineering, 2023, 20(10): 18592-18629. doi: 10.3934/mbe.2023825
    [7] Ranjit Kumar Upadhyay, Swati Mishra . Population dynamic consequences of fearful prey in a spatiotemporal predator-prey system. Mathematical Biosciences and Engineering, 2019, 16(1): 338-372. doi: 10.3934/mbe.2019017
    [8] Shunyi Li . Hopf bifurcation, stability switches and chaos in a prey-predator system with three stage structure and two time delays. Mathematical Biosciences and Engineering, 2019, 16(6): 6934-6961. doi: 10.3934/mbe.2019348
    [9] Rongjie Yu, Hengguo Yu, Chuanjun Dai, Zengling Ma, Qi Wang, Min Zhao . Bifurcation analysis of Leslie-Gower predator-prey system with harvesting and fear effect. Mathematical Biosciences and Engineering, 2023, 20(10): 18267-18300. doi: 10.3934/mbe.2023812
    [10] Wanxiao Xu, Ping Jiang, Hongying Shu, Shanshan Tong . Modeling the fear effect in the predator-prey dynamics with an age structure in the predators. Mathematical Biosciences and Engineering, 2023, 20(7): 12625-12648. doi: 10.3934/mbe.2023562
  • Diet is considered the most influential factor in modulating the gut microbiota but how dietary protein sources differ in their modulatory effects is not well understood. In this study, soy, meat (mixture of beef and pork), and fish proteins (experiment 1) and soy, milk (casein), and egg proteins (experiment 2) were fed to rats with cellulose (CEL) and raffinose (RAF); the microbiota composition and short-chain fatty acid concentration in the cecum were determined. Egg protein feeding decreased the concentration of acetic acid and the richness and diversity of the cecum microbiota. RAF feeding increased the concentrations of acetic and propionic acids and decreased the richness and diversity of the cecum microbiota. When fed with CEL, the abundance of Ruminococcaceae and Christensenellaceae, Akkermansiaceae and Tannerellaceae, and Erysipelotrichaceae enhanced with soy protein, meat and fish proteins, and egg protein, respectively. The effects of dietary proteins diminished with RAF feeding and the abundance of Bifidobacteriaceae, Erysipelotrichaceae, and Lachnospiraceae increased and that of Ruminococcaceae and Christensenellaceae decreased regardless of the protein source. These results indicate that, although the effect of prebiotics is more robust and distinctive, dietary protein sources may influence the composition and metabolic activities of the gut microbiota. The stimulatory effects of soy, meat, and egg proteins on Christensenellaceae, Akkermansiaceae, and Erysipelotrichaceae deserve further examination to better elucidate the dietary manipulation of the gut microbiota.


    The class imbalance problem refers to the hot potato that the quantity of one class presents abnormal characteristic, which is much larger or less than the other classes of samples and the cost of misclassification between this classes of samples is different, leading to failure for standard classifiers. Thus, characteristics of class imbalanced datasets are shown as follows: the quantity imbalanced of different classes of samples and the cost imbalanced of miscalculation (Li et al., 2019). Usually, class imbalanced learning methods are considered as the technologies that can solve the above problem, which are widely used in several files such as bioinformatics (Blagus and Lusa, 2013), software defect monitoring (Lin and Lu, 2021), text classification (Ogura et al., 2011), and computer vision (Pouyanfar and Chen, 2015) etc. Therefore, these broad applications reveal tremendous value to research class imbalanced learning methods.

    Standard classifiers such as logistic regression (LR), Support Vector Machine (SVM) and decision tree (DT) are suitable for balanced training sets. When facing imbalanced scenarios, these models often provide suboptimal classification results (Ye et al., 2019). For example, when facing imbalanced datasets, it is possible that unsatisfactory classification result was produced by Bayesian classifier, and the unsatisfactory classification result was influenced by the overlapping range of different class in the sample space (Domingos and Pazzani, 1997). Similarly, when the SVM classifier is employed to handle class imbalanced datasets, the optimal hyperplane will move to the core range of the majority class. Particularly, when data sets present the characteristic of highly imbalanced (Jiang et al., 2019) or interclass aggregation (Zhai et al., 2010), we obtained outcome that all sub-cluster samples of the minority class will be misclassified.

    Therefore, the class imbalanced influenced the result of standard classifiers (Yu et al., 2019). Generally speaking, the class imbalance ratio (IR) is defined as the ratio of majority class size to minority class size, which can measure the degree of class imbalance in data sets. According to literature analysis, the result of standard classifiers influenced by class imbalanced was generally positive proportion that the greater IR was, the greater the impact has (Cmv and Jie, 2018). However, we should realize that class imbalance does not always lead poor results to the classifier. In addition, the following are also some factors that affect the results of standard classifiers:

    ● The scale of the overlapping space, which refers to the feature that different classes of samples have no clear boundary in the sample space.

    ● The number of noise samples, which refers to a few examples of one class far away from the core area of the class (López et al., 2015).

    ● The number of training samples, which refers to the model training samples (Yu et al., 2016).

    ● The degree of interclass aggregation, which refers to this feature that one class samples present two or more clusters in the sample space, and these clusters can distinguish major and minor (Japkowicz et al., 2002).

    ● The dimension of dataset, which refers to the number of features.

    The above factors lead a suboptimal result. It is worth noting that when the above factors appear in the imbalanced datasets, worse results will emerge than of in the balanced scenario. Here, we generated a series of data sets to verify the influence of these factors on standard classifiers. Detailed results are shown in the appendix.

    In this research, we aim to provide an overview of class imbalanced learning methods. The rest of this research is organized as follows. Section 2 introduces approaches to addressing class imbalanced dataset both data driven and algorithm driven. Section 3 provides a review of measurement of classifier performance to class imbalanced classifiers. In Section 4, we discuss our opinions for the challenges and directions of future from to analysis of relevant literature. Finally, Section 5 presents the conclusions of this study.

    The research of class imbalance learning originated in the late 1990s. Since then, numerous methods have been developed. Thus, this study discusses the key methods to handle class imbalanced problems from data driven (Liu et al., 2019) and algorithm driven (Wu et al., 2019).

    Methods from the data drive, also known as data-level methods or resampling methods. These methods reverse the property of the imbalance characteristics of classes' quantity by randomly generating cases of the minority class (ROS) or removing cases of the majority class (RUS). It can be regarded as one of data preprocessing processes, therefore, resampling and the classifier training processes are independent on each other, and it was compatible with standard classifiers (Maurya and Toshniwal, 2018; Wang and Minku, 2015).

    About methods of data driven can be described as follows.

    Firstly, researchers pointed out that the random resampling can be used to deal with class imbalanced datasets, which was the simplest data-driven method to improve the classification accuracy of the minority class. But the uncomplicated data driven methods present some shortcomings, for instance, longer learning time, more running memory and poor generalization ability were presented by Oversampling due to the repeatability of samples. In addition, Undersampling will reduce the performance of classification owing to the lack of information resulted from the elimination of samples. Secondly, as the disadvantages of simple random sampling technology were exposed, some better methods were developed such as the synthetic minority oversampling techniques (SMOTE) (Chawla et al., 2011) and Borderline-SMOTE (Hui et al., 2005). The former method was proposed by Chawla et al. (2002). It was an oversampling algorithm that based on k-nearest neighbor (KNN) to synthesize a new virtual sample of the minority classes randomly among the minority class. Compared with ROS, SMOTE had a stronger ability of generalization and overcame overfitting in a certain extent. Borderline-SMOTE was an oversampling strategy based on SMOTE. Borderline-SMOTE synthesizes mainly the minority class samples at the class boundary, therefore, the method's classification result was better than SMOTE when one dataset with a few noise samples. In recent years, with the continuous progress of computer technology, some more superior methods have been proposed such as the cleaning resampling method (Koziarski et al., 2020), and based-radial undersampling method (Krawczyk et al., 2020), etc. Analyzing data driven methods, Yu deemed that the data driven methods underwent three stages random sampling technology stage, manual sampling technology stage and complex algorithm stage (Yu, 2016), shown in Figure 1.

    Figure 1.  The three stages of methods from data driven.

    Table 1 provides a summary of data driven method and its analysis. We can draw that the overlapping was important factor affecting the impact of standard classifiers, and that different cases were have different impacts on classification in the sample space, and that some concepts were defined by researchers such as "energy (Li L et al., 2020)" to provide some information for resampling.

    Table 1.  The summary of some methods from data driven.
    Methods and illustrations
    Over-sampling ROS: generated the cases of the minority class randomly
    SMOTE: generated the cases of the minority class with KNN randomly
    Under-sampling Borderline-SMOTE: generated the cases of the minority with SMOTE in overlapping range
    EOS: generated the cases of the minority class randomly with "entropy" information
    RBO: generated the cases of the minority class randomly with "radial" information
    RUS: removed the cases of the majority class randomly
    SMOTE + ENN (Tao et al., 2019): removed the cases of the majority class with KNN randomly
    SMOTE + Tomek (Wang et al., 2019): removed the cases of the majority with deleting Tomek cases
    OSS (Rodriguez et al., 2013): removed the cases of the majority with just deleting the case of the majority in Tomek cases
    SBC (Xiao and Gao, 2019): removed the cases of the majority class with the clustering theory randomly
    Hybrid sampling EUS: removed the cases of the majority class randomly with "entropy" information
    EHS: hybrid resampling that entropy based
    CCR: hybrid resampling that synthesizing and cleaning based

     | Show Table
    DownLoad: CSV

    Data driven methods are regarded as independent of classifiers methods. Yet algorithm driven methods are regarded as dependent classifiers methods. These methods are improving standard classifiers that include cost-sensitive learning based and threshold moved based mainly. For methods of algorithm driven, the main core algorithm was cost sensitive learning, and the supported learning algorithms include four learning technologies: active learning, decision compensation learning, feature extraction learning and emblems learning.

    Cost sensitive learning was one of the frequently used technologies to solve the problem of class imbalanced (Wan and Yang, 2020), and its goal is to minimize the cost of overall misclassification. In the process of model learning, according to the practical problems, different factors of penalty cost were given to different classes. Cost sensitive learning's core is the design of cost matrix which could combine with the standard classifiers model to improve classification result (Zhou and Liu, 2010). For instance, we could obtain a posteriori probability which was more suitable for dealing with class imbalance problems, though the original Bayesian classifier posterior probability was fused with cost matrix (Kuang et al., 2019). And DT classifier integrated cost matrix into the process of attribute selection and pruning for the purpose of optimizing the classification result (Ping et al., 2020).

    What the above analysis shows is that the technology was strongly dependent on cost matrix. Main design methods are as follows:

    ● Empirical weighted design, which shows that the cost coefficients of the samples of the same class are the same (Zong et al., 2013).

    ● Fuzzy weighted design, which shows that the cost coefficients of the same class are different in different position of sample spaces (Dai, 2015).

    ● Adaptive weighted design, which is iterative and dynamic, converging to the global optimum in an adaptive way (Sun et al., 2007).

    Active learning's core idea refers to obtain cases that are difficult to mark out class to train one model. For active learning: firstly, the experts manually labelled the sample labels served as the initial training set, and then put it to use to learn the classifier. Secondly, some query algorithms were used to select samples that samples of one class are indistinguishable from other classes. And these samples are labeled by experts to expand the training dataset. Thirdly, the label samples are added to train a new classifier. After repeating step two and step three, qualified classifier is obtained. Merit of active learning is decreasing size of train samples, keeping main information, and reducing manual (Attenberg and Ertekin, 2013).

    Decision Adjustment learning modifies the decision threshold, which is directly making positive compensation for the decision to correct the original unsatisfactory decision. In essence, it is an adjustment strategy, which makes the classification results tend to core range of the minority (Gao et al., 2020).

    Class imbalanced learning from feature selection driven refers to which the key features are preserved, which can increase the discrimination degree between the minority class and the majority classes, and improve the accuracy of the minority class and even any class. Feature extraction skills mainly include convolution neural network (CNN) and recurrent neural network (RNN) (Hua and Xiang, 2018). According to whether or not the evaluation criteria selected by feature selection are related to classifiers, three models have been developed: filter, wrapper and embedded (Bibi and Banu, 2015). These above ideas were noticed by researchers, and then series features of driven based algorithms were proposed (Shen et al., 2017; Xu et al., 2020). These algorithms have been applied to high dimensional data processing such as software defect (He et al., 2019), bioinformatics (Sunny et al., 2020), natural language processing (Wang et al., 2020) and network public opinion analysis (Luo and Wu, 2020).

    Ensemble learning can first review the idea of cascade multi classification integration system written by Sebestyen. Ensemble learning is also one of the important technologies of machine learning. It can solve the limitations of some single algorithms by strategically building multiple base algorithms and combing them to complete classification task. One weak classifier that is slightly better than random conjecture can be promoted to a strong classifier by ensemble learning (Witten et al., 2017; Schapire, 1990).There are two leading frameworks for ensemble learning: one is Bagging framework (Breiman, 1996), and the representative algorithm is random forest algorithm (Verikas et al., 2011), and the other is Boosting framework (Ling and Wang, 2014; Li et al., 2013), and the representative algorithm is AdaBoost algorithm (Schapire, 2013).

    Resampling-based ensemble learning, which is defined as an ingenious combination of resampling and ensemble learning. The simplicity of bagging paradigm firstly was noticed by researchers, and then multifarious algorithms have been developed, such as AsBagging algorithm (Tao et al., 2006) and UnderOverBagging algorithms (Wang and Yao, 2009). The former perfectly combines RUS with Bagging, and its merit is that it could reserve all cases of the majority class and reduce overfitting degree of the minority class. Meanwhile, AsBagging algorithm makes the classification result more stable because of the random resampling method and ensemble learning. Nevertheless, the result of the algorithm may is swinging with handing multi-noise datasets, and the reason is that the algorithm uses Bootstrap technology to create the train datasets of the basic algorithm. Thus, AsBagging_FSS algorithm (Yu and Ni, 2014) was proposed, which combined with the random feature subspace generation strategy (FSS). Because FSS can reduce the impact of noise samples on the basic classification algorithm, the classification results of the basic classification of the algorithm can get a better result. Therefore, AsBagging_FSS algorithm is better than AsBagging_FSS in dealing with the imbalanced data sets with noise samples. Except for combination of the resampling methods and Bagging ensemble learning framework, researchers also research the combination of the Booting framework and then develop some algorithms, such as SMOTEBoost algorithm (Chawla et al., 2003) and RUSBoost algorithm (Seiffert, 2010). Besides, the Hybrid framework (Galar, 2012) that was fusion of the Bagging and the Boosting was also noticed by researchers. Based on this idea, EasyEnsemble algorithm and BalanceCascade algorithm were proposed by Liu et al (Liu et al., 2009).EasyEnsemble algorithm is Bagging-based AdaBoost ensemble learning algorithm, which used Adaboost algorithm as basic classifier and first uses RUS algorithm to generate balanced train datasets of basic algorithm. EasyEnsemble algorithm can lower the variance and deviation of classification result, which makes the classification result become stable and presents stronger generalization ability. The BalanceCascade algorithm is improved EasyEnsemble algorithm. This algorithm's ingenious idea is that the correctly classified samples are constantly removed in the basic classifier train datasets, so that the classifier can repeatedly learn misclassified samples. Therefore, the generation of base classifier in the former algorithm is a parallel relationship, while the generation of base classifier in the latter algorithm is a serial relationship. Some representative algorithms are shown in Table 2.

    Table 2.  Representatives of ensemble learning methods.
    Algorithms Ensemble frameworks Combined strategies
    Data driven AsBagging Bagging Bootstrap
    UnderBagging Bagging Undersampling
    OverBagging Bagging Oversampling
    SMOTEBagging Bagging SMOTE
    SMOTEBoost Boost SMOTE
    RUSBoost Boost Undersampling
    EasyEnsemble Hybrid Undersampling
    BalanceCascade Hybrid Undersampling
    Cost-sensitive CS-SemiBagging Bagging Fuzzy cost matrix
    AdaCX Boost Empirical cost matrix
    AdaCost Boost Fuzzy cost matrix
    DE-CStacking Stacking Adaptive cost matrix

     | Show Table
    DownLoad: CSV

    Ensemble algorithm is based on cost sensitive learning, which combines cost sensitive learning with ensemble learning. For example, AdaCX algorithm (Sun et al., 2007), which combines cost sensitive learning and AdaBoost algorithm, aiming to giving a larger weight to the minority class. The core of this algorithm is that update weights are different from different classes, which can be able to amplify effect of the cost sensitive, and AdaC1, AdaC2 and AdaC3 algorithm are developed based on different update weights. In addition, similar algorithms include AdaCost algorithm (Zhang, 1999), CBS1 algorithm and CBS2 algorithm (Ling, 2007). In addition, algorithms based on other frames are developed, such as the CS-SemiBagging algorithm of based Bagging ensemble framework (Ren et al., 2018), and the DE-CStacking algorithm (Gao et al., 2019) of based Stacking ensemble framework (Wolpert, 1992).

    Ensemble learning algorithm is based on decision adjustment learning, among these algorithms, the classical algorithm is EnSVM-OTHR algorithm (Yu et al., 2015), which is the SVM-OTHR algorithm as the basic classifier and Bagging frameworks as the learning framework. EnSVM-OTHR algorithm uses bootstrap sampling and random interference to enhance the diversity of basic classifiers.

    From the above analysis, we can draw a conclusion that ensemble learning can be applied to deal with the problem of class imbalance, especially for linear indivisible data, the ensemble learning presents better classification results. In the future, the ensemble-based class imbalanced learning methods will be one of the main research directions (Tsai and Liu, 2021). However, ensemble learning presents disadvantages of long training time and high computational complexity. Especially, it is also a bottleneck to deal with high dimensional and large scale data. Therefore, ensemble learning based on algorithms are facing with new challenges and opportunities in the era of big data. To solve this problem, ensemble learning can combine with feature extraction to reduce the data dimension. Or we deal with the problem of computational complexity by using the distributed Computing (Yang, 1997; Guo et al., 2018).

    To sum up, the class imbalanced learning methods were analyzed from two different motivations. Although methods are from different ideas, the pursuit of the goal is consistent. Both data-driven methods and algorithm driven methods pursue the maximum accuracy of all classes. Therefore, methods from the data driven are essentially the same as the cost sensitive technology of some methods from algorithm driven. For example, in the random oversampling, in generating cases of the minority classes to balance quantity, it is also equivalent to giving the classifier a cost of IR times to the minority for some classifiers. The methods of manual resampling are similar to the idea of fuzzy cost sensitive algorithms, both of which use the prior information of samples to generate cases of the minority class or obtain the cost matrix.

    Based on the above analysis, related experiments were designed:

    ● Experimental environment: Python 3.8.5 (64x), sklearn module, decision tree classifier (DT), default parameters.

    ● Dataset from keel website, shown in the Table 3, and the ratio of train set to test set is set to 7:3, which designates "Tra: Tes".

    Table 3.  Summary of data sets used in the experiment.
    Data sets Variates Size IR Tra: Tes
    yeast 8 514 9.08 7:3
    glass 9 314 3.20 7:3
    cleveland 13 177 16.62 7:3
    vehicle 18 846 3.25 7:3

     | Show Table
    DownLoad: CSV

    We designed 10 oversampling experiments for that dataset, and randomly recorded the experimental results of four of them and calculated that average, numbered as "1", "2", "3", "4", and "average". We also designed an empirical weighted cost sensitive experiment as a contrast, and the result of the experiment is numbered "cost-sen". This conclusion has been obtained that cost sensitive experiment may catch similar classification results in oversampling experiments. Above analysis is shown in the Table 4.

    Table 4.  Results from DT classifier of oversampling-based and cost sensitive based.
    Dataset Item Precision Recall F1-Score Accuracy
    yeast 1 0.9231 0.5714 0.7059 0.9355
    2 0.8462 0.6471 0.7333 0.9484
    3 0.9231 0.5714 0.7059 0.9355
    4 0.8462 0.5500 0.6667 0.9290
    average 0.8847 0.5850 0.7030 0.9371
    cost-sen 0.92310 0.5714 0.7059 0.9355
    glass 1 0.8125 1.0000 0.8966 0.9538
    2 0.8750 1.0000 0.9333 0.8769
    3 0.9375 1.0000 0.9677 0.9846
    4 0.9375 1.0000 0.9677 0.9846
    average 0.8906 1.0000 0.9413 0.9500
    cost-sen 0.8750 1.0000 0.9333 0.8769
    cleveland 1 0.6667 0.3333 0.4444 0.9038
    2 0.3333 0.2500 0.2857 0.9038
    3 0.3333 0.2000 0.2500 0.8846
    4 0.3333 0.2500 0.2857 0.9038
    average 0.4167 0.2583 0.3165 0.8990
    cost-sen 0.3333 0.2500 0.2857 0.9038
    vehicle 1 0.8788 0.9062 0.8923 0.9449
    2 0.8333 0.9016 0.8661 0.9331
    3 0.8636 0.9194 0.8906 0.9449
    4 0.8485 0.918 0.8819 0.9409
    average 0.8561 0.9113 0.8827 0.94095
    cost-sen 0.8182 0.9153 0.8640 0.93310

     | Show Table
    DownLoad: CSV

    After analyzing, we can acquire the general processing to imbalanced datasets, shown in Figure 2.

    Figure 2.  Flowchart of the handle to class imbalanced data.

    Thus, we can draw the following conclusions. If one dataset is class imbalanced and non-overlapping, it is possible that standard classifiers are not affected. When it is overlapping in sample space to the dataset, it is difficult to categorize the sample of overlapping range; decision result is affected by the inverse probability theory which makes the decision results prefer the majority class. In this case, class imbalanced learning methods such as the data driven or algorithm driven method mentioned above can be employed. Or when the dataset has the phenomenon of interclass aggregation, it is difficult for a single classifier to distinguish the samples of the sub-aggregation range of the minority class. So, we can use ensemble-based class imbalanced learning to solve this data. In this way, it may improve the accuracy of all classes of the single classifier. In addition, when we get one classifier, we also can adjust the decision threshold by the decision adjustment learning according to experience, which may achieve better results. The whole process is illustrated in Figure 2.

    For result evaluation indexes of the different classifiers, a series of indexes such as threshold based, probability based and grade based can be found in some scientific literature (Luque et al., 2019). But some indexes of standard classifiers are unsuitable for the study file of the class imbalanced classifiers. Usually, we use robustness indexes such as F-measure, G-means metric, MCC and AUC. These based on confusion matrix indexes are creative.

    An explanation of the Table 5: TP (TN) is the number of samples that originally belong to the positive (negative) class and belong to the positive (negative) class after classification, which represents the number that is correctly classified; FP (FN) is the number of samples that originally belong to the negative (positive) class and belong to the positive (negative) class after classification, which represents the number of misclassifications.

    Table 5.  Confusion matrix of classification results.
    Prediction positive Prediction negative
    Positive class True positive (TP) False negatives (FN)
    Negative class False positive (FP) True negatives (TN)

     | Show Table
    DownLoad: CSV

    A series of concepts such as Precision, Recall and TNP etc. are constructed by researchers:

    Accuracy=TP+TNTP+TN+FP+FN (1)
    Precision=TPTP+FP (2)
    Recall=TPTP+FN (3)
    TNR=TNTN+FP (4)
    GMean=TPR×TNR (5)
    FMeasure=Precision×Recall (6)
    F1score=2×Precision×RecallPrecision+Recall (7)
    MCC=TP×TNFP×FN(TP+FP)(TP+FN)(TN+FN)(TN+FN) (8)

    Equation (3)'s "Recall" also can be called TPR.

    G-mean is the geometric mean that is the accuracy of the positive class and the negative class. When the accuracy of the two classes is robustness, the G-Mean value becomes the optimal value. F-Measure is some similarity in the principle G-Mean. When the value of the Precision and Recall is roughly the same, the F-Measure value also becomes the optimal value. MCC represents the correlation degree between the real result and the predicted result, which is not affected by the class imbalance data. As one of correlation coefficients, the MCC value range is between −1 and 1. AUC is the area under ROC, and ROC is an important plane curve by FPR as the horizontal coordinate and TPR as the vertical coordinate.

    At present, class imbalanced learning methods have developed many mature methods in binary data, and a lot of algorithms and tools are used in various applications. In this era of big data, class imbalanced learning methods are facing some new challenges (Leevy et al., 2018; Chandresh et al., 2016):

    ● Large scale data processing problems: overcoming the increasing computational complexity and memory consumption.

    ● High dimensional data processing problems: sparse data processing.

    ● Data stream processing problems: the development of scalable online algorithms.

    ● Missing label data processing problems: semi supervised algorithm development.

    ● Multi class imbalance processing problems: the new definition of class imbalanced degree.

    ● Highly imbalanced processing problems: the development of accurate discriminant algorithms for the minority samples.

    Nowadays, the processing of the class imbalanced problem is still research hotspot. The future research prospects are as follows:

    ● Strengthen theoretical research and enhance the interpretability of the algorithms. So far, there is a lack of theoretical research on class imbalanced model classification. It is difficult to interpret some the methods and evaluation is empirical.

    ● Adapt to the current research and be fit to the topical development. The complex data lead to the failure result of many traditional methods. Therefore, auxiliary technologies such as feature creation, feature extraction and active learning will be further applied in the study of the complex data.

    In this research, we attempted to provide a review of methods in class imbalance problem. Different from other researches that have been published in imbalanced learning field, research are reviewed from both core technologies which are including the resampling methods and the cost sensitivity learning, and supporting technologies which include the active leaning and others. Through our analysis, we found some interesting conclusions flowingly:

    ● Data resampling based on classifiers are generally used in biomedical field due to the fact that biomedical data generally are fixed with structure and have multifarious similarity measurement between samples. Cost-sensitive learning technology is generally used in the operational research field, because its goal is to minimize the cost. With the improvement of data technology, data with high dimensionality and large scale are aroused by sensors. Feature extraction learning is used to reduce the complexity of some algorithms by reducing the dimension in high dimensional data. Distributed computing technology will be used to relieve the problem of insufficient memory in the single machine model in large scale data.

    ● The class imbalance rate is not an absolute condition that affects the result of the standard classifier. The standard classification model, in which the class of data is non-overlapping in the sample space, can also train outstanding result. When facing various datasets, researchers will choose the appropriate processing method according to the different data characteristics. For instance, when facing datasets with interclass aggregation factor, researchers often choose ensemble learning and complex classifiers that enable to distinguish examples of the secondary features of in interclass. When facing datasets with fewer labels, researchers will choose semi-supervised, active learning and other supporting technologies to fit to the imbalanced dataset.

    ● The main challenge to fit to valid classifiers for class imbalanced datasets is the increasing complexity of data. For example, the processing of unstructured data such as language, text and web pages often needs data cleaning and feature representation. In addition, the handing of stream data generated by sensors requires developing dynamic learning algorithm with strong scalability and non-traditional memory.

    At the end of this study, the future research directions are put forward from reviewing, which is also our focus in the future research.

    This work was supported by NSSF of China (18BTJ029).

    All authors declare no conflicts of interest in this paper.


    Conflict of interest


    The authors declare no conflict of interest.

    Author Contributions


    Conceptualization, N.N.; investigation, S.S. and G.B; resources, T.T. and N.N.; data curation, S.S. and G.B; writing—original draft preparation, S.S.; writing—review and editing, N.N.; supervision, T.T. and N.N.; funding acquisition, N.N.

    [1] Flint HJ, Scott KP, Louis P, et al. (2012) The role of the gut microbiota in nutrition and health. Nat Rev Gastroenterol Hepatol 9: 577-589. doi: 10.1038/nrgastro.2012.156
    [2] Graf D, Cagno RD, Fak F, et al. (2015) Contribution of diet to the composition of the human gut microbiota. Microb Ecol Health Dis 26: 26164.
    [3] Yang Q, Liang Q, Balakrishnan B, et al. (2020) Role of dietary nutrients in the modulation of gut microbiota: A narrative review. Nutrients 12: 381. doi: 10.3390/nu12020381
    [4] Beaumont M, Porune KJ, Steuer N, et al. (2017) Quantity and source of dietary protein influence metabolite production by gut microbiota and rectal mucosa gene expression: a randomized, parallel, double-blind trial in overweight humans. Am J Clin Nutr 106: 1005-1019. doi: 10.3945/ajcn.117.158816
    [5] Ma N, Tian Y, Wu Y, et al. (2017) Contributions of the interaction between dietary protein and gut microbiota to intestinal health. Curr Protein Pept Sci 18: 795-808.
    [6] Zhu Y, Lin X, Zhao F, et al. (2015) Meat, dairy and plant proteins alter bacterial composition of rat gut bacteria. Sci Rep 5: 15220. doi: 10.1038/srep15220
    [7] Bai G, Ni K, Tsuruta T, et al. (2016) Dietary casein and soy protein isolate modulate the effects of raffinose and fructooligosaccharides on the composition and fermentation of gut microbiota in rats. J Food Sci 81: H2093-H2098. doi: 10.1111/1750-3841.13391
    [8] Zhu Y, Shi X, Lin X, et al. (2017) Beef, chicken, and soy proteins in diets induce different gut microbiota and metabolites in rats. Front Microbiol 8: 1395. doi: 10.3389/fmicb.2017.01395
    [9] Comerford KB, Pasin G (2016) Emerging evidence for the importance of dietary protein source on glucoregulatory markers and type 2 diabetes: Different effects of dairy, meat, fish, egg, and plant protein foods. Nutrients 8: 446. doi: 10.3390/nu8080446
    [10] Yu H, Qiu N, Meng Y, et al. (2020) A comparative study of the modulation of the gut microbiota in rats by dietary intervention with different sources of egg-white proteins. J Sci Food Agric 100: 3622-3629. doi: 10.1002/jsfa.10387
    [11] Xia Y, Fukunaga M, Kuda T, et al. (2020) Detection and isolation of protein susceptible indigenous bacteria affected by dietary milk-casein, albumen and soy-protein in the caecum of ICR mice. Int J Biol Macromol 144: 813-820. doi: 10.1016/j.ijbiomac.2019.09.159
    [12] Bai G, Tsuruta T, Nishino N (2017) Dietary soy, meat, and fish proteins modulate the effects of prebiotic raffinose on composition and fermentation of gut microbiota in rats. Int J Food Sci Nutr 69: 480-487. doi: 10.1080/09637486.2017.1382454
    [13] Yu Z, Morrison M (2004) Improved extraction of PCR-quality community DNA from digesta and fecal samples. Biotechniques 36: 808-812. doi: 10.2144/04365ST04
    [14] Nguyen TT, Miyake A, Tran TTM, et al. (2019) The relationship between uterine, fecal, bedding, and airborne dust microbiota from dairy cows and their environment: A pilot study. Animals 9: 1007. doi: 10.3390/ani9121007
    [15] Scheppach W (1994) Effects of short chain fatty acids on gut morphology and function. Gut 35: S35-S38. doi: 10.1136/gut.35.1_Suppl.S35
    [16] Hosseini E, Grootaert C, Verstraete W, et al. (2011) Propionate as a health-promoting microbial metabolite in the human gut. Nutr Rev 69: 245-258. doi: 10.1111/j.1753-4887.2011.00388.x
    [17] An C, Kuda T, Yazaki T, et al. (2014) Caecal fermentation, putrefaction and microbiotas in rats fed milk casein, soy protein or fish meal. Appl Microbiol Biotechnol 98: 2779-2787. doi: 10.1007/s00253-013-5271-5
    [18] van Zanten GC, Knudsen A, Röytiö H, et al. (2012) The effect of selected synbiotics on microbial composition and short-chain fatty acid production in a model system of the human colon. PLoS One 7: e47212. doi: 10.1371/journal.pone.0047212
    [19] Sokol H, Pigneur B, Watterlot L, et al. (2008) Faecalibacterium prausnitzii is an anti-inflammatory commensal bacterium identified by gut microbiota analysis of Crohn disease patients. PNAS 105: 16731-16736. doi: 10.1073/pnas.0804812105
    [20] Schneeberger M, Everard A, Gómez-Valadés AG, et al. (2015) Akkermansia muciniphila inversely correlates with the onset of inflammation, altered adipose tissue metabolism and metabolic disorders during obesity in mice. Sci Rep 5: 16643. doi: 10.1038/srep16643
    [21] Martínez I, Perdicaro DJ, Brown AW, et al. (2013) Diet-induced alterations of host cholesterol metabolism are likely to affect the gut microbiota composition in hamsters. Appl Environ Microbiol 79: 516-524. doi: 10.1128/AEM.03046-12
    [22] Li X, Li Z, He Y, et al. (2020) Regional distribution of Christensenellaceae and its associations with metabolic syndrome based on a population-level analysis. PeerJ 8: e9591. doi: 10.7717/peerj.9591
    [23] Biagi E, Franceschi C, Rampelli S, et al. (2016) Gut microbiota and extreme longevity. Curr Biol 26: 1480-1485. doi: 10.1016/j.cub.2016.04.016
    [24] Kim BS, Choi CW, Shin H, et al. (2019) Comparison of the gut microbiota of centenarians in longevity villages of South Korea with those of other age groups. J Microbiol Biotechnol 29: 429-440. doi: 10.4014/jmb.1811.11023
    [25] Kaakoush NO (2015) Insights into the role of Erysipelotrichaceae in the human host. Front Cell Infect Microbiol 5: 84. doi: 10.3389/fcimb.2015.00084
    [26] Shastri P, McCarville J, Kalmokoff M, et al. (2015) Sex differences in gut fermentation and immune parameters in rats fed an oligofructose-supplemented diet. Bio Sex Differ 6: 13. doi: 10.1186/s13293-015-0031-0
  • This article has been cited by:

    1. Vincent Peter C. Magboo, Ma. Sheila A. Magboo, 2022, Chapter 2, 978-3-031-14831-6, 23, 10.1007/978-3-031-14832-3_2
    2. M. Shyamala Devi, J. Arun Pandian, P. S. Ramesh, A. Prem Chand, Anshumam Raj, Ayush Raj, Rahul Kumar Thakur, 2023, Chapter 34, 978-981-19-5291-3, 363, 10.1007/978-981-19-5292-0_34
    3. Yuejun Guo, Qiang Hu, Qiang Tang, Yves Le Traon, 2024, Chapter 19, 978-3-031-51481-4, 371, 10.1007/978-3-031-51482-1_19
    4. Derrick Hoang Danh Nguyen, Arinah Jing Hui Tan, Ronjin Lee, Wei Feng Lim, Jia Yih Wong, Fadhlina Suhaimi, Monitoring of plant diseases caused by Fusarium commune and Rhizoctonia solani in bok choy using hyperspectral remote sensing and machine learning, 2024, 1526-498X, 10.1002/ps.8414
    5. Derrick Nguyen, Arinah Tan, Ronjin Lee, Wei Feng Lim, Tin Fat Hui, Fadhlina Suhaimi, Early detection of infestation by mustard aphid, vegetable thrips and two-spotted spider mite in bok choy with deep neural network (DNN) classification model using hyperspectral imaging data, 2024, 220, 01681699, 108892, 10.1016/j.compag.2024.108892
    6. Ananthajit Ajaya Kumar, Ashwani Assam, Addressing performance improvement of a neural network model for Reynolds-averaged Navier–Stokes solutions with high wake formation, 2024, 41, 0264-4401, 1740, 10.1108/EC-08-2023-0446
    7. Xiaoyan Zhao, Shaopeng Guan, CTCN: a novel credit card fraud detection method based on Conditional Tabular Generative Adversarial Networks and Temporal Convolutional Network, 2023, 9, 2376-5992, e1634, 10.7717/peerj-cs.1634
    8. Yan Peng, Hanzi Chen, Tinghui Li, The Impact of Digital Transformation on ESG: A Case Study of Chinese-Listed Companies, 2023, 15, 2071-1050, 15072, 10.3390/su152015072
    9. Jun Ye, Shoulei Lu, Jiawei Chen, A New Image Oversampling Method Based on Influence Functions and Weights, 2024, 14, 2076-3417, 10553, 10.3390/app142210553
    10. Chun-Chao Huang, Hsin-Fan Chiang, Cheng-Chih Hsieh, Bo-Rui Zhu, Wen-Jie Wu, Jin-Siang Shaw, Impact of Dataset Size on 3D CNN Performance in Intracranial Hemorrhage Classification, 2025, 15, 2075-4418, 216, 10.3390/diagnostics15020216
  • Reader Comments
  • © 2021 the Author(s), licensee AIMS Press. This is an open access article distributed under the terms of the Creative Commons Attribution License (http://creativecommons.org/licenses/by/4.0)
通讯作者: 陈斌, bchen63@163.com
  • 1. 

    沈阳化工大学材料科学与工程学院 沈阳 110142

  1. 本站搜索
  2. 百度学术搜索
  3. 万方数据库搜索
  4. CNKI搜索

Metrics

Article views(4989) PDF downloads(264) Cited by(9)

Figures and Tables

Figures(2)  /  Tables(2)

/

DownLoad:  Full-Size Img  PowerPoint
Return
Return

Catalog