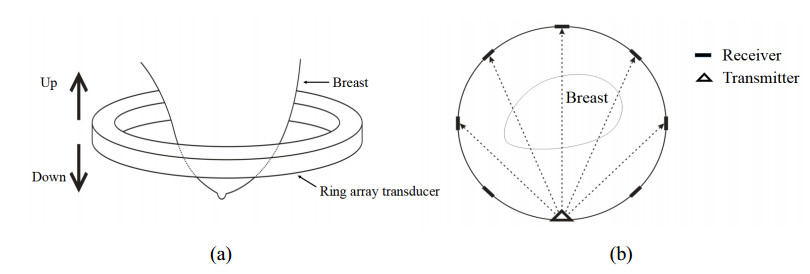
Figure 1.
Illustration of USCT: (a) front view; (b) transmitting and receiving mode.


Ultrasound computed tomography (USCT) has been developed for breast tumor screening. The sound-speed modal of USCT can provide quantitative sound-speed values to help tumor diagnosis. Time-of-flight (TOF) is the critical input in sound-speed reconstruction. However, we found that the missing data problem in the detected TOF causes artifacts on the reconstructed sound-speed images, which may affect the tumor identification. In this study, to address the missing TOF data problem, we first adopted the singular value threshold (SVT) algorithm to complete the TOF matrix. The threshold value in SVT is difficult to determine, so we proposed a selection strategy, that is, to enumerate the threshold values as the multiples of the maximum singular value of the incomplete matrix and then evaluate the image quality to select the proper threshold value. In the numerical breast phantom experiment, the artifacts are eliminated, and the accuracy is higher than the accuracy of the compared methods. In the in vivo experiment, we reconstructed the sound-speed image of the breast of a volunteer with invasive breast cancer, and the SVT algorithm improved the image sharpness. The completion of DTOF based on SVT gives better accuracy than the compared methods, but too large a threshold value decreases the accuracy. In the future, the selection method of the threshold value needs further research, and more USCT cases should be included in the experiments.
Citation: Xiaoyue Fang, Ran Zhou, Haitao Gan, Mingyue Ding, Ming Yuchi. Time-of-flight completion in ultrasound computed tomography based on the singular value threshold algorithm[J]. Mathematical Biosciences and Engineering, 2022, 19(10): 10160-10175. doi: 10.3934/mbe.2022476
| [1] | Ming Wei, Ligang Zhao, Zhijian Ye, Binbin Jing . An integrated optimization mode for multi-type aircraft flight scheduling and routing problem. Mathematical Biosciences and Engineering, 2020, 17(5): 4990-5004. doi: 10.3934/mbe.2020270 |
| [2] | Yali Ouyang, Zhuhuang Zhou, Weiwei Wu, Jin Tian, Feng Xu, Shuicai Wu, Po-Hsiang Tsui . A review of ultrasound detection methods for breast microcalcification. Mathematical Biosciences and Engineering, 2019, 16(4): 1761-1785. doi: 10.3934/mbe.2019085 |
| [3] | Bo Sun, Ming Wei, Binbin Jing . Optimal model for the aircraft arrival and departure scheduling problem with fuzzy runway incursion time. Mathematical Biosciences and Engineering, 2021, 18(5): 6724-6738. doi: 10.3934/mbe.2021334 |
| [4] | Zhenqi He, Lu Yao . Improved successive approximation control for formation flying at libration points of solar-earth system. Mathematical Biosciences and Engineering, 2021, 18(4): 4084-4100. doi: 10.3934/mbe.2021205 |
| [5] | Ming Wei, Bo Sun, Wei Wu, Binbin Jing . A multiple objective optimization model for aircraft arrival and departure scheduling on multiple runways. Mathematical Biosciences and Engineering, 2020, 17(5): 5545-5560. doi: 10.3934/mbe.2020298 |
| [6] | Yafei Li, Yuxi Liu . Multi-airport system flight slot optimization method based on absolute fairness. Mathematical Biosciences and Engineering, 2023, 20(10): 17919-17948. doi: 10.3934/mbe.2023797 |
| [7] | Salman Lari, Hossein Rajabzadeh, Mohammad Kohandel, Hyock Ju Kwon . A holistic physics-informed neural network solution for precise destruction of breast tumors using focused ultrasound on a realistic breast model. Mathematical Biosciences and Engineering, 2024, 21(10): 7337-7372. doi: 10.3934/mbe.2024323 |
| [8] | Shikai Wang, Heming Jia, Xiaoxu Peng . Modified salp swarm algorithm based multilevel thresholding for color image segmentation. Mathematical Biosciences and Engineering, 2020, 17(1): 700-724. doi: 10.3934/mbe.2020036 |
| [9] | Xiao Zou, Jintao Zhai, Shengyou Qian, Ang Li, Feng Tian, Xiaofei Cao, Runmin Wang . Improved breast ultrasound tumor classification using dual-input CNN with GAP-guided attention loss. Mathematical Biosciences and Engineering, 2023, 20(8): 15244-15264. doi: 10.3934/mbe.2023682 |
| [10] | Xi Lu, Xuedong Zhu . Automatic segmentation of breast cancer histological images based on dual-path feature extraction network. Mathematical Biosciences and Engineering, 2022, 19(11): 11137-11153. doi: 10.3934/mbe.2022519 |
Ultrasound computed tomography (USCT) has been developed for breast tumor screening. The sound-speed modal of USCT can provide quantitative sound-speed values to help tumor diagnosis. Time-of-flight (TOF) is the critical input in sound-speed reconstruction. However, we found that the missing data problem in the detected TOF causes artifacts on the reconstructed sound-speed images, which may affect the tumor identification. In this study, to address the missing TOF data problem, we first adopted the singular value threshold (SVT) algorithm to complete the TOF matrix. The threshold value in SVT is difficult to determine, so we proposed a selection strategy, that is, to enumerate the threshold values as the multiples of the maximum singular value of the incomplete matrix and then evaluate the image quality to select the proper threshold value. In the numerical breast phantom experiment, the artifacts are eliminated, and the accuracy is higher than the accuracy of the compared methods. In the in vivo experiment, we reconstructed the sound-speed image of the breast of a volunteer with invasive breast cancer, and the SVT algorithm improved the image sharpness. The completion of DTOF based on SVT gives better accuracy than the compared methods, but too large a threshold value decreases the accuracy. In the future, the selection method of the threshold value needs further research, and more USCT cases should be included in the experiments.
Ultrasound computed tomography (USCT) has been developed for breast imaging and tumor detection [1,2]. Compared to the traditional B-mode ultrasound imaging technique with a handheld transducer, USCT is an automatic system with a ring transducer or 3D transducer. USCT can provide image modes, including reflection, sound-speed and attenuation parameters [3,4]. Sound-speed imaging helps tumor diagnosis by providing quantitative sound-speed values. Usually, tumor tissues have higher sound-speed values than normal tissues [5,6]; thus, sound-speed images can better assist in breast tumor diagnosis.
A sound-speed image is reconstructed by modeling the wave propagation process, detecting the time-of-flight (TOF) and solving the inverse problem. TOF is the travel time of the ultrasound wave from the transmitter to the receiver, which is detected from the waveform. The image quality of the sound-speed image is sensitive to the detected TOF. However, the missing data problem in TOF detection brings artifacts to sound-speed images, which may disturb tumor recognition. The missing data problem in TOF detection can be caused by several reasons, such as the low signal-to-noise ratio (SNR) of the raw signals or damage to the data acquisition channels. Some efforts have been made to enhance the SNR of the raw signals [7,8] or to improve the TOF detection methods under low-SNR conditions [9,10].
In addition to solving the missing data problem by enhancing the SNR of the raw signals or improving the TOF detection methods, how to complete the TOF after detection is also a critical problem. In this paper, to address the missing data problem in TOF, the TOF matrix was completed based on the singular value threshold (SVT) algorithm [11]. Considering that the threshold value in SVT is difficult to determine, a selection strategy for the threshold value was proposed. The numerical breast phantom experiment and the in vivo experiment were conducted. The effectiveness of the completion algorithm was evaluated by reconstructing sound-speed images and calculating the accuracy.
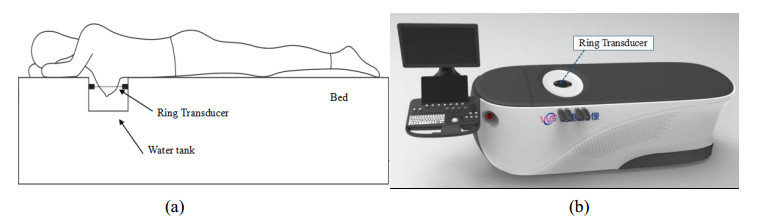
Ultrasound computed tomography (USCT) is a tomographic method that adopts ultrasound waves. USCT usually contains an automatic transducer system, and the object to be imaged (e.g., breast) is surrounded and scanned by the transducer immersed in the propagation media (usually water). Figure 1 shows a typical USCT system, which adopts a ring array transducer to acquire the slice data. When one transducer element (transmitter) is activated, all the transducer elements (receivers) receive ultrasound signals. All the transducer elements are activated in turn. Assuming that the number of transducer elements is N, then the number of signals is N2. Through the 360° distribution of the transducer array elements, the system can not only receive reflection signals but also transmission signals that are difficult to be acquired by a traditional linear array transducer. By the movement of a motor, the 3D slices are obtained. USCT has the characteristics of automation, no ionizing radiation, 3D visualization and multimodality.
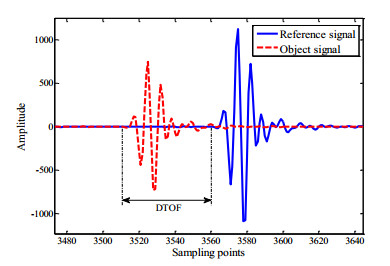
In USCT, sound-speed images are reconstructed from the transmission signals. The transmission signals are the signals received by the receivers opposite the transmitter after propagating through the breast. TOF is the arrival time of the transmission signals. At the position of the TOF in the waveform, there is a sharp rise in amplitude, which means the first arrival of the ultrasound wave. The difference of TOF (DTOF) is the time difference between the TOF at the reference signal and the object signal, which is usually used as the input for sound-speed image reconstruction. In Figure 2, the reference signal and the object signal are plotted, and DTOF is the time difference between the two signals.
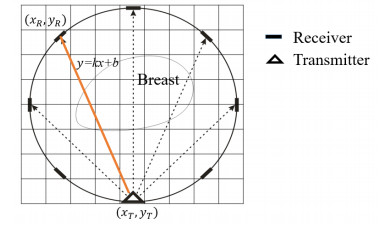
The propagation raypath of the transmission signal is formed by the following steps, as shown in Figure 3. First, the imaging area is meshed into m×m grids. Then, for one transmitter-receiver pair, a raypath equation y=kx+b is established through the coordinates of the transmitter (xT,yT) and the coordinates of the receiver (xR,yR). After the raypath equation y=kx+b is determined, the raypath length in each grid is the distance between the intersection points of the line y=kx+b and the grids. The raypath in all grids forms a 1×m2 vector. For sound-speed reconstruction, receivers in the 270° aperture opposite the transmitter are adopted. For all transmitter-receiver pairs, the dimension of the raypath matrix is (3/4)N2×m2.
After the DTOF and the raypath matrix are obtained, the sound-speed image can be reconstructed from the following formula [12]:
| LΔS=ΔT, | (1) |
where L is the raypath matrix. ΔS is the variation in slowness compared to the reference media. Slowness is the inverse of sound-speed. ΔT is the DTOF. ΔS can be obtained by solving the minimization problem:
| f=argminΔS‖LΔS−ΔT‖2+λ∑|∇(ΔS)|, | (2) |
where λ∑|∇(ΔS)| is the total variation regularization term. After ΔS is solved, the sound-speed of the breast is:
| vb=1/(Sw+ΔS), | (3) |
where Sw is the slowness of water, and vb is the sound-speed of the breast.
As shown in Equation (2), DTOF is the critical input in sound-speed reconstruction. However, for actual breast data, the DTOF may have some missing values for several reasons. For example, one reason is that the raw signals are attenuated heavily by the breast, and another reason is that there are damaged data acquisition channels. We found that the missing data problem in DTOF leads to artifacts on sound-speed images, which may disturb tumor identification. To reduce the artifacts on the sound-speed images caused by the missing data problem, we adopted the SVT algorithm as a post processing method to complete the DTOF. Considering that the suggestion for the threshold value from the original SVT algorithm was not effective, we proposed a selection strategy for the threshold value selection.
To relieve the artifacts on sound-speed images caused by the missing data problem in DTOF, we applied the SVT algorithm [11] for DTOF completion. In this study, M∈Rn1×n2 is the incomplete input matrix (i.e., the DTOF matrix before completion), and X∈Rn1×n2 is the output matrix (i.e., the DTOF matrix after completion). n1 and n2 are the dimensions of the DTOF matrix, i.e., the number of transmitters and the number of receivers. Let PΩ be the orthogonal projector on Ω; then:
| PΩ(X)={Xij,(i,j)∈Ω0,otherwise. | (4) |
The completion problem may be expressed as:
| min‖X‖∗s.t.PΩ(X)=PΩ(M). | (5) |
Dτ is the soft-threshold operator, and τ is the threshold value. Fix τ>0; then, starting with Y0=0 ∈Rn1×n2, the algorithm inductively defines:
| {Xk=Dτ(Yk−1)Yk=Yk−1+δkPΩ(M−Xk), | (6) |
until a stopping criterion is reached. For large values of τ, the sequence {Xk} converges to a similar solution of problem (5). According to the suggestions from the research [11], δk=1.2n1×n2p, where p is the number of nonzero values in the input matrix.
The singular value decomposition (SVD) of a matrix X∈Rn1×n2 of rank r is:
| X=UΣV∗,Σ=diag({σi}1≤i≤r). | (7) |
For τ>0, Dτ is defined as:
| Dτ(X):=UDτ(Σ)V∗,Dτ(Σ)=diag({σi−τ}+), | (8) |
where t+=max(0,t). Dτ applies a soft-thresholding rule to the singular values of X, effectively shrinking these singular values toward zero.
Research [11] suggests that the iterations kmax are fewer than 200 to reach a convergence. Meanwhile, the stopping criterion:
| E=||PΩ(Xk−M)||F||PΩM||F<ϵ | (9) |
is also considered, where E is the completion error, and ϵ is a small value that is determined by experience.
The threshold value τ is an important parameter in SVT. The original paper [11] suggests empirically setting τ as 5√n1×n2. By testing, we found that the suggested threshold value was not appropriate. In the SVT method, matrix completion is based on the singular values of the incomplete matrix, so we propose a strategy to select the threshold value referring to the singular values of the incomplete matrix. By the singular value composition of the matrix M of rank r0, the distribution of the singular values can be obtained:
| M=U0Σ0V0∗,Σ0=diag({σi}1≤i≤r0). | (10) |
The proposed selection strategy is to establish an association with the maximum singular value of the matrix M, which is denoted as σmax. Perform the DTOF completion and sound-speed reconstruction with τ=γ∗σmax, τ is enumerated, e.g., γ=1,2,4,8,16,32,…. Then, the completion effectiveness is evaluated to obtain a relatively effective solution.
To quantitatively evaluate the completion effectiveness, a numerical experiment and an in vivo experiment were conducted. To measure the accuracy, the residual between the sound-speed images reconstructed from the uncompleted DTOF and the completed DTOF was defined as:
| Res=||vcomplete−vcompleted||2, | (11) |
where vcomplete is the sound-speed distribution reconstructed from the original complete DTOF, and vcompleted is the sound-speed distribution reconstructed from the DTOF completed by algorithms. Res is used for the evaluation in the numerical experiment, in which the original complete DTOF is available. The definition of Res by Equation (11) excludes the influence of the image reconstruction model on the evaluation of the DTOF completion algorithms.
To evaluate the completion algorithm, a numerical phantom experiment was conducted first. The open source acoustic toolbox K-wave [13] in MATLAB (R2013a, The Mathworks, Natick, Massachusetts, United States) was used to generate the simulation data. Figure 4 shows the setup of the numerical experiment. There is a circular breast phantom with nine circular lesions inside it. The background of the phantom is set to mimic the normal breast tissue.
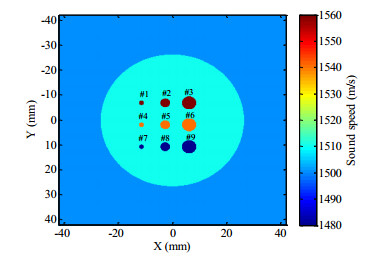
The design of the nine lesions is given in Table 1, where vd is the designed sound-speed and Dd is the designed diameter. Lesion #1 to Lesion #6 are set to mimic tumors with higher sound-speed values than normal breast tissue. Lesions #7 to #9 are set to mimic the cyst with lower sound-speed values than normal breast tissue. The diameters of the ring array transducer and the phantom are 80 mm and 60 mm, respectively. The sound-speed of water is 1500 m/s.
| Lesion #1 | Lesion #2 | Lesion #3 | Lesion #4 | Lesion #5 | Lesion #6 | Lesion #7 | Lesion #8 | Lesion #9 | |
| vd (m/s) | 1560 | 1560 | 1560 | 1540 | 1540 | 1540 | 1480 | 1480 | 1480 |
| Dd (mm) | 2 | 4 | 6 | 2 | 4 | 6 | 2 | 4 | 6 |
 DownLoad:
CSV
DownLoad:
CSV
The breast phantom is scanned by a ring array transducer immersed in water. The number of transducer elements is 512, the center frequency of the transducer is 3.0 MHz. When one transducer element transmits a signal, all the transducer elements receive signals. The number of numerical ultrasound signals is 5122. In the data generation, the wavelength is set as 0.5 mm, and five sampling points per wavelength are set to satisfy the requirement of the K-wave toolbox that at least three sampling points per wavelength.
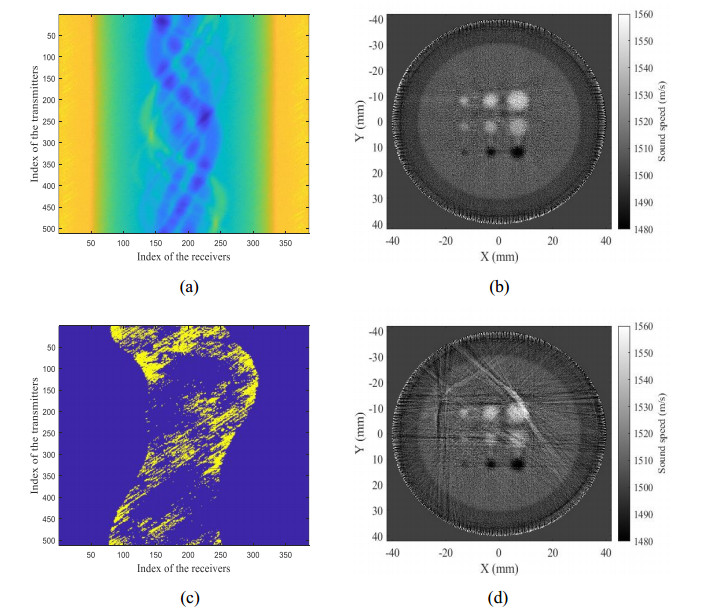
To mimic the missing data phenomenon, the detected complete DTOF matrix of the simulation data is made sparse in the coordinates proportionally to the coordinates of the missing values in the DTOF matrix of the DTOF matrix of the actual breast. The DTOF and the reconstructed sound-speed images are shown in Figure 5. We find that the sound-speed image reconstructed from the original DTOF is similar to the designed phantom model, and the image is free of artifacts. There are artifacts on the sound-speed image reconstructed from the sparse DTOF, which interfere with the revealing of the lesions. This result suggests that the missing data in DTOF causes image artifacts that interfere with tumor recognition.
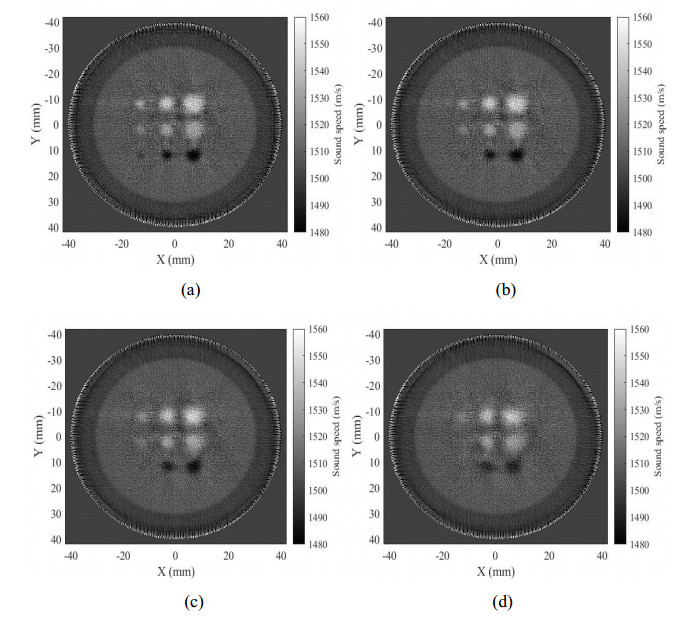
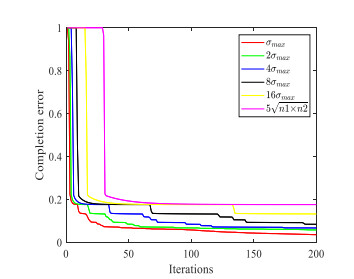
The DTOF completion by the SVT algorithm with τ=γ∗σmax and γ=1,2,4,8 was performed, and the corresponding sound-speed images were reconstructed. The results are plotted in Figure 6. γ=1 eliminates the artifacts and gives a result similar to the result of the original DTOF. However, with the increase in γ, the results show that the larger γ is, the more blurred the image. The metrics of Res for different γ values are summarized in Table 2, which shows that the accuracy decreases with increasing γ. We also plotted the completion error in Figure 7, which shows that the larger τ is, the higher the completion error. The intuitive observation, quantitative metrics of accuracy, and completion error analysis all show that too large a threshold causes degradation of image quality. An appropriate τ may eliminate the artifacts, but the artifact elimination comes at the expense of accuracy decrease.
| τ | 1∗σmax | 2∗σmax | 4∗σmax | 8∗σmax | 16∗σmax |
| Res | 132.06 | 188.83 | 239.88 | 396.15 | 903.52 |
DownLoad:
CSV
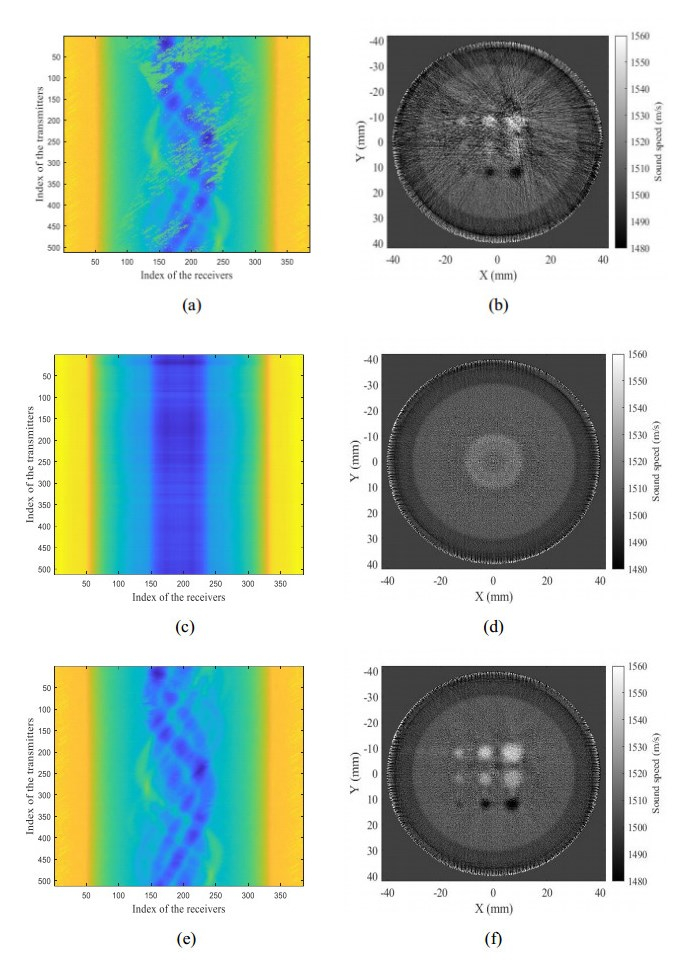
To compare the completion effectiveness, the DTOF completion by the SVT algorithm with τ=5√n1×n2 and the average-value completion method were adopted as the compared methods. The average-value completion method fills the missing values with the average-value of the incomplete DTOF matrix. The DTOF and the corresponding sound-speed images are shown in Figure 8. We find that τ=5√n1×n2 is too large for the SVT algorithm to complete DTOF in the numerical experiment, while the average-value completion method even accentuates the artifacts. By comparison, the SVT algorithm with τ=1∗σmax gives the best result.
The metrics of the sound-speed images reconstructed from the DTOF completed by different completion methods are summarized in Table 3, which shows that the SVT algorithm with τ=1∗σmax gives better accuracy than the compared methods, and enhances accuracy compared to not completing the DTOF, i.e., reconstructing from the sparse (uncompleted) DTOF.
| States/ Methods | Sparse (uncompleted) | The average-value completion | SVT, τ=5√n1×n2 | SVT, Proposed |
| Res | 495.90 | 785.87 | 1175.20 | 132.06 |
DownLoad:
CSV
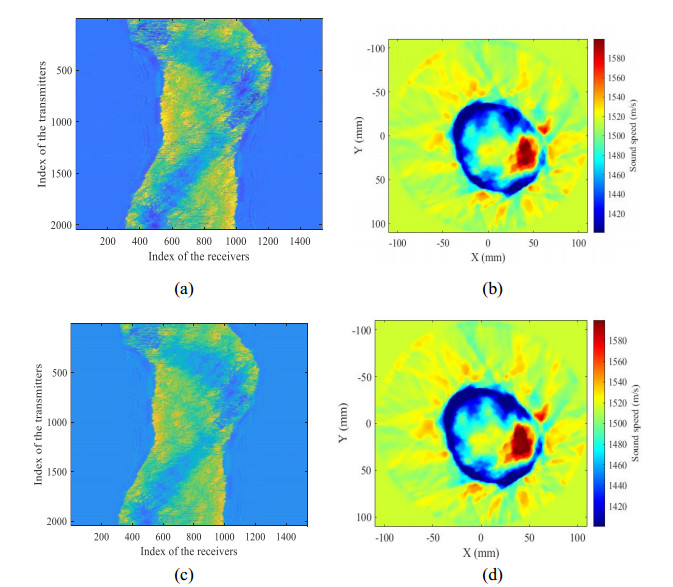
To further validate the SVT algorithm, an in vivo experiment was conducted. The USCT system [14] consists of a ring transducer, a bed and a water tank, as shown in Figure 9(a), and the volunteer is prostrate on the bed and places the breast on one side in the water tank. The center frequency of the transducer elements is 3.0 MHz, the number of transducer elements is 2048, and the radius of the ring is 110 cm. The sample frequency is 25 MHz. When one transducer element transmits a signal, all the other elements receive the signals. For the breast on one side, the data acquisition requires almost 30 seconds. Figure 9(b) shows the appearance of the experimental system.
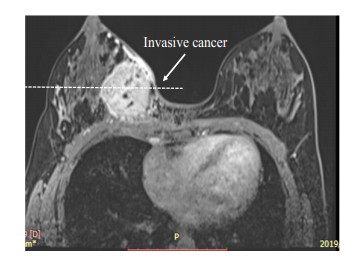
The medical ethics were approved by the Ethics Committee of Tongji Medical College, Huazhong University of Science and Technology. Informed consent was prepared and shown to the volunteer. The volunteer was 40 years old, and a substantial lesion was detected in her right breast by breast magnetic resonance imaging (MRI). The lesion was identified as invasive breast cancer by postoperative pathological examination analysis. Invasive cancer is a kind of malignant tumor in which cancer cells have penetrated the basement membrane of the ducts or lobular acinus of the breast and invaded the stroma. The MRI image of the volunteer's breast is shown in Figure 10. The highlighted lesion indicated by the arrow is invasive breast cancer.
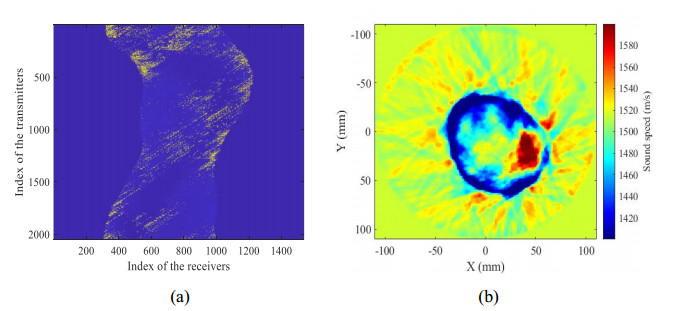
The USCT data of the volunteer were reconstructed, and the sound-speed images are shown in Figure 11. Figure 11(a) is the detected DTOF with missing data problems, and the missing values are filled by a large value for indication. Figure 11(b) is the sound-speed image reconstructed from the uncompleted DTOF. There is a tumor (red) in the lower right corner of the breast, which coincides with the MRI image. The image has some artifacts between the breast and the water, but the tumor is still visible.
To reduce the artifacts, DTOF completion by the SVT algorithm with τ=γ∗σmax and γ=1,2,4,8,16,32 was performed, and the corresponding sound-speed images were reconstructed. The results are plotted in Figure 12. γ=1,2,4 gives similar but sharper image results compared to the result of the uncompleted DTOF in Figure 11. Some distortions occur when γ=8,16,32 because the larger γ is, the higher the completion error.
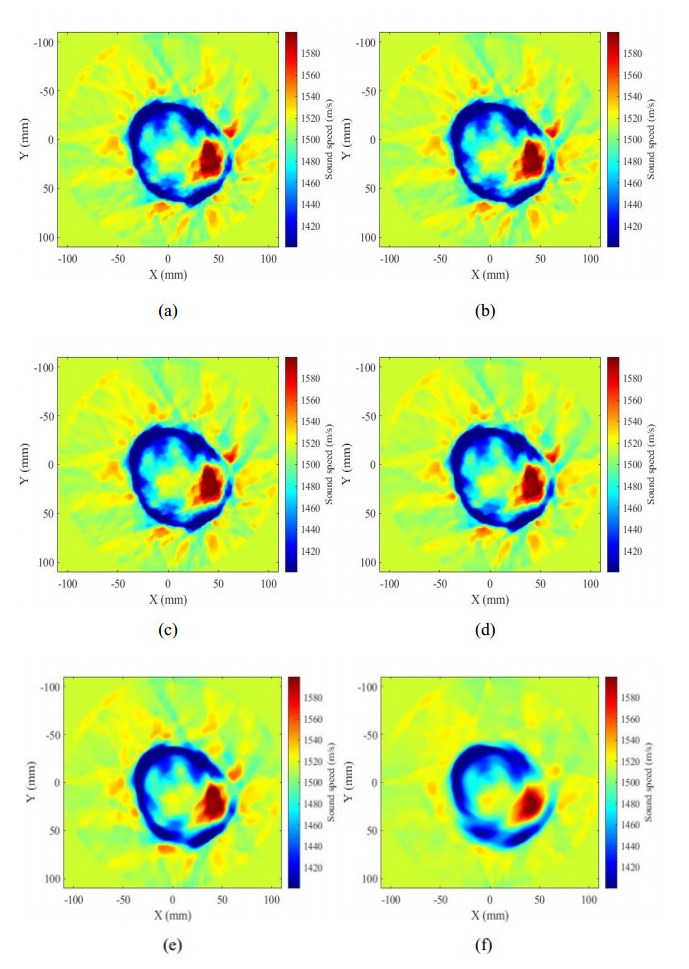
As the true distribution of the breast is unknown, the metrics of Res by different γvalues cannot be measured. Considering that a large τ may give sharp image results but can also decrease the accuracy and even introduce distortion, the selection of τ needs to be based on the actual artifacts and the requirements of the image sharpness. For this in vivo case, the SVT algorithm with γ=1,2,4,8 seems to be appropriate to provide acceptable results (Figure 12(a)–(d)).
To quantitatively measure image sharpness, the average gradient ¯g of the sound-speed image was adopted:
| ¯g=1(m−1)2∑m−1i=1∑m−1j=1√(v(i,j)−v(i+1,j))2+(v(i,j)−v(i,j+1))22, | (12) |
where m is the grid size, and v is the sound-speed distribution. To some extent, a large ¯g represents high image sharpness. Considering that some artifacts can also result in a high gradient, the average gradient ¯g was adopted as a supplement to the intuitive observation of image sharpness rather than a metric for artifact reduction.
Figure 12 shows that the SVT completion algorithm improves the image sharpness. The measurement of ¯g by the SVT algorithm with different γ values is summarized in Table 4. γ=2 gives higher image sharpness than the other γ values. Figure 13 shows the DTOF and the corresponding sound-speed images by the compared methods. The compared methods give image results similar to the result of SVT with small γ. The measurement of ¯g by different completion methods is summarized in Table 5. The SVT algorithm with τ=2∗σmax gives higher image sharpness than the compared methods and enhances image sharpness compared to not completing the DTOF, i.e., reconstructing from the sparse (uncompleted) DTOF.
| τ | 1∗σmax | 2∗σmax | 4∗σmax | 8∗σmax | 16∗σmax | 32∗σmax |
| ¯g | 0.846 | 0.847 | 0.842 | 0.813 | 0.708 | 0.520 |
DownLoad:
CSV
| States/ Methods | Sparse (uncompleted) | The average-value completion | SVT, τ=5√n1×n2 | SVT, Proposed |
| ¯g | 0.824 | 0.773 | 0.834 | 0.847 |
DownLoad:
CSV
From the numerical experiment and the in vivo experiment, we find that the SVT method with the proposed threshold selection strategy has a larger adjustment space to reduce artifacts and obtain higher accuracy and higher image sharpness. By adjusting the threshold value with the proposed strategy, the artifacts caused by missing data can be reduced, and we can maintain high image sharpness without obvious distortion.
Sound-speed images in USCT can help breast tumor diagnosis, while the missing data problem in TOF brings artifacts to the image, which may disturb the identification of tumors. To address the problem, we are the first to adopt the SVT algorithm to complete the DTOF matrix. As the threshold value of the SVT is difficult to determine, we proposed a selection strategy for the threshold value, that is, to select the threshold value by enumerating the multiples of the maximum singular values of the incomplete DTOF matrix and evaluating the completion effectiveness.
In the numerical experiment, the results show that the proposed method eliminates the artifacts and improves the accuracy compared to the other methods. However, the test also showed that too large a threshold value will decrease the accuracy. In addition, we conducted an in vivo experiment on USCT breast data from a volunteer with invasive breast cancer. The results show that the SVT algorithm with a relatively small threshold value improves the image sharpness, but too large a threshold value brings distortion. Compared to the numerical experiment, the SVT algorithm with the proposed strategy does not show a significant improvement on the image in the in vivo case, possibly because the proportion (2.4%) of missing data in the in vivo case is lower than the proportion of missing data of the numerical experiment (9.6%). The low proportion of missing data does not seem to cause severe artifacts that disturb tumor identification. However, the numerical experiment showed that the SVT algorithm with the proposed selection strategy can eliminate the artifacts caused by the high proportion of missing data.
Here, we propose a selection method to determine the threshold value of the SVT algorithm by enumeration, which can provide a feasible solution but not an optimal solution. In the future, the selection method of the threshold value needs further research, and more in vivo USCT cases should be conducted in the experiments.
This study was supported by the Doctoral Scientific Research Foundation of Hubei University of Technology [Grant Number XJ2021005701], the Fundamental Research Funds for the Central Universities [Grant Number 2018KFYXMPT012 and 2019KFYXMBZ036], the National Natural Science Foundation of China [Grant Number 82072089], and the Natural Science Foundation of Hubei Province [Grant Number 2021CFB282]. The authors would like to thank the volunteer and the doctors from Tongji Medical College of Huazhong University of Science and Technology for their generous support for this study.
The authors declare there is no conflict of interest.
| [1] |
B. Malik, E. Iuanow, J. Klock, An exploratory multi-reader, multi-case study comparing transmission ultrasound to mammography on recall rates and detection rates for breast cancer lesions, Acad. Radiol., 29 (2022), S10–S18. https://doi.org/10.1016/j.acra.2020.11.011 doi: 10.1016/j.acra.2020.11.011

|
| [2] |
J. Wiskin, B. Malik, D. Borup, N. Pirshafey, J. Klock, Full wave 3D inverse scattering transmission ultrasound tomography in the presence of high contrast, Sci. Rep-UK., 10 (2020), 20166. https://doi.org/10.1038/s41598-020-76754-3 doi: 10.1038/s41598-020-76754-3
|
| [3] | N. Duric, P. Littrup, P. Chandiwala-Mody, C. Li, S. Schmidt, L. Myc, et al., In-vivo imaging results with ultrasound tomography: report on an ongoing study at the Karmanos Cancer Institute, in Medical Imaging, Proc. SPIE, San Diego (2010). https://doi.org/10.1117/12.845646 |
| [4] | N. Duric, P. Littrup, C. Li, O. Roy, S. Schmidt, J. Seamans, et al., Whole breast tissue characterization with ultrasound tomography, in Medical Imaging, Proc. SPIE, Orlando (2015). https://doi.org/10.1117/12.2083203 |
| [5] |
Z. G. Khodr, M. A. Sak, R. M. Pfeiffer, N. Duric, P. Littrup, L. Bey-Knight, et al., Determinants of the reliability of ultrasound tomography sound speed estimates as a surrogate for volumetric breast density, Med. Phys., 42 (2015), 5671. https://doi.org/10.1118/1.4929985 doi: 10.1118/1.4929985
|
| [6] |
N. Duric, M. Sak, S. Fan, R. M. Pfeiffer, P. J. Littrup, M. S. Simon, et al., Using whole breast ultrasound tomography to improve breast cancer risk assessment: A novel risk factor based on the quantitative tissue property of sound speed, J. Clin. Med., 9 (2020), 367. https://doi.org/10.3390/jcm9020367 doi: 10.3390/jcm9020367
|
| [7] |
Y. Bao, J. Jia, Improved time-of-flight estimation method for acoustic tomography system, IEEE. T. Instrum, Meas., 99 (2019), 1–11. https://doi.org/10.1109/TIM.2019.2908704 doi: 10.1109/TIM.2019.2908704
|
| [8] |
X. Fang, J. Song, Y. Wu, Q. Zhang, M. Ding, M. Yuchi, A prior-information-based combination solution for picking the difference of time-of-flight in USCT, J. Med. Imag. Health. In., 10 (2020), 763–768. https://doi.org/10.1166/jmihi.2020.2930 doi: 10.1166/jmihi.2020.2930
|
| [9] |
P. Lasaygues, A. Arciniegas, L. Espinosa, F. Prietoc, L. Brancheriau, Accuracy of coded excitation methods for measuring the time of flight: Application to ultrasonic characterization of wood samples, Ultrasonics, 89 (2018), 178–186. https://doi.org/10.1016/j.ultras.2018.04.013 doi: 10.1016/j.ultras.2018.04.013
|
| [10] |
J. Zhou, S. Wei, R. Jintamethasawat, R. Sampson, O. Kripfgans, J. Fowlkes, et al., High-volume-rate 3-D ultrasound imaging based on synthetic aperture sequential beamforming with chirp-coded excitation, IEEE. T. Ultrason. Ferr., 65 (2018), 1346–1358. https://doi.org/10.1109/TUFFC.2018.2839085 doi: 10.1109/TUFFC.2018.2839085
|
| [11] |
J. Cai, E. Candes, Z. Shen, A singular value thresholding algorithm for matrix completion, SIAM. J. Optimiz., 20 (2018), 1956–1982. https://doi.org/10.1137/080738970 doi: 10.1137/080738970
|
| [12] |
C. Li, N. Duric, P. Littrup, L. Huang, In vivo breast sound-speed imaging with ultrasound tomography, Ultrasound. Med. Biol., 35 (2009), 1615–1628. https://doi.org/10.1016/j.ultrasmedbio.2009.05.011 doi: 10.1016/j.ultrasmedbio.2009.05.011
|
| [13] |
B. Treeby, J. Jaros, A. Rendell, B. Cox, Modeling nonlinear ultrasound propagation in heterogeneous media with power law absorption using a k-space pseudospectral method, J. Acoust. Soc. Am., 131 (2012), 4324–4336. https://doi.org/10.1121/1.4712021 doi: 10.1121/1.4712021
|
| [14] |
J. Song, Q. Zhang, L. Zhou, Z. Quan, S. Wang, Z. Liu, et al., Design and implementation of a modular and scalable research platform for ultrasound computed tomography, IEEE. T. Ultrason. Ferr., 69 (2022), 62–72. https://doi.org/10.1109/TUFFC.2021.3105691 doi: 10.1109/TUFFC.2021.3105691
|
| 1. | Wei, MD Cong, Zhang, PhD Hui, Ying, MD Tao, Hu, MD Bing, Chen, MD Yini, Li, MD Hongtao, Zhang, PhD Qiude, Ding, PhD Mingyue, Chen, MD Jie, Yuchi, PhD Ming, Zheng, MD Yuanyi, Clinical Application of Ultrasound Tomography in Diagnosis of Musculoskeletal Diseases, 2024, 8, 2576-2516, 7, 10.37015/AUDT.2024.230060 | |
| 2. | Kexin Gan, Xiaoyi Jiang, Qinghong Shen, Jie Yuan, Ying Chen, Yun Ge, Yuxin Wang, Multi-angle speed-of-sound imaging with sparse sampling to characterize medical tissue properties, 2024, 144, 0041624X, 107450, 10.1016/j.ultras.2024.107450 |
Xiaoyue Fang, Ran Zhou, Haitao Gan, Mingyue Ding, Ming Yuchi. Time-of-flight completion in ultrasound computed tomography based on the singular value threshold algorithm[J]. Mathematical Biosciences and Engineering, 2022, 19(10): 10160-10175. doi: 10.3934/mbe.2022476

| Lesion #1 | Lesion #2 | Lesion #3 | Lesion #4 | Lesion #5 | Lesion #6 | Lesion #7 | Lesion #8 | Lesion #9 | |
| vd (m/s) | 1560 | 1560 | 1560 | 1540 | 1540 | 1540 | 1480 | 1480 | 1480 |
| Dd (mm) | 2 | 4 | 6 | 2 | 4 | 6 | 2 | 4 | 6 |
DownLoad:
CSV
| τ | 1∗σmax | 2∗σmax | 4∗σmax | 8∗σmax | 16∗σmax |
| Res | 132.06 | 188.83 | 239.88 | 396.15 | 903.52 |
DownLoad:
CSV
| States/ Methods | Sparse (uncompleted) | The average-value completion | SVT, τ=5√n1×n2 | SVT, Proposed |
| Res | 495.90 | 785.87 | 1175.20 | 132.06 |
DownLoad:
CSV
| τ | 1∗σmax | 2∗σmax | 4∗σmax | 8∗σmax | 16∗σmax | 32∗σmax |
| ¯g | 0.846 | 0.847 | 0.842 | 0.813 | 0.708 | 0.520 |
DownLoad:
CSV
| States/ Methods | Sparse (uncompleted) | The average-value completion | SVT, τ=5√n1×n2 | SVT, Proposed |
| ¯g | 0.824 | 0.773 | 0.834 | 0.847 |
DownLoad:
CSV
| Lesion #1 | Lesion #2 | Lesion #3 | Lesion #4 | Lesion #5 | Lesion #6 | Lesion #7 | Lesion #8 | Lesion #9 | |
| vd (m/s) | 1560 | 1560 | 1560 | 1540 | 1540 | 1540 | 1480 | 1480 | 1480 |
| Dd (mm) | 2 | 4 | 6 | 2 | 4 | 6 | 2 | 4 | 6 |
| τ | 1∗σmax | 2∗σmax | 4∗σmax | 8∗σmax | 16∗σmax |
| Res | 132.06 | 188.83 | 239.88 | 396.15 | 903.52 |
| States/ Methods | Sparse (uncompleted) | The average-value completion | SVT, τ=5√n1×n2 | SVT, Proposed |
| Res | 495.90 | 785.87 | 1175.20 | 132.06 |
| τ | 1∗σmax | 2∗σmax | 4∗σmax | 8∗σmax | 16∗σmax | 32∗σmax |
| ¯g | 0.846 | 0.847 | 0.842 | 0.813 | 0.708 | 0.520 |
| States/ Methods | Sparse (uncompleted) | The average-value completion | SVT, τ=5√n1×n2 | SVT, Proposed |
| ¯g | 0.824 | 0.773 | 0.834 | 0.847 |

