Community detection is a complex and meaningful process, which plays an important role in studying the characteristics of complex networks. In recent years, the discovery and analysis of community structures in complex networks has attracted the attention of many scholars, and many community discovery algorithms have been proposed. Many existing algorithms are only suitable for small-scale data, not for large-scale data, so it is necessary to establish a stable and efficient label propagation algorithm to deal with massive data and complex social networks. In this paper, we propose a novel label propagation algorithm, called WRWPLPA (Parallel Label Propagation Algorithm based on Weight and Random Walk). WRWPLPA proposes a new similarity calculation method combining weights and random walks. It uses weights and similarities to update labels in the process of label propagation, improving the accuracy and stability of community detection. First, weight is calculated by combining the neighborhood index and the position index, and the weight is used to distinguish the importance of the nodes in the network. Then, use random walk strategy to describe the similarity between nodes, and the label of nodes are updated by combining the weight and similarity. Finally, parallel propagation is comprehensively proposed to utilize label probability efficiently. Experiment results on artificial network datasets and real network datasets show that our algorithm has improved accuracy and stability compared with other label propagation algorithms.
Citation: Meili Tang, Qian Pan, Yurong Qian, Yuan Tian, Najla Al-Nabhan, Xin Wang. Parallel label propagation algorithm based on weight and random walk[J]. Mathematical Biosciences and Engineering, 2021, 18(2): 1609-1628. doi: 10.3934/mbe.2021083
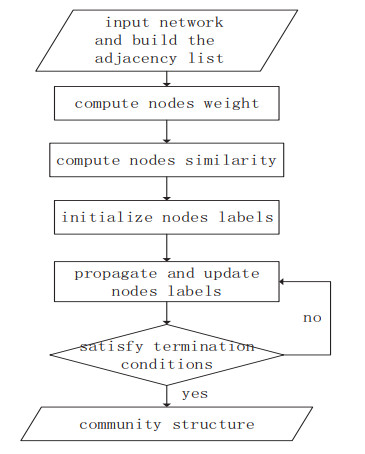
Community detection is a complex and meaningful process, which plays an important role in studying the characteristics of complex networks. In recent years, the discovery and analysis of community structures in complex networks has attracted the attention of many scholars, and many community discovery algorithms have been proposed. Many existing algorithms are only suitable for small-scale data, not for large-scale data, so it is necessary to establish a stable and efficient label propagation algorithm to deal with massive data and complex social networks. In this paper, we propose a novel label propagation algorithm, called WRWPLPA (Parallel Label Propagation Algorithm based on Weight and Random Walk). WRWPLPA proposes a new similarity calculation method combining weights and random walks. It uses weights and similarities to update labels in the process of label propagation, improving the accuracy and stability of community detection. First, weight is calculated by combining the neighborhood index and the position index, and the weight is used to distinguish the importance of the nodes in the network. Then, use random walk strategy to describe the similarity between nodes, and the label of nodes are updated by combining the weight and similarity. Finally, parallel propagation is comprehensively proposed to utilize label probability efficiently. Experiment results on artificial network datasets and real network datasets show that our algorithm has improved accuracy and stability compared with other label propagation algorithms.

| [1] |
T. Ma, Y. Zhao, H. Zhou, Y. Tian, A. A. Dhelaan, M. Al-Rodhaan, Natural disaster topic extraction in sina microblogging based on graph analysis, Expert Syst. Appl., 115 (2019), 346–355. doi: 10.1016/j.eswa.2018.08.010

|
| [2] |
H. Rong, T. Ma, J. Cao, Y. Tian, A. A. Dhelaan, M. Al-Rodhaan, Deep rolling: A novel emotion prediction model for a multi-participant communication context, Inf. Sci., 488 (2019), 158–180. doi: 10.1016/j.ins.2019.03.023
|
| [3] |
J. Wu, Z. Chen, M. Zhao, An efficient data packet iteration and transmission algorithm in opportunistic social networks, J. Ambient Intell. Humanized Comput., 11 (2020), 3141–3153. doi: 10.1007/s12652-019-01480-2
|
| [4] | T. Ma, H. Rong, Y. Hao, J. Cao, Y. Tian, M. Al-Rodhaan, A novel sentiment polarity detection framework for chinese, IEEE Trans. Affective Comput., 2019 (2019). |
| [5] |
H. T. Nguyen, A. Cano, T. Vu, T. N. Dinh, Blocking self-avoiding walks stops cyber-epidemics: a scalable gpu-based approach, IEEE Trans. Knowl. Data Eng., 32 (2020), 1263–1275. doi: 10.1109/TKDE.2019.2904969
|
| [6] | C. Su, Y. K. Wang, Y. Yu, Community detection in social networks, Trans Tech Publications Ltd, 2014. |
| [7] | R. Kishore, S. Swayamjyoti, S. Das, A. K. Gogineni, Z. Nussinov, D. Solenov, et al., Visual machine learning: Insight through eigenvectors, chladni patterns and community detection in 2d particulate structures, arXiv preprint arXiv: 2001.00345, 2020. |
| [8] |
K. Liu, Z. Chen, J. Wu, Y. Xiao, H. Zhang, Predict and forward: An efficient routing-delivery scheme based on node profile in opportunistic networks, Future Int., 10 (2018), 74. doi: 10.3390/fi10080074
|
| [9] | M. Alsenwi, K. Kim, C. S. Hong, Radio resource allocation in 5g new radio: A neural networks based approach, arXiv preprint arXiv: 1911.05294, 2019. |
| [10] | Y. Kang, B. Yu, W. Wang, D. Meng, Spectral clustering for large-scale social networks via a pre-coarsening sampling based nystrÖm method, Pacific-asia Conference on Knowledge Discovery & Data Mining, 2015. |
| [11] | D. Cheng, Q. Zhu, Q. Wu, A local cores-based hierarchical clustering algorithm for data sets with complex structures, 2018 IEEE 42nd Annual Computer Software and Applications Conference (COMPSAC), 2018. |
| [12] |
J. Wu, L. Zhang, Y. Li, Y. Jiao, Partition signed social networks via clustering dynamics, Phys. A, 443 (2016), 568–582. doi: 10.1016/j.physa.2015.09.066
|
| [13] |
T. P. Q. Nguyen, R. Kuo, Partition-and-merge based fuzzy genetic clustering algorithm for categorical data, Appl. Soft Comput., 75 (2019), 254–264. doi: 10.1016/j.asoc.2018.11.028
|
| [14] |
M. E. J. Newman, Finding community structure in networks using the eigenvectors of matrices, Phys. Rev. E, 74 (2006), 036104. doi: 10.1103/PhysRevE.74.036104
|
| [15] |
M. E. Newman, Fast algorithm for detecting community structure in networks, Phys. Rev. E, 69 (2004), 066133. doi: 10.1103/PhysRevE.69.066133
|
| [16] |
R. Guimera, M. Sales-Pardo, L. A. N. Amaral, Modularity from fluctuations in random graphs and complex networks, Phys. Rev. E, 70 (2004), 025101. doi: 10.1103/PhysRevE.70.025101
|
| [17] |
J. Duch, A. Alex, Community detection in complex networks using extremal optimization, Phys. Rev. E, 72 (2005), 027104. doi: 10.1103/PhysRevE.72.027104
|
| [18] |
L. Donetti, M. A. Munoz, Detecting network communities: a new systematic and efficient algorithm, J. Stat. Mech. Theory Exp., 2004 (2004), P10012. doi: 10.1088/1742-5468/2004/10/P10012
|
| [19] | S. Gregory, An algorithm to find overlapping community structure in networks, in European Conference on Principles & Practice of Knowledge Discovery in Databases, 2007. |
| [20] | S. Gregory, A fast algorithm to find overlapping communities in networks, Joint European Conference on Machine Learning and Knowledge Discovery in Databases, Springer, 2008. |
| [21] |
P. Schuetz, A. Caflisch, Multistep greedy algorithm identifies community structure in real-world and computer-generated networks, Phys. Rev. E, 78 (2008), 026112. doi: 10.1103/PhysRevE.78.026112
|
| [22] |
F. Hu, J. Liu, L. Li, J. Liang, Community detection in complex networks using node2vec with spectral clustering, Phys. A, 545 (2020), 123633. doi: 10.1016/j.physa.2019.123633
|
| [23] |
G. Palla, I. Derényi, I. Farkas, T. Vicsek, Uncovering the overlapping community structure of complex networks in nature and society, Nature, 435 (2005), 814–818. doi: 10.1038/nature03607
|
| [24] |
J. M. Kumpula, K. Mikko, K. Kimmo, S. K. Jari, Sequential algorithm for fast clique percolation, Phys. Rev. E, 78 (2008), 026109. doi: 10.1103/PhysRevE.78.026109
|
| [25] |
R. Usha Nandini, A. Réka, K. Soundar, Near linear time algorithm to detect community structures in large-scale networks, Phys. Rev. E, 76 (2007), 036106. doi: 10.1103/PhysRevE.76.036106
|
| [26] | I. X. Y. Leung, H. Pan, L. Pietro, C. Jon, Towards real-time community detection in large networks, Phys. Rev. E, 79 (2007), 066107. |
| [27] | J. Xie, S. Kelley, B. K. Szymanski, Overlapping community detection in networks: the state of the art and comparative study, Acm Comput. Surv., 45, (2013), 43. |
| [28] |
T. Ma, W. Shao, Y. Hao, J. Cao, Graph classification based on graph set reconstruction and graph kernel feature reduction, Neurocomputing, 296 (2018), 33–45. doi: 10.1016/j.neucom.2018.03.029
|
| [29] |
S. Gregory, Finding overlapping communities in networks by label propagation, New J. Phys., 12 (2010), 103018. doi: 10.1088/1367-2630/12/10/103018
|
| [30] |
Z. H. Wu, Y. F. Lin, S. Gregory, H. Y. Wan, S. F. Tian, Balanced multi-label propagation for overlapping community detection in social networks, J. Comput. Sci. Technol., 27 (2012), 468–479. doi: 10.1007/s11390-012-1236-x
|
| [31] |
T. Ma, Y. Wang, M. Tang, C. Jie, T. Yuan, A. Al-Dhelaan, M. Al-Rodhaan, Led: A fast overlapping communities detection algorithm based on structural clustering, Neurocomputing, 207 (2016), 488–500. doi: 10.1016/j.neucom.2016.05.020
|
| [32] |
T. Ma, Q. Liu, J. Cao, Y. Tian, A. Al-Dhelaan, MznahAl-Rodhaan, Lgiem: Global and local node influence based community detection, Future Gener. Comput. Syst., 105 (2020), 533–546. doi: 10.1016/j.future.2019.12.022
|
| [33] |
T. Ma, Q. Pan, H. Wang, W. Shao, Y. Tian, N. Al-Nabhan, Graph classification algorithm based on graph structure embedding, Expert Syst. Appl., 161 (2020), 113715. doi: 10.1016/j.eswa.2020.113715
|
| [34] |
I. Ben El Kouni, W. Karoui, L. B. Romdhane, Node importance based label propagation algorithm for overlapping community detection in networks, Expert Syst. Appl., 162 (2020), 113020. doi: 10.1016/j.eswa.2019.113020
|
| [35] |
Y. Lv, T. Ma, M. Tang, J. Cao, Y. Tian, A. Al-Dhelaan, MznahAl-Rodhaan, An efficient and scalable density-based clustering algorithm for datasets with complex structures, Neurocomputing, 171 (2016), 9–22. doi: 10.1016/j.neucom.2015.05.109
|
| [36] |
T. Ma, H. Wang, L. Zhang, Y. Tian, N. Al-Nabhan, Graph classification based on structural features of significant nodes and spatial convolutional neural networks, Neurocomputing, 423 (2021), 639–650. doi: 10.1016/j.neucom.2020.10.060
|
| [37] | K. Lei, B. Zhang, Y. Liu, Y. Deng, D. Zhang, Y. Shen, A knowledge graph based solution for entity discovery and linking in open-domain questions, International Conference on Smart Computing and Communication, 2017. |
| [38] |
Z. Liu, M. Barahona, Graph-based data clustering via multiscale community detection, Appl. Network Sci., 5 (2020), 1–20. doi: 10.1007/s41109-019-0247-8
|
| [39] | J. Li, H. Zhang, Z. Han, Y. Rong, H. Cheng, J. Huang, Adversarial attack on community detection by hiding individuals, WWW '20: Proceedings of The Web Conference, 2020. |
| [40] |
Y. Zhang, Y. Liu, R. Jin, J. Tao, L. Chen, X. Wu, Gllpa: A graph layout based label propagation algorithm for community detection, Knowl. Based Syst., 206 (2020), 106363. doi: 10.1016/j.knosys.2020.106363
|
| [41] |
Y. Zhang, Y. Liu, Q. Li, R. Jin, C. Wen, Lilpa: A label importance based label propagation algorithm for community detection with application to core drug discovery, Neurocomputing, 413 (2020), 107–133. doi: 10.1016/j.neucom.2020.06.088
|
| [42] | Graphx programming guide, 2020. Available from: http://spark.apache.org/docs/latest/graphx-programming-guide.html#graph-algorithms. |
| [43] | A. Bandyopadhyay, O. Zeitouni, Random walk in dynamic markovian random environment, arXiv preprint math/0509066, 2005. |
| [44] |
W. Liu, L. Lü, Link prediction based on local random walk, EPL, 89 (2010), 58007. doi: 10.1209/0295-5075/89/58007
|
| [45] |
P. Hanggi, P. Talkner, First-passage time problems for non-markovian processes, Phys. Rev. A, 32 (1985), 1934–1937. doi: 10.1103/PhysRevA.32.1934
|
| [46] |
X.-K. Zhang, C. Song, J. Jia, Z.-L. Lu, Q. Zhang, An improved label propagation algorithm based on the similarity matrix using random walk, Int. J. Mod. Phys. B, 30 (2016), 1650093. doi: 10.1142/S0217979216500934
|
| [47] |
W. W. Zachary, An information flow model for conflict and fission in small groups, J. Anthropological Res., 33 (1977), 452–473. doi: 10.1086/jar.33.4.3629752
|
| [48] |
W. Li, C. Huang, M. Wang, X. Chen, Stepping community detection algorithm based on label propagation and similarity, Phys. A, 472 (2017), 145–155. doi: 10.1016/j.physa.2017.01.030
|
| [49] |
D. Lusseau, K. Schneider, O. J. Boisseau, P. Haase, E. Slooten, S. M. Dawson, The bottlenose dolphin community of doubtful sound features a large proportion of long-lasting associations, Behav. Ecol. Sociobiology, 54 (2003), 396–405. doi: 10.1007/s00265-003-0651-y
|
| [50] | X. K. Zhang, S. Fei, C. Song, X. Tian, Y. Y. Ao, Label propagation algorithm based on local cycles for community detection, Int. J. Mod. Phys. B, 29 (2015), 1550029, 2015. |
| [51] | T. Ma, Z. Xia, An improved label propagation algorithm based on node importance and random walk for community detection, Mod. Phys. Lett. B, 31 (2017), 1750162. |
| [52] |
A. Lancichinetti, S. Fortunato, F. Radicchi, Benchmark graphs for testing community detection algorithms, Phys. Rev. E, 78 (2008), 046110. doi: 10.1103/PhysRevE.78.046110
|


Figures(7) / Tables(2)

Meili Tang, Qian Pan, Yurong Qian, Yuan Tian, Najla Al-Nabhan, Xin Wang. Parallel label propagation algorithm based on weight and random walk[J]. Mathematical Biosciences and Engineering, 2021, 18(2): 1609-1628. doi: 10.3934/mbe.2021083


 DownLoad: