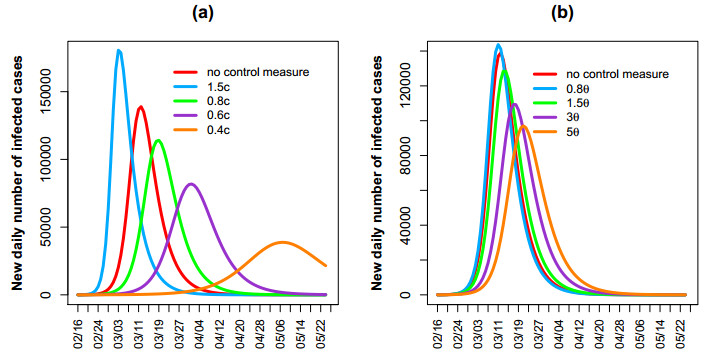
Based on the reported data from February 16, 2020 to March 9, 2020 in South Korea including confirmed cases, death cases and recovery cases, the control reproduction number was estimated respectively at different control measure phases using Markov chain Monte Carlo method and presented using the resulting posterior mean and 95% credible interval (CrI). At the early phase from February 16 to February 24, we estimate the basic reproduction number R0 of COVID-19 to be 4.79(95% CrI 4.38 - 5.2). The estimated control reproduction number dropped rapidly to Rc ≈ 0.32(95% CrI 0.19 - 0.47) at the second phase from February 25 to March 2 because of the voluntary lockdown measures. At the third phase from March 3 to March 9, we estimate Rc to be 0.27 (95% CrI 0.14 - 0.42). We predict that the final size of the COVID-19 outbreak in South Korea is 9661 (95% CrI 8660 - 11100) and the whole epidemic will be over by late April. It is found that reducing contact rate and enhancing the testing speed will have the impact on the peak value and the peak time.
Citation: Xiaomei Feng, Jing Chen, Kai Wang, Lei Wang, Fengqin Zhang, Zhen Jin, Lan Zou, Xia Wang. Phase-adjusted estimation of the COVID-19 outbreak in South Korea under multi-source data and adjustment measures: a modelling study[J]. Mathematical Biosciences and Engineering, 2020, 17(4): 3637-3648. doi: 10.3934/mbe.2020205
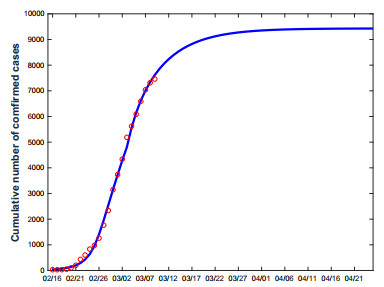
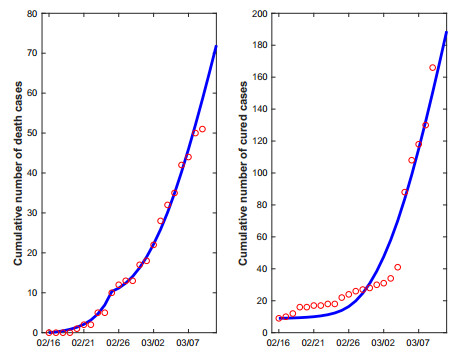
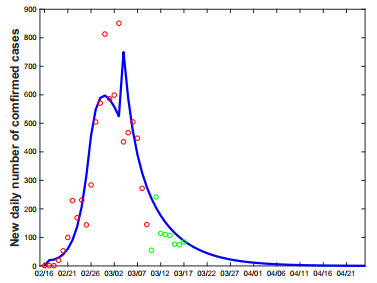
Based on the reported data from February 16, 2020 to March 9, 2020 in South Korea including confirmed cases, death cases and recovery cases, the control reproduction number was estimated respectively at different control measure phases using Markov chain Monte Carlo method and presented using the resulting posterior mean and 95% credible interval (CrI). At the early phase from February 16 to February 24, we estimate the basic reproduction number R0 of COVID-19 to be 4.79(95% CrI 4.38 - 5.2). The estimated control reproduction number dropped rapidly to Rc ≈ 0.32(95% CrI 0.19 - 0.47) at the second phase from February 25 to March 2 because of the voluntary lockdown measures. At the third phase from March 3 to March 9, we estimate Rc to be 0.27 (95% CrI 0.14 - 0.42). We predict that the final size of the COVID-19 outbreak in South Korea is 9661 (95% CrI 8660 - 11100) and the whole epidemic will be over by late April. It is found that reducing contact rate and enhancing the testing speed will have the impact on the peak value and the peak time.

| [1] | World Health Organization, Coronavirus Disease 2019 (COVID-19) Situation Report-62, 2020. Available from: https://www.who.int/docs/default-source/coronaviruse/situation-reports/20200322-sitrep-62-covid-19.pdf?sfvrsn=755c76cd_2. |
| [2] | 4212 Cases of COVID-19 were Confirmed in South Korea, 2020. Available from: http://www.chinanews.com/gj/2020/03-02/9110460.shtml. |
| [3] |
J. T. Wu, K. Leung, G. M. Leung, Nowcasting and forecasting the potential domestic and international spread of the 2019-nCoV outbreak originating in Wuhan, China: a modelling study, Lancet., 395 (2020), 689–697. doi: 10.1016/S0140-6736(20)30260-9

|
| [4] |
H. Nishiura, T. Kobayashi, Y. Yang, K. Hayashi, T. Miyama, R. Kinoshita, et al., The Rate of Underascertainment of Novel Coronavirus (2019-nCoV) Infection: Estimation Using Japanese Passengers Data on Evacuation Flights, J. Clin. Med., 9 (2020), E419. doi: 10.3390/jcm9020419
|
| [5] |
S. Zhao, S. S. Musa, Q. Lin, J. Ran, G. Yang, W. Wang, et al., Estimating the Unreported Number of Novel Coronavirus 2019-nCoV Cases in China in the First Half of January 2020: A Data-Driven Modelling Analysis of the Early Outbreak, J. Clin. Med., 9 (2020), E388. doi: 10.3390/jcm9020388
|
| [6] |
B. Tang, X. Wang, Q. Li, N. Bragazzi, S. Tang, Y. Xiao, et al., Estimation of the Transmission Risk of the 2019-nCoV and Its Implication for Public Health Interventions, J. Clin. Med., 9 (2020), E462. doi: 10.3390/jcm9020462
|
| [7] | B. Tang, N. L. Bragazzi, Q. Li, S. Tang, Y. Xiao, J. Wu, An updated estimation of the risk of transmission of the novel coronavirus (2019-nCov), Infect. Dis. Model., 5 (2020), 248–255. |
| [8] | H. Wang, Z. Wang, Y. Dong, Phase-adjusted estimation of the number of Coronavirus Disease 2019 cases in Wuhan, China, Cell Discov., 6 (2020), 10. |
| [9] |
H. Nishiura, Backcalculating the Incidence of Infection with COVID-19 on the Diamond Princess, J. Clin. Med., 9 (2020), 657. doi: 10.3390/jcm9030657
|
| [10] |
S. Zhang, M. Diao, W. Yu, L. Pei, Z. Lin, D. Chen, Estimation of the reproductive number of Novel Coronavirus (COVID-19) and the probable outbreak size on the Diamond Princess cruise ship: A data-driven analysis, Int. J. Infect. Dis., 93 (2020), 201–204. doi: 10.1016/j.ijid.2020.02.033
|
| [11] | Korea Centers for Disease Control and Prevention, The Updates on COVID-19 in Korea as of 23 March, 2020. Available from: https://www.cdc.go.kr/board/board.es?mid=a30402000000&bid=0030. |
| [12] |
P. van den Driessche, J. Watmough, Reproduction numbers and sub-threshold endemic equilibria for compartmental models of disease transmission, Math. Biosci., 180 (2002), 29–48. doi: 10.1016/S0025-5564(02)00108-6
|
| [13] |
S. Tang, Y. Xiao, Y. Yang, Y. Zhou, J. Wu, Z. Ma, Community-based measures for mitigating the 2009 H1N1 pandemic in China, PLoS ONE, 5 (2010), e10911. doi: 10.1371/journal.pone.0010911
|
| [14] | South Korea will Lockdown the Outbreak Site, 2020. Available from: http://m.hxnews.com/news/gj/gjxw/202002/25/jrtt_1864240.shtml. |
| [15] | The 20-minute Rapid Test is Ready for Use, 2020. Available from: https://www.fx168.com/fx168_t/2003/3661336.shtml. |
| [16] | Global Oubreak Express, 2020. Available from: http://dsj.voc.com.cn/article/202003/202003031637117028.html. |
| [17] |
Q. Li, X. Guan, P. Wu, X. Wang, L. Zhou, Y. Tong, et al., Early Transmission Dynamics in Wuhan, China, of Novel Coronavirus-infected Pneumonia, N. Engl. J. Med., 382 (2020), 1199–1207. doi: 10.1056/NEJMoa2001316
|
| [18] | Special Expert Group for Control of the Epidemic of Novel Coronavirus Pneumonia of the Chinese Preventive Medicine Association, An update on the epidemiological characteristics of novel coronavirus pneumonia (COVID-19), Chin. J. Epidemiol., 41 (2020), 139–144. |
| [19] |
N. M. Linton, T. Kobayashi, Y. Yang, Incubation Period and Other Epidemiological Characteristics of 2019 Novel Coronavirus Infections with Right Truncation: A Statistical Analysis of Publicly Available Case Data, J. Clin. Med., 9 (2020), 538. doi: 10.3390/jcm9020538
|
| [20] |
W. Guan, Z. Ni, Y. Hu, W. Liang, C. Ou, J. He, et al., Clinical Characteristics of Coronavirus Disease 2019 in China, N. Engl. J. Med., 382 (2020), 1708–1720. doi: 10.1056/NEJMoa2002032
|
| [21] | More than Half of the Patients in Daegu City Cannot be Admitted to Hospital, 2020. Available from: http://news.sina.com.cn/w/2020-02-28/doc-iimxyqvz6555731.shtml. |
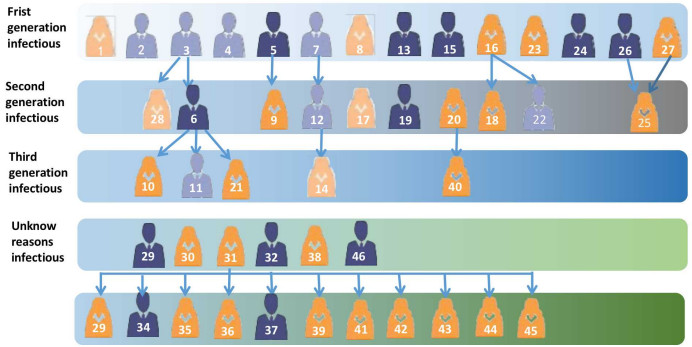
| [22] | Summary of the Movement Paths of all Confirmed Patients in South Korea (update to Case ID 82), 2020. Available from: http://bbs.icnkr.com/thread-6808192-1-1.html. |

Figures(6) / Tables(2)

Xiaomei Feng, Jing Chen, Kai Wang, Lei Wang, Fengqin Zhang, Zhen Jin, Lan Zou, Xia Wang. Phase-adjusted estimation of the COVID-19 outbreak in South Korea under multi-source data and adjustment measures: a modelling study[J]. Mathematical Biosciences and Engineering, 2020, 17(4): 3637-3648. doi: 10.3934/mbe.2020205


 DownLoad: