Processing math: 100%
Research article Special Issues

Sample entropy and surrogate data analysis for Alzheimer’s disease

  • Alzheimer's disease (AD) is a neurological degenerative disease, which is mainly characterized by the memory loss. As electroencephalogram (EEG) device is relatively cheap, portable and non-invasive, it has been widely used in AD-related studies. We proposed a method to detect the differences between healthy subjects and AD patients, which combines classical sample entropy (SampEn) and surrogate data method. EEGs from 14 AD patients and 20 healthy subjects were analyzed. The results based on the original data showed that the SampEn of AD patients was significantly decreased (p<0.01) at electrodes c3, f3, o2 and p4, which confirmed that AD could cause complexity loss. However, using original data could be subject to human judgement, so we generated a series of surrogate data. We found that, there were significant difference of SampEn between the original time series and their surrogate data at c3 and o2 electrodes and the differences between healthy subjects and AD patients can be verified. Our method is capable of distinguishing AD patients from healthy subjects, which is consistent with the concept of physiologic complexity, and providing insights for understanding of AD.

    Citation: Xuewei Wang, Xiaohu Zhao, Fei Li, Qiang Lin, Zhenghui Hu. Sample entropy and surrogate data analysis for Alzheimer’s disease[J]. Mathematical Biosciences and Engineering, 2019, 16(6): 6892-6906. doi: 10.3934/mbe.2019345

    Related Papers:

    [1] Wei Yin, Tao Yang, GuangYu Wan, Xiong Zhou . Identification of image genetic biomarkers of Alzheimer's disease by orthogonal structured sparse canonical correlation analysis based on a diagnostic information fusion. Mathematical Biosciences and Engineering, 2023, 20(9): 16648-16662. doi: 10.3934/mbe.2023741
    [2] David Cuesta-Frau, Pau Miró-Martínez, Sandra Oltra-Crespo, Antonio Molina-Picó, Pradeepa H. Dakappa, Chakrapani Mahabala, Borja Vargas, Paula González . Classification of fever patterns using a single extracted entropy feature: A feasibility study based on Sample Entropy. Mathematical Biosciences and Engineering, 2020, 17(1): 235-249. doi: 10.3934/mbe.2020013
    [3] Xiaoke Li, Qingyu Yang, Yang Wang, Xinyu Han, Yang Cao, Lei Fan, Jun Ma . Development of surrogate models in reliability-based design optimization: A review. Mathematical Biosciences and Engineering, 2021, 18(5): 6386-6409. doi: 10.3934/mbe.2021317
    [4] Erik M. Bollt, Joseph D. Skufca, Stephen J . McGregor . Control entropy: A complexity measure for nonstationary signals. Mathematical Biosciences and Engineering, 2009, 6(1): 1-25. doi: 10.3934/mbe.2009.6.1
    [5] Enas Abdulhay, Maha Alafeef, Hikmat Hadoush, V. Venkataraman, N. Arunkumar . EMD-based analysis of complexity with dissociated EEG amplitude and frequency information: a data-driven robust tool -for Autism diagnosis- compared to multi-scale entropy approach. Mathematical Biosciences and Engineering, 2022, 19(5): 5031-5054. doi: 10.3934/mbe.2022235
    [6] Dominique Duncan, Thomas Strohmer . Classification of Alzheimer's disease using unsupervised diffusion component analysis. Mathematical Biosciences and Engineering, 2016, 13(6): 1119-1130. doi: 10.3934/mbe.2016033
    [7] David Cuesta–Frau . Permutation entropy: Influence of amplitude information on time series classification performance. Mathematical Biosciences and Engineering, 2019, 16(6): 6842-6857. doi: 10.3934/mbe.2019342
    [8] Huanhai Yang, Shue Liu . A prediction model of aquaculture water quality based on multiscale decomposition. Mathematical Biosciences and Engineering, 2021, 18(6): 7561-7579. doi: 10.3934/mbe.2021374
    [9] Yu Jin, Zhe Ren, Wenjie Wang, Yulei Zhang, Liang Zhou, Xufeng Yao, Tao Wu . Classification of Alzheimer's disease using robust TabNet neural networks on genetic data. Mathematical Biosciences and Engineering, 2023, 20(5): 8358-8374. doi: 10.3934/mbe.2023366
    [10] Konstantin Weise, Erik Müller, Lucas Poßner, Thomas R. Knösche . Comparison of the performance and reliability between improved sampling strategies for polynomial chaos expansion. Mathematical Biosciences and Engineering, 2022, 19(8): 7425-7480. doi: 10.3934/mbe.2022351
  • Alzheimer's disease (AD) is a neurological degenerative disease, which is mainly characterized by the memory loss. As electroencephalogram (EEG) device is relatively cheap, portable and non-invasive, it has been widely used in AD-related studies. We proposed a method to detect the differences between healthy subjects and AD patients, which combines classical sample entropy (SampEn) and surrogate data method. EEGs from 14 AD patients and 20 healthy subjects were analyzed. The results based on the original data showed that the SampEn of AD patients was significantly decreased (p<0.01) at electrodes c3, f3, o2 and p4, which confirmed that AD could cause complexity loss. However, using original data could be subject to human judgement, so we generated a series of surrogate data. We found that, there were significant difference of SampEn between the original time series and their surrogate data at c3 and o2 electrodes and the differences between healthy subjects and AD patients can be verified. Our method is capable of distinguishing AD patients from healthy subjects, which is consistent with the concept of physiologic complexity, and providing insights for understanding of AD.


    Alzheimer's disease (AD) is a neurological degenerative disease. As the most common form of dementia, the major feature of AD is memory decline [1]. Drugs can only delay the deterioration of AD but cannot cure it. Hematological examination, neurological tests, imaging techniques, etc. are always combined in a variety of ways to diagnose AD. Some functional imaging techniques, such as functional magnetic resonance imaging (fMRI) [2,3], positron emission tomography (PET) [4], and single photon emission computed tomography (SPECT), are useful in making objective evaluations of the severity of dementia. Some disadvantages of these techniques, such as high cost and potential exposure to radionuclide irradiation could limit their clinical applications [5,6].

    EEG collection equipment is more economical, portable and non-invasive than other imaging techniques that is used in AD diagnosis. Moreover, EEG recording can detect the abnormalities of AD patients in electrical activities of the brain [7]. Over the past 40 years, a large number of researches have demonstrated that the alterations of EEG complexity, synchrony, and brain dynamics (the slowing of alpha rhythm and the diffuse dominance of theta or delta rhythm) in AD [7,8]. In order to characterize these alterations, researchers have proposed many different features. Relative band power[9], absolute band power [10], spectral, central tendency [11], mean, variance, and zero-crossing [12], auto mutual information, mean frequency [11], amplitude modulation [13] are the most frequently extracted EEG features for AD detection. Temporal-scale-specific fractal dimension [14] and cross-correlation analysis (DCCA) coefficients [15] are also useful to differentiate AD patients from healthy individuals. Combined with these features, some new algorithms [16,17] such as artificial neural network (ANN) classifier[18], support vector machine classifier [12] have been introduced to identify AD recently.

    EEG signals are typical nonlinear time series [19]. A key measure of information is known as entropy, which has a strong relationship with nonlinear time series and dynamical systems. Entropy is defined as a measure of uncertainty of information in a statistical description of a system [20]. Permutation entropy [21], Approximate Entropy (ApEn) [22], Sample entropy (SampEn) [11,23], Spectral entropy [24], Fuzzy entropy [25] etc. are widely used in nonlinear dynamics and AD detection. Within the entropy family, approximate entropy and its modified methods have been introduced for studying regularity and complexity in physiological and biological time-series [26]. ApEn quantifies the conditional probability that two sequences which are similar for m points (within a given tolerance of r) remain similar when one consecutive point is included. SampEn is an improved algorithm of ApEn which avoids the bias caused by self-matching [22,26]. SampEn has been applied to EEG data to reveal a loss of complexity and a destruction of nonlinear structures in brain dynamics in AD [25].

    Surrogate data method is a useful technique for nonlinearity hypothesis testing for time series analysis. Many researches have already proved that the existence of nonlinearity of EEG sequence by using surrogate data analysis [27]. Nonlinear measures, such as sample entropy, correlation dimension, and largest Lyapunov exponent, were computed on reconstructed signals of EEG. Nonparametric statistical tests were performed on the surrogate data to verify that the nonlinear measures are an intrinsic characteristic of the signals [28]. Moreover, original data always includes human judgment, and surrogate data method can provide a benchmark or control experiment, with which the original data can be compared [29]. A new method combining generalized sample entropy and surrogate data analysis for complex system analysis was proposed by Silva and Murta Jr. [27]. They analyzed heart rate variability (HRV) dynamics and calculated the generalized sample entropy of original time series and surrogate ones. This method was also used to analyze financial time series [30], stock market data [31] and traffic signals [32].

    Inspired by this method, we proposed a method which combines classical SampEn with surrogate data, and this method is for the first time used to analyze the differences between normal people and AD patients. We would introduce three algorithms for generating surrogate data: simply shuffling the original time series, un-windowed Fourier transform algorithm (FT), and amplitude adjusted Fourier transform (AAFT) [33]. SampEn, as a complexity measure, was investigated and tested for EEG signal. Surrogate data was used to compute entropy differences between original dynamics and surrogate series.

    The outline of the paper is as follows. In section 2, we give an overview of surrogate data and SampEn, and describe the analysis method to detect the difference of EEG data between AD patients and normal subjects. In section 3, the results of the method and corresponding explanations are presented. In section 4, a conclusion is drawn.

    The database used in this study consisted of 34 subjects (20 healthy subjects and 14 patients with a diagnosis of AD). EEG signals were recorded for the subjects in a relaxed state with eyes closed with an average recording time of 130 seconds and a frequency of 250 Hz. As shown in Figure 1, o1 and o2 channels were placed on the occipital region, p3 and p4 channels on the parietal region, t3 and t4 channels on the temporal region, c3 and c4 channels on the central region, and f3 and f4 channels on the frontal region [34]. This database (20 healthy subjects and 14 AD patients) was also used by other relevant researches[20,34,35].

    Figure 1.  The figure shows the different location of the 10 electrodes.

    SampEn is designed to reduce the bias of ApEn and in closer agreement with theory for datasets with known probabilistic content. Moreover, SampEn displays the property of relative consistency in situations where ApEn does not. Increases of SampEn is often associated to increases of complexity.

    The calculation of sample entropy is as follows:

    Arrange x(1),x(2),...,x(N) to form an m-dimensional vector.

    Xm(i)=[x(i),x(i+1),...,x(i+m1)];1iNm+1 (2.1)

    Define d[Xm(i),Xm(j)] as the largest distance between Xm(i) and Xm(j).

    d[Xm(i),Xm(j)]=maxx(i+k)x(j+k) (2.2)

    where 1km1,1i,jNm+1,ij.

    Given a threshold value r(r>0), for 1iNm,ij, define Bmi(r) as:

    Bmi(r)=1Nm1num{d[Xm(i),Xm(j)]<r} (2.3)

    We can calculate the average for all of i :

    Bm(r)=1Nm1Nmi=1Bmi(r) (2.4)

    For m+1, we have

    Ami(r)=1Nm1num{d[Xm+1(i),Xm+1(j)]<r} (2.5)

    where 1iNm,ij.

    The average for all of i is:

    Am(r)=1Nm1Nmi=1Ami(r) (2.6)

    Sample entropy can be calculated as:

    SampEn(m,r)=limN{ln[Am(r)/Bm(r)]} (2.7)

    Computation of SampEn depends on three parameters: length of the epoch (N), the number of previous values used for the prediction of the consequent value (m), and threshold that determines the similarity of patterns (r). The threshold (r) is defined as relative fraction of the standard deviation (SD) of the N amplitude values [36].

    A is the self-similar probability of time series when the dimension is m. When the dimension is m+1, the self-similar probability of time series is B. We can infer that CP=A/B. Obviously, SampEn(m, r, N) is precisely the negative natural logarithm of the CP. A dataset of length N, having repeated itself within a tolerance r for m points, will also repeat itself for m1 points, without allowing self-matches. SampEn does not use a template wise approach, and A and B accrue for all the templates [36].

    According to other studies and theoretical consideration, the parameters set m=2, and r=0.20SD are used in this study.

    In the surrogate data method, a null hypothesis is first proposed (for example, assuming that the original data is linear), and then, surrogate data is generated by different algorithms such as FT or simply shuffling the original time series. Different surrogate data retain different characteristics of original data.

    The first algorithm we will use is simply shuffling the time-order of the original time series. The surrogate data is obviously guaranteed to have the same amplitude distribution as the original data, but any temporal correlations that may exist in the original data are destroyed.

    The surrogate data generated by FT algorithm is constructed to keep the same Fourier spectrum as the original data. The Fourier transform has a complex amplitude at each frequency as we all know. First, to randomize the phases, we multiply each complex amplitude by eiϕ, in which ϕ is independently chosen for each frequency from the interval [0,2π]. We must ensure that ϕ(f)=ϕ(f), so that the inverse Fourier transform can be real (no imaginary components). Finally, the inverse Fourier transform is the surrogate data [29]. For AAFT algorithm, the idea is to first rescale the values in the original time series so that they are gaussian. Then the FT or WFT algorithm can be used to make surrogate time series which have the same Fourier spectrum as the rescaled data. Finally, the gaussian surrogate is then rescaled back to have the same amplitude distribution as the original time series.

    After that, the statistic feature of the original data and the surrogate data are separately calculated. Theiler considered that there is a great deal of flexibility in the selection of statistics. The statistical test method as shown in the equation below is used to compare the difference between the original data and the surrogate data.

    Let Qorig denote the statistic computed for the original time series, and Qsurri for the ith surrogate data generated under the null hypothesis. Let μsurr and σsurr denote the mean and standard deviation of the distribution of Qsurri.

    We define the significance as:

    S=|Qorigμsurr|σsurr (2.8)

    If the distribution of the statistic is gaussian (and numerical experiments indicate that this is often a reasonable approximation), then the p-value is given by p=erfc(S/2).

    We often use Kolmogorov-Smirnov or Mann-Whitney test to compare the full distributions of the observed data and the surrogate data directly. Student-t test only compare their means. For the present purposes, we use a kind of t-test.

    We studied 20 healthy subjects and 14 AD patients who were in relaxed and eye-closed state. Original EEG data covered 10 electrodes: c3, c4, f3, f4, o1, o2, p3, p4, t3, t4.

    Preliminarily, we calculated SampEn of the original EEG data of 34 subjects at each electrodes. Then we chose to calculate the SampEn of surrogate data at c3, o2, o1, f3 electrodes. The choice of these four electrodes was based on the consequences of the last step and previous studies [20]. There were approximately 32,720 samples collected for each time series in the study. To evaluated the influence of the entropic index of SampEn, we calculated the difference between SampEn of the original time series and average SampEn of their surrogate data. At first, for each given time series, 300 surrogate series were generated respectively by three different algorithms that we mentioned before. That means, for each given original series, 900 surrogate series were generated. SampEn for each surrogate series and the mean SampEn (qsurr) of the 300 surrogate series were calculated. SampEn was also calculated for original time series (qorig). qSD was defined as: qSD=|qsurrqorig|.

    At last, the t-test which is based on double sample heteroscedasticity hypothesis was used to test the significance of difference between healthy subjects and AD patients. The analysis tool was applied to two samples which are from different populations, which assumes that the variance is unequal and unknown, to test whether there is a significant difference between the means of two samples. If the two-tailed truncation probability (p-value) is greater than 0.01, then the null hypothesis will not be rejected, which means there is no significant difference between the means of two samples.

    We calculated the mean and variance of SampEn of 34 subjects (20 healthy subjects and 14 AD patients) at each electrodes. The results were respectively shown in Table 1, and we can infer that the SampEn of healthy subjects was larger than that of AD patients. However, the details of the datasets may be lost when we averaged the data. We then plotted the SampEn of 20 healthy subjects (left) and 14 AD patients (right) as Figure 2 showed. A decagon represented a person, and one vertex of the decagon represented the value of SampEn at each electrodes. For most of the 14 AD patients, the value of SampEn was less than 3.00, while a part of healthy subjects were larger than 3.00 on the contrary. As our mentioned above, increases of SampEn were often associated to increases of complexity generally, and thus it could be confirmed that suffering from AD would cause complexity loss. However, there was a partial overlap between (a) and (b), in which SampEn of healthy subjects was slightly larger than that of AD patients. The main reason was probably the individual difference. SampEn of healthy subjects was obviously larger than AD patients at t3 electrode which is close to the brain areas of memory functions.

    Table 1.  The mean and variance (var) of SampEn in each electrodes for 20 healthy subjects and 14 AD patients. Red number denotes p<0.01, blue number denotes p<0.05.
    Group mean and var c3 c4 f3 f4 o1 o2 p3 p4 t3 t4
    healthy subjects mean 2.7464 2.7556 2.7181 2.7321 2.9439 3.0126 2.7928 2.8819 2.9060 2.8513
    var 0.0715 0.0485 0.0361 0.0399 0.0186 0.0674 0.0113 0.0117 0.3242 0.0742
    AD patients mean 2.5493 2.5961 2.5874 2.6022 2.8268 2.7734 2.6903 2.6959 2.5652 2.6797
    var 0.0131 0.0304 0.0056 0.0080 0.0160 0.0286 0.0481 0.0468 0.0356 0.0529
    p-value 0.0067 0.0252 0.0098 0.0160 0.0156 0.0027 0.1235 0.0082 0.0198 0.0563

     | Show Table
    DownLoad: CSV
    Figure 2.  (a) SampEn of original data for 20 healthy subjects. (b) SampEn of original data for 14 AD patients. A decagon represents a person, one vertex of the decagon represents the value of SampEn at each electrodes.

    T-test, based on double-sample-heteroscedasticity hypothesis, was performed to test the significance of difference between healthy subjects and AD patients. Statistically speaking, SampEn of healthy subjects was different from AD patients at electrodes c3, c4, f3, f4, o1, o2, p4, t3 (p<0.05), and significantly different (p<0.01) at electrodes c3, f3, o2, p4.

    However, we have no idea how accurate the original data is. Furthermore, repeating the experiments is time consuming and will bring into some exogenous variables. The time series requires a sufficient number of samples to achieve statistical test of time series analysis. Sample acquisition can be done by the method called surrogate data, which can directly construct the time series itself and can save time. Surrogate data have to make itself random but retain the characters of original data (including amplitude distribution, autocorrelation functions, etc.).

    It has been confirmed that, as a chaotic time series, EEG data has a number of characteristics of nonlinear dynamics. Therefore, chaotic time series analysis methods can be applied to analyze EEG signals. Surrogate data analysis, an indirect method, cannot only analyze chaotic time series, but also can deepen the understanding of related knowledge. Moreover, there is always room for human judgment with real data. Theiler argued that besides formally rejecting a null hypothesis, the method of surrogate data can also be used to in an informal way, provide a benchmark or control experiment, with which the actual data can be compared [29].

    We generated 900 different sets of surrogate data using three different algorithms (shuffling: 300 sets of surrogate data; FT: 300 sets of surrogate data; AAFT: 300 sets of surrogate data) for each set of original data at electrodes c3, o2, o1, f3. Among these four electrodes, c3, f3, o2 were selected due to the consequence of original data, o1 was selected as a contrast. And then the mean and standard deviation (SD) of the 300 SampEn (for 300 series of surrogate data generated by one algorithm) were calculated. We selected an AD patient at o2 electrode and drew a frequency histogram of 300 SampEn for three different algorithms. Figure 3 showed that the frequency histograms of 300 SampEn of surrogate data for an AD patient. The origin of the x-axis was the value of SampEn of original data. The curve on the left was the distribution of SampEn for 300 sets of AAFT surrogate data; the middle one was for FT surrogate data; the right one was for simply shuffling the original time series. The curves were far away from each other and there was no overlap among them, in which the value of SampEn for shuffling was maximal. The surrogate data had a higher SampEn comparison with original time series. Values of p<0.01 were considered to indicate there is highly significant difference. Then the null hypothesis was rejected, which means EEG signals are nonlinear time series [37].

    Figure 3.  The curve on the left indicates the distribution of 300 SampEn for 300 series of AAFT surrogate data, and the middle is for FT surrogate data, and the right is for simply shuffling the original time series.

    Table 2 shows the results of SampEn at electrodes c3, o2, o1, f3. Corresponding to the Figure 3, SampEn of surrogate data generated by three algorithms are all larger than that of original data, in which shuffling is maximal, and this consequence may be related to the various surrogate data algorithms. It has been clearly shown in Table 3 that different surrogate data retain different characteristics of original data. Surrogate data generated by shuffling the time-order of the original time series is obviously guaranteed to have the same amplitude distribution as the original data, but any temporal correlations that may exit in the data are destroyed. The FT surrogate data are constructed to have the same Fourier spectrum and autocorrelation function as the original data, but randomize the phases of a Fourier transform, and the first-order characteristics (mean, SD, etc.) are preserved [38]. AAFT algorithm, as an improved algorithm based on FT, provides a surrogate of the original time series which retains its amplitude distribution, the first-order characteristics, and autocorrelation function [39]. The surrogate data generated by AAFT algorithm keeps the characteristics of original data mostly, so that the value of SampEn is closest to original data. There is no highly significant difference (p>0.01) in SampEn between normal people and AD patients for surrogate data, and the reason why surrogate data cannot tell the difference is that other characteristics of original data may be dropped. To fix this problem, in this paper, we defined qSD=|qsurrqorig| (qsurr is the mean of 300 SampEn; qorig is SampEn of original data).

    Table 2.  Results of SampEn (mean ± SD) for three surrogate data algorithms at electrodes c3, o2, f3, o1.
    electrodes data healthy subjects AD patient p-value
    c3 original 2.7464±0.0715 2.5493±0.0131 0.007
    shuffling 5.4949±0.1575 5.6821±0.1068 0.226
    FT 3.8067±0.0973 3.7685±0.1031 0.732
    AAFT 2.8655±0.0904 2.8044±0.0787 0.549
    o2 original 3.0126±0.0674 2.7734±0.0286 0.003
    shuffling 5.4126±0.1317 5.5975±0.2119 0.306
    FT 4.0612±0.0669 3.8688±0.0660 0.046
    AAFT 3.1240±0.0641 2.9242±0.0526 0.023
    f3 original 2.7181±0.0361 2.5874±0.0056 0.009
    shuffling 5.6923±0.0770 5.7800±0.0609 0.419
    FT 3.8337±0.0673 3.7833±0.0699 0.586
    AAFT 2.8774±0.0559 2.8121±0.0479 0.414
    o1 original 2.9439±0.0186 2.8268±0.0160 0.016
    shuffling 5.4751±0.1949 5.3209±0.0895 0.330
    FT 4.0046±0.0499 3.9206±0.0826 0.369
    AAFT 3.0381±0.0244 2.9379±0.0508 0.164

     | Show Table
    DownLoad: CSV
    Table 3.  Characteristics of surrogate data generated by three different algorithms.
    shuffling FT AAFT
    amplitude distribution
    the first-order characteristics
    Fourier spectrum
    autocorrelation function

     | Show Table
    DownLoad: CSV

    Surrogate data were used here to compute entropy differences between original dynamics and surrogate series. The ability to differentiate situations of low-dimensional deterministic chaos from stochastic processes is due to the use of surrogate data series [27]. SampEn, as a visualized statistics, indicated the difference of healthy subjects and AD patients. We used three different algorithms to calculate the qSD.

    Table 4 shows the results of qSD. The significance of values for these groups was tested with t-test. Comparing healthy subjects with AD patients at c3, o2, f3, o1 electrodes for shuffling algorithm, p=0.023, p=0.032, p=0.763, p=0.072 were obtained respectively. Only at c3, o2 electrodes, p<0.05 was found, which means the significant difference between AD patients and healthy subjects in c3, o2 electrodes.

    Table 4.  qSD (mean± SD) under three different algorithm.
    algorithm Group c3 o2 f3 o1
    AAFT healthy subjects 0.1245±0.0154 0.1148±0.0069 0.1665±0.0219 0.0963±0.0031
    AD patients 0.2552±0.0464 0.1526±0.0227 0.2247±0.0357 0.1111±0.0175
    p-value 0.055 0.403 0.345 0.687
    FT healthy subjects 1.0604±0.0199 1.0486±0.0128 1.1156±0.0268 1.0606±0.0226
    AD patients 1.2193±0.0688 1.1509±0.0766 1.1960±0.0580 1.0937±0.0508
    p-value 0.053 0.208 0.290 0.636
    shuffling healthy subjects 2.7797±0.1929 2.3945±0.2570 2.9510±0.1129 2.5810±0.1965
    AD patients 3.1755±0.1149 2.8545±0.2152 3.2052±0.0755 2.5364±0.0658
    p-value 0.023 0.032 0.763 0.072

     | Show Table
    DownLoad: CSV

    The reason why there was no significant difference between healthy subjects and AD patients for FT and AAFT algorithms is probably that the common feature between surrogate data and original data has been eliminated by subtraction operation, and the differences remained may be weakened. That means, the more details were surrogated by FT and AAFT algorithms from original data, the less information will be reserved in calculating qSD. On the contrary, surrogate data generated by shuffling algorithm is guaranteed to have the same amplitude distribution as the original data, so the subtraction operation have less impact on the statistical test. In other words, shuffling algorithm here can detect the significant difference much better.

    We selected six healthy subjects and six AD patients at o2 electrode and try to find the difference of the frequency histogram of 300 SampEn between two groups. Figure 4 showed the distribution of 300 SampEn for surrogate data generated by AAFT algorithm. Although the distribution of the data can be immediately seen from the frequency histogram, it is not a good way to identify whether the distribution of data comes from a specific distribution. Normal probability plots are widely used as a statistical tool for assessing whether an observed simple random sample is drawn from a normally distributed population [40]. Figure 5, corresponding to Figure 4, showed the probability plot for normal distribution which compares the distribution of the data to the normal distribution. The plot included a reference line, which is useful for judging whether the data follows a normal distribution. A single small graph represented the SampEn distribution of one person. One-sixth of healthy subjects had a positive skew distribution which is u-shaped, while half of AD patients had that distribution. The most probable conclusion of the phenomenon was that more positive skew distribution of SampEn would exist in AD patients. This way can give us another perspective to visualize the distribution of data.

    Figure 4.  The distribution of 300 SampEn for surrogate data generated by AAFT algorithm. (a) the results of six healthy subjects (b) the results of six AD patients. All of these are under o2 electrode.
    Figure 5.  Probability plot for Normal distribution for (a) six healthy subjects (b) six AD patients.

    A relevant study using this same database revealed a significant reduction in complexity in AD, as measured with the ApEn mean, at electrodes c3 and o2 [20]. Other previous studies using ApEn [41], SampEn [42], and Fuzzy entropy analyzed different database. Although, it was found that ApEn and SampEn were significantly lower in AD patients than in healthy subjects at electrodes p3, p4, o1, and o2, the classification accuracy obtained with receiver operating characteristic (ROC) curves at all of those electrodes between them is different [22,25,43]. SampEn showed the superior discriminating power when compared to ApEn which could arise from the fact that SampEn is an improvement of ApEn. Besides, ApEn results should be interpreted with great care, as this is a biased entropy estimator and not as reliable as other algorithms [25]. These results are also supported by recent findings with Fuzzy entropy [25]. All of these results support that EEG activity of AD patients is significantly more regular (less complex) than in a normal brain in the parietal and occipital regions. Our study proved that c3 electrode also showed less complex activity and indicated that the parietal regions may also be affected.

    A large number of researches have demonstrated the alterations of EEG complexity, synchrony, and brain dynamics in AD. Many different features of EEG series were extracted for AD detection [7,8]. A key measure of time series is known as entropy [22]. We proposed a method which combined SampEn with surrogate data to analyze the differences between healthy subjects and AD patients. The value of SampEn is often associated to complexity, AD could cause complexity loss, which thus give rise to the smaller values of SampEn. The method of surrogate data was used here as control experiment, with which the actual data can be compared.

    We observed the SampEn of each electrode for 20 healthy subjects and 14 AD patients. As the results showed, SampEn were different (p<0.01) between AD patients and healthy subjects at electrodes c3, f3, o2, p4. We then introduced three surrogate algorithms to calculated qSD=|qsurrqorig| (qsurr is the mean of 300 SampEn, qorig is SampEn of original data) for four electrodes: c3, f3, o2, o1, and performed a t-test which is based on double sample heteroscedasticity hypothesis for each electrode. Results showed that there was significant difference between the healthy subjects and AD patients at c3, o2 electrodes for shuffling algorithm. This approach is first used to analyze the differences between healthy subjects and AD patients from a different perspective. Other studies using this same database found the significant reduction in complexity at c3 and o2 electrodes, their consequences are consistent with our study [20]. Meanwhile, our result showed EEG signals were nonlinear time series. It means that our method is feasible.

    However, we didn't find the complexity loss at p3 and p4 electrodes. There are several possible reasons for this. The surrogate data had a higher SampEn than original time series. Values of p<0.01 were considered significant, and then the null hypothesis can be rejected, which means EEG signals are nonlinear time series. As stated above, this is the disadvantage of SampEn, because an uncorrelated version of the signals cannot be more complex than the original ones [27]. However, the values of SampEn can reflect some information in a sense. Some improved methods such as Modified generalized multiscale sample entropy [30,31], generalized sample entropy [27,32] can be used to analysis EEG signals.

    In order to obtain adequate samples to achieve statistical test of time series analysis, and realize reproduction of experiments in a way, we adopted surrogate data method. Combined with characteristics of surrogate data, different information can be extracted from the original data, so that we can achieve many different purposes. The nonlinearity existed on EEG signal, SampEn with surrogate data can identified the nonlinear feature from the data effectively. Our method is capable of distinguishing AD patients from healthy subjects, and can provide insights for the understanding of AD. We don't have more information about the patients (such as age and gender), so that the analysis of the differences between AD patients and normal people cannot be more detailed. We will continue to have more investigations on this method in the future using more datasets with detailed information.

    This work is supported in part by the National Basic Research Program of China under Grant 2013CB329501, in part by the National Natural Science Foundation of China under Grant 81271645, in part by the Public Projects of Science Technology Department of Zhejiang Province under Grant 2013C33162, and in part by the Zhejiang Provincial Natural Science Foundation of China under Grant LY 12H18004, and in part by the Science and Technology Commission of Shanghai Municipality (Grant No. 18411970300), and the Health Industry Clinical Research of the Shanghai Health and Family Planning Committee (Grant No. 201840018).

    The authors declare that they have no competing interests.


    [1] J. E. Cooper, On the publication of the diagnostic and statistical manual of mental disorders: Fourth edition (dsm-iv), Br. J. Psychiat., 166 (1995), 4–8.
    [2] M. Basso, J. Yang, L. Warren, et al., Volumetry of amygdala and hippocampus and memory performance in alzheimer's disease, Psychiat. Res., 146 (2006), 251–261.
    [3] C. I. Wright, B. C. Dickerson, E. Feczko, et al., A functional magnetic resonance imaging study of amygdala responses to human faces in aging and mild alzheimers disease, Biol. Psychiat., 62 (2007), 1388–1395.
    [4] A. Drzezga, Diagnosis of alzheimer's disease with [18f] pet in mild and asymptomatic stages, Behav. Neurol., 21 (2009), 101–115.
    [5] P. H. Tsai, C. Lin, J. Tsao, et al., Empirical mode decomposition based detrended sample entropy in electroencephalography for alzheimer's disease, J. Neurosci. Methods, 210 (2012), 230–237.
    [6] H. Zhang, C. L. Wong and P. Shi, Estimation of cardiac electrical propagation from medical image sequence, 2006 9th International Conference on Medical Image Computing and Computer-assisted Intervention (Copenhagen), Springer, (2006), 528–535.
    [7] K. D. Tzimourta, N. Giannakeas, A. T. Tzallas, et al., Eeg window length evaluation for the detection of alzheimer's disease over different brain regions, Brain Sci., 9 (2019), Article 81.
    [8] C. Coronel, H. Garn, M. Waser, et al., Quantitative eeg markers of entropy and auto mutual information in relation to mmse scores of probable alzheimer's disease patients, Entropy, 19 (2017), 1099–4300.
    [9] J. Poza, C. Gmez, M. Garca, et al., Spatio-Temporal fluctuations of neural dynamics in mild cognitive impairment and alzheimer's disease, Curr. Alzheimer Res., 14 (2017), 924–936.
    [10] N. Emanuel, B. Felix, A. Harald, et al., Regularized linear discriminant analysis of eeg features in dementia patients, Front. Aging Neurosci., 8 (2016), Article 273.
    [11] M. Dottori, L. Sedeo, M. C. Martorell, et al., Towards affordable biomarkers of frontotemporal dementia: a classification study via networks information sharing, Sci. Rep., 7 (2017), Article 3822.
    [12] N. N. Kulkarni and V. K. Bairagi, Extracting salient features for eeg-based diagnosis of alzheimer's disease using support vector machine classifier, IETE J. Res., 63 (2016), 11–22.
    [13] T. H. Falk, F. J. Fraga, L. Trambaiolli, et al., Eeg amplitude modulation analysis for semi-automated diagnosis of alzheimers disease, EURASIP J. Adv. Signal Process., 2014 (2014), Arti-cle 192.
    [14] S. Nobukawa, T. Yamanishi, H. Nishimura, et al., Atypical temporal-scale-specific fractal changes in alzheimers disease eeg and their relevance to cognitive decline, Cogn. Neurodynamics, 13 (2019), 1–11.
    [15] Y. Chen, L. Cai, R. Wang, et al., Dcca cross-correlation coefficients reveals the change of both synchronization and oscillation in eeg of alzheimer disease patients, Physica A, 490 (2017), 171–184.
    [16] H. Zhang, Z. Gao, L. Xu, et al., A meshfree representation for cardiac medical image computing, IEEE J. Transl. Eng. Health. Med., 6 (2018), 1800212.
    [17] H. Zhang, H. Ye and W. Huang, A meshfree method for simulating myocardial electrical activity, Comput. Math. Methods. Med., 2012 (2012), 1–16.
    [18] A. I. Triggiani, V. Bevilacqua, A. Brunetti, et al.,Classification of healthy subjects and alzheimer's disease patients with dementia from cortical sources of resting state eeg rhythms: a study using artificial neural networks, Front. Neurosci., 10 (2016), Article 604.
    [19] W. He, J. Zhu and H. Yang, Contrastive analysis of correlation dimension of eeg signals between normal and pathological groups, 2008 World Automation Congress (Hawaii), IEEE, 2008.
    [20] Z. Hu and P. Shi, Regularity and complexity of human electroencephalogram dynamics: ap-plications to diagnosis of alzheimers disease, 2006 18th International Conference on Pattern Recognition, IEEE CS, 2006.
    [21] L. Tylov, J. Kukal, V. Hubata-Vacek, et al., Unbiased estimation of permutation entropy in eeg analysis for alzheimer's disease classification, Biomed. Signal Process. Control, 39 (2018), 424–430.
    [22] J. S. Richman and J. R. Moorman, Physiological time-series analysis using approximate entropy and sample entropy, AM. J. Physiol-Heart C., 278 (2000), H2039–H2049.
    [23] C. Gomez C, F. Vaquerizo-Villar, J. Poza, et al., Bispectral analysis of spontaneous eeg activity from patients with moderate dementia due to alzheimer's disease, 2017 39th Annual International Conference of the IEEE Engineering in Medicine and Biology Society, IEEE, (2017), 422–425.
    [24] D. Labate, F. L. Foresta, G. Morabito, et al., Entropic measures of eeg complexity in alzheimer's disease through a multivariate multiscale approach, IEEE Sens. J., 13 (2013), 3284–3292.
    [25] P. Espino, S. Simons and D. Absolo, Fuzzy Entropy analysis of the electroencephalogram in patients with alzheimer's disease: Is the method superior to Sample Entropy?, Entropy, 20 (2018).
    [26] C. Ying and T. D. Pham, Sample entropy and regularity dimension in complexity analysis of cortical surface structure in early alzheimer's disease and aging, J. Neurosci. Methods, 215 (2013), 210–217.
    [27] E. V. S. Luiz and L. M. Otavio, Evaluation of physiologic complexity in time series using gener-alized sample entropy and surrogate data analysis, Chaos, 22 (2012), 479–487.
    [28] F. Onorati, L. T. Mainardi, F. Sirca, et al., Nonlinear analysis of pupillary dynamics, Biomed. Eng., 61 (2016), 95–106.
    [29] J. Theiler, E. Stephen, A. Longtin, et al., Testing for nonlinearity in time series: The method of surrogate data, Physica D, 58 (1992), 77–94.
    [30] P. Shang, Y. Wu and Y. Li, Modified generalized multiscale sample entropy and surrogate data analysis for financial time series, Nonlinear Dyn., 92 (2018), 1335–1350.
    [31] P. Shang, M. Xu and J.Huang, Modified generalized sample entropy and surrogate data analysis for stock markets, Commun. Nonlinear Sci., 35 (2016), 17–24.
    [32] M. Xu, D. Shang and P.Shang, Generalized sample entropy analysis for traffic signals based on similarity measure, Physica A, 474 (2017), 1–7.
    [33] T. Schreiber and A. Schmitz,Surrogate time series, Physica D, 142 (1999), 346–382.
    [34] C. P. Pan, B. Zheng, Y. Wu, et al., Detrended fluctuation analysis of human brain electroen-cephalogram, Phys. Lett. A, 329 (2004), 130–135.
    [35] G. Liu, Y. Zhang, Z. Hu, et al.,Complexity analysis of electroencephalogram dynamics in patients with parkinson's disease, Parkinsons Dis., 2017 (2017), 1–9.
    [36] D. E. Lake, J. S. Richman, M. P. Griffin, et al., Sample entropy analysis of neonatal heart rate variability, Am. J. Physiol. Regul. Integr. Comp. Physiol., 283 (2002), Article R789.
    [37] X. J. Tang, S. Zhuo, Y. Zhuo, et al., Entropy measures of erp recordings for dual tasks in man, Acta. Biophysica. Sinica., 21 (2005), 371–376.
    [38] J. Theiler and P. E. Rapp, Re-examination of the evidence for low-dimensional, nonlinear structure in the human electroencephalogram, Electroencephalogr. Clin. Neurophysiol. Suppl. , 98 (1996), 213–222.
    [39] L. Gemma, I. Dmytro, P. Aleksandra, et al., Surrogate data for hypothesis testing of physical systems, Phys. Rep., 748 (2018), 1–72.
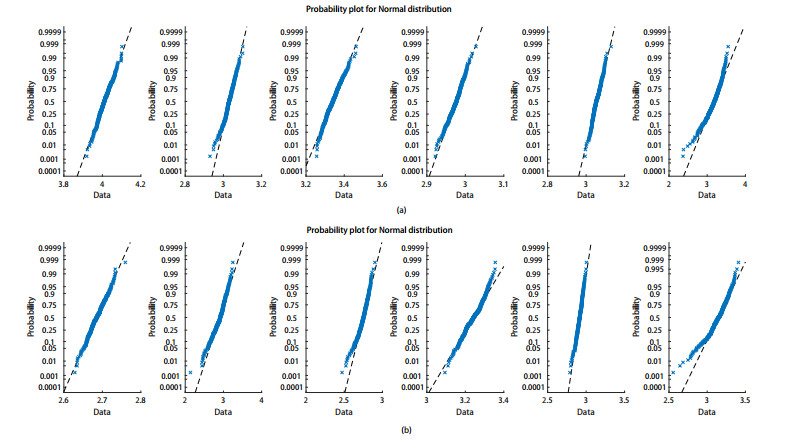
    [40] W. Chantarangsi, W. Liu, F. Bretz, et al., Normal probability plots with confidence, Biom. J., 57 (2015), 52–63.
    [41] D. Absolo, J. Escudero, R. Hornero, et al., Approximate entropy and auto mutual information analysis of the electroencephalogram in Alzheimers disease patients, Med. Biol. Eng. Comput., 46 (2008), 1019–1028.
    [42] D. Abasolo, R. Hornero, P. Espino, et al., Entropy analysis of the eeg background activity in alzheimer's disease patients, Physiol. Meas., 27 (2006), 241–253.
    [43] P. Alberto, G. R. Tomaso, E. Tobaldini, et al., Progressive decrease of heart period variability entropy-based complexity during graded head-up tilt, J. Appl. Physiol., 103 (2007), 1143–1149.
  • This article has been cited by:

    1. Katerina D. Tzimourta, Vasileios Christou, Alexandros T. Tzallas, Nikolaos Giannakeas, Loukas G. Astrakas, Pantelis Angelidis, Dimitrios Tsalikakis, Markos G. Tsipouras, Machine Learning Algorithms and Statistical Approaches for Alzheimer’s Disease Analysis Based on Resting-State EEG Recordings: A Systematic Review, 2021, 31, 0129-0657, 2130002, 10.1142/S0129065721300023
    2. Ezgi Fide, Hasan Polat, Görsev Yener, Mehmet Siraç Özerdem, Effects of Pharmacological Treatments in Alzheimer’s Disease: Permutation Entropy-Based EEG Complexity Study, 2023, 36, 0896-0267, 106, 10.1007/s10548-022-00927-8
    3. Manouane Caza-Szoka, Daniel Massicotte, Windowing Compensation in Fourier Based Surrogate Analysis and Application to EEG Signal Classification, 2022, 71, 0018-9456, 1, 10.1109/TIM.2022.3149325
    4. TISARA KUMARASINGHE, ONDREJ KREJCAR, ALI SELAMAT, NORAZRYANA MAT DAWI, ENRIQUE HERRERA-VIEDMA, ROBERT FRISCHER, HAMIDREZA NAMAZI, COMPLEXITY-BASED EVALUATION OF THE CORRELATION BETWEEN HEART AND BRAIN RESPONSES TO MUSIC, 2021, 29, 0218-348X, 2150238, 10.1142/S0218348X21502388
    5. Indranil Ghosh, Anjana S. Nair, Hammed Olawale Fatoyinbo, Sishu Shankar Muni, Dynamical properties of a small heterogeneous chain network of neurons in discrete time, 2024, 139, 2190-5444, 10.1140/epjp/s13360-024-05363-0
    6. Indranil Ghosh, Sishu Shankar Muni, Hammed Olawale Fatoyinbo, On the analysis of a heterogeneous coupled network of memristive Chialvo neurons, 2023, 111, 0924-090X, 17499, 10.1007/s11071-023-08717-y
    7. Anjana S. Nair, Indranil Ghosh, Hammed O. Fatoyinbo, Sishu S. Muni, On the higher-order smallest ring-star network of Chialvo neurons under diffusive couplings, 2024, 34, 1054-1500, 10.1063/5.0217017
    8. Luis Gabriel Gómez Acosta, Max Chacón Pacheco, Entropy and Statistical Complexity in Bioelectrical Signals: A Literature Review, 2025, 6, 2624-6120, 7, 10.3390/signals6010007
    9. I. Ghosh, H. O. Fatoyinbo, S. S. Muni, Comprehensive analysis of slow-fast denatured Morris-Lecar neurons, 2025, 111, 2470-0045, 10.1103/PhysRevE.111.044204
  • Reader Comments
  • © 2019 the Author(s), licensee AIMS Press. This is an open access article distributed under the terms of the Creative Commons Attribution License (http://creativecommons.org/licenses/by/4.0)
通讯作者: 陈斌, bchen63@163.com
  • 1. 

    沈阳化工大学材料科学与工程学院 沈阳 110142

  1. 本站搜索
  2. 百度学术搜索
  3. 万方数据库搜索
  4. CNKI搜索

Metrics

Article views(5124) PDF downloads(596) Cited by(9)

Figures and Tables

Figures(5)  /  Tables(4)

/

DownLoad:  Full-Size Img  PowerPoint
Return
Return

Catalog