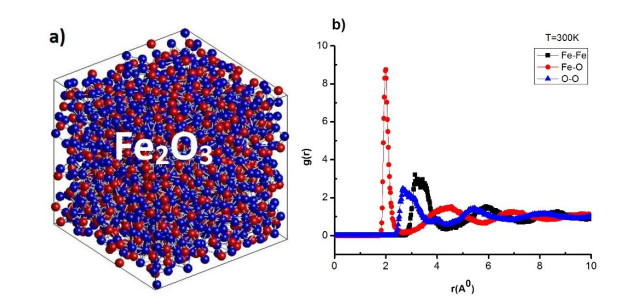
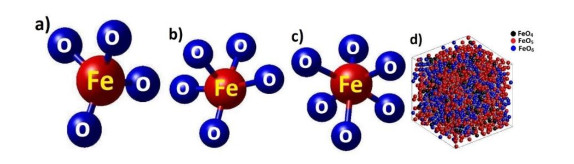
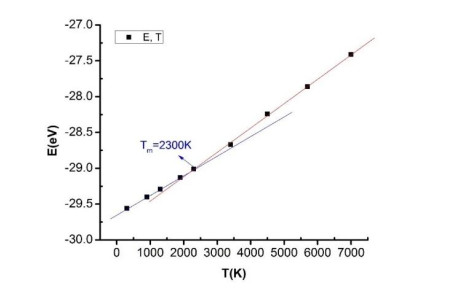
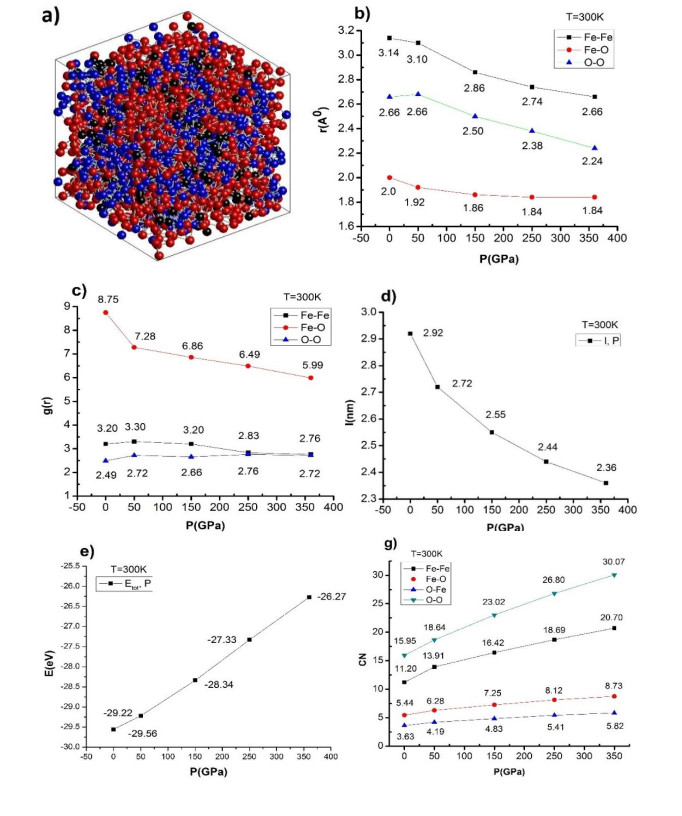
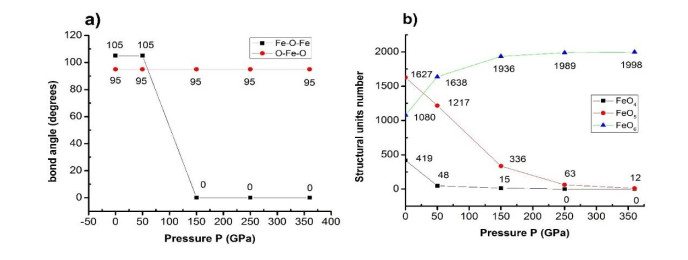
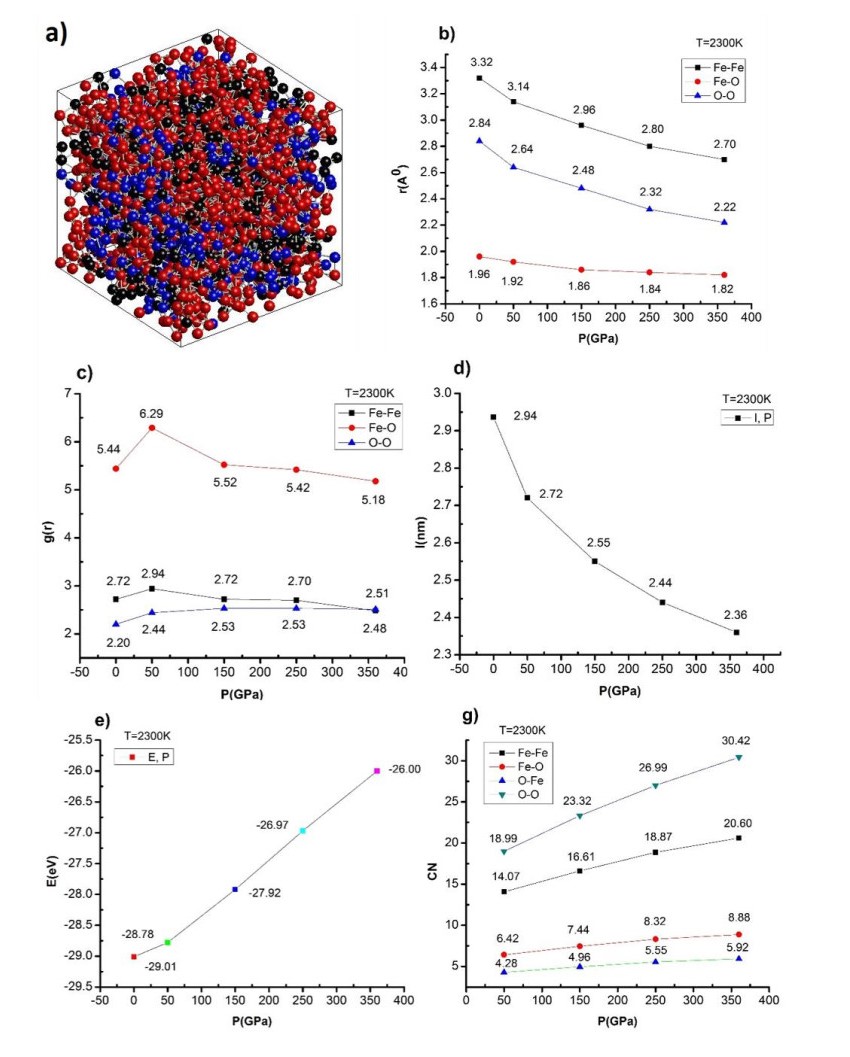
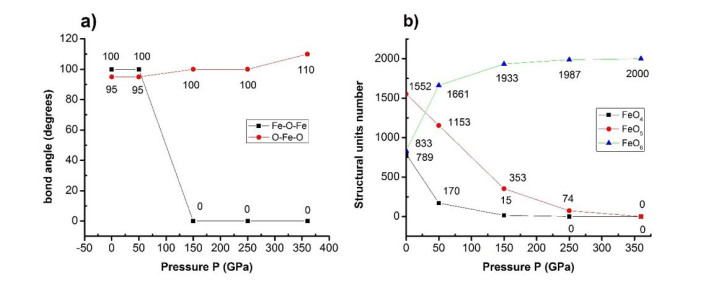
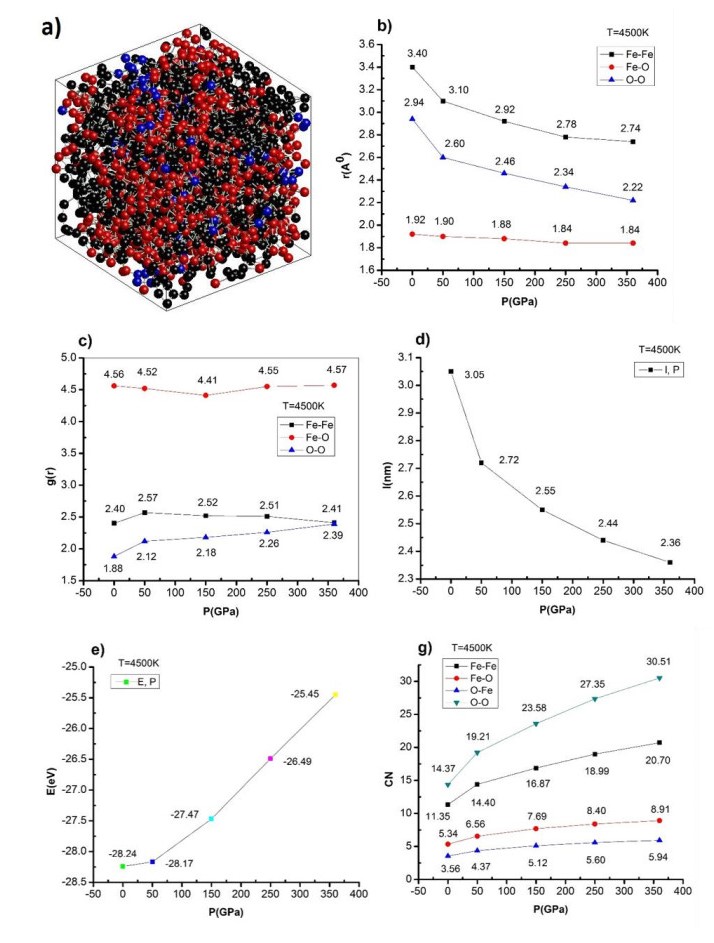
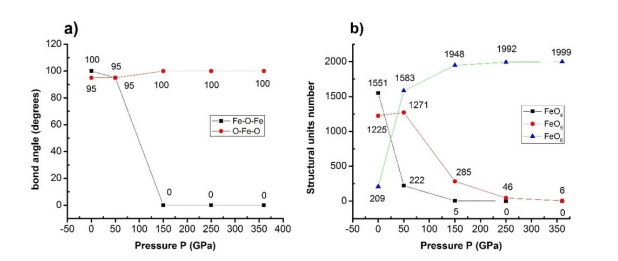
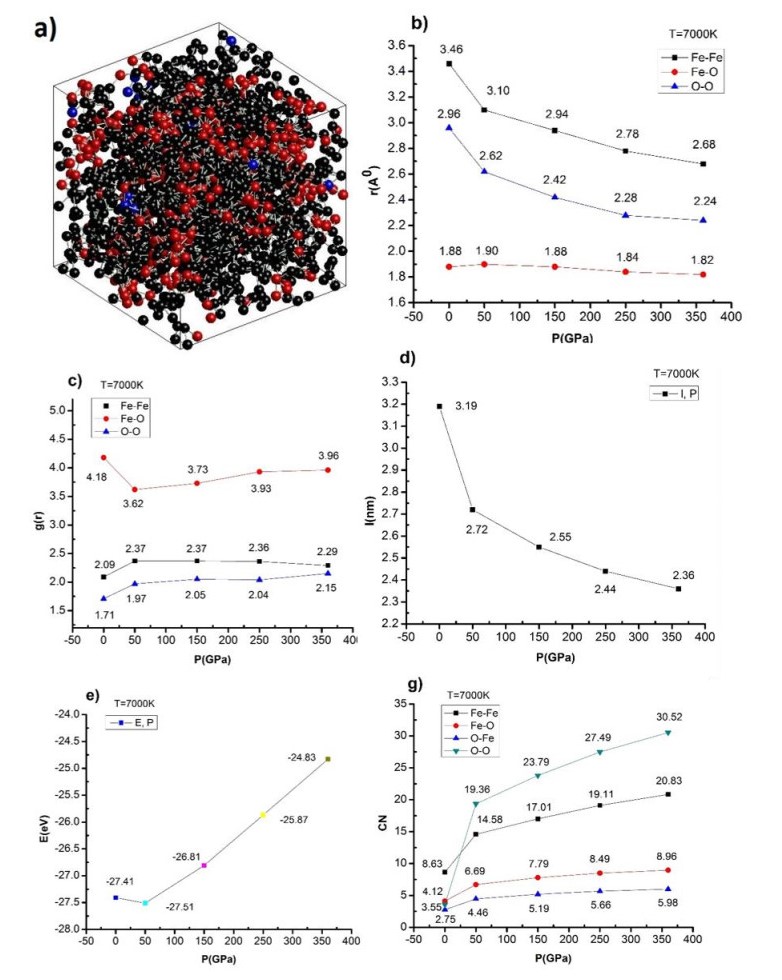
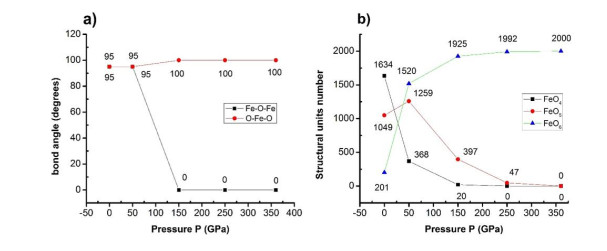
This paper uses Molecular Dynamics (MD) method to study the influence of high temperature (T) and high pressure (P) on the structure and phase transition of Fe2O3 materials. The results show that, when increasing the temperature from T = 300 K to T = 7000 K, P = 0.0 GPa, the size (1) of the Fe2O3 materials increases, the energy (E) increases, the length link (r) decreased, the number of structural units FeO4, FeO5 increased, and FeO6 decreased. Similarly, as the pressure (P) is increased, from P = 0 GPa to P = 360 GPa at temperatures T, l decreases, E increases, r decreases, FeO4 decreases and disappears, FeO5 decreases, and FeO6 increases at high P with P ≥ 150 GPa, FeO5 disappeared at P ≥ 250 GPa and only FeO6 appeared at T = 2300, 7000 K. In addition, when increasing T, P, the bond angle of Fe–O–Fe, O–Fe–O decreases, E increases, r decreases, l increases when T increases and l decreases when P increases, leading to the number of structural units FeO4, FeO5 increasing and FeO6 decreasing when T increases and vice versa when P increases. In addition, the phase transition temperature (Tm), Tm = 2300 K was determined. All the obtained results will be the basis for future experimental studies of amorphous Fe2O3 materials.
Citation: Dung Nguyen Trong, Van Cao Long, Phu Nguyen Dang, Ştefan Ţălu. A molecular dynamics study concerning the effect of high-temperature and high-pressure on the structure and phase transition of Fe2O3 material[J]. AIMS Materials Science, 2022, 9(3): 406-429. doi: 10.3934/matersci.2022024
This paper uses Molecular Dynamics (MD) method to study the influence of high temperature (T) and high pressure (P) on the structure and phase transition of Fe2O3 materials. The results show that, when increasing the temperature from T = 300 K to T = 7000 K, P = 0.0 GPa, the size (1) of the Fe2O3 materials increases, the energy (E) increases, the length link (r) decreased, the number of structural units FeO4, FeO5 increased, and FeO6 decreased. Similarly, as the pressure (P) is increased, from P = 0 GPa to P = 360 GPa at temperatures T, l decreases, E increases, r decreases, FeO4 decreases and disappears, FeO5 decreases, and FeO6 increases at high P with P ≥ 150 GPa, FeO5 disappeared at P ≥ 250 GPa and only FeO6 appeared at T = 2300, 7000 K. In addition, when increasing T, P, the bond angle of Fe–O–Fe, O–Fe–O decreases, E increases, r decreases, l increases when T increases and l decreases when P increases, leading to the number of structural units FeO4, FeO5 increasing and FeO6 decreasing when T increases and vice versa when P increases. In addition, the phase transition temperature (Tm), Tm = 2300 K was determined. All the obtained results will be the basis for future experimental studies of amorphous Fe2O3 materials.

| [1] |
Zhang L, Hu A (2021) Fe2O3 Nanowire flux enabling tungsten inert gas welding of high-manganese steel thick plates with improved mechanical properties. Appl Sci 11: 5052. https://doi.org/10.3390/app11115052. doi: 10.3390/app11115052

|
| [2] |
Serga V, Burve R, Maiorov M, et al. (2020) Impact of gadolinium on the structure and magnetic properties of nanocrystalline powders of iron oxides produced by the extraction-pyrolytic method. Materials 13: 4147. https://doi.org/10.3390/ma13184147 doi: 10.3390/ma13184147
|
| [3] |
Azimov F, Kim J, Choi SM, et al. (2021) Synergistic effects of Fe2O3 Nanotube/Polyaniline composites for an electrochemical supercapacitor with enhanced capacitance. Nanomaterials 11: 1557. https://doi.org/10.3390/nano11061557 doi: 10.3390/nano11061557
|
| [4] |
Essandoh M, Garcia RA (2018) Efficient removal of dyes from aqueous solutions using a novel hemoglobin/iron oxide composite. Chemosphere 206: 502-512. https://doi.org/10.1016/j.chemosphere.2018.04.182 doi: 10.1016/j.chemosphere.2018.04.182
|
| [5] |
Milagres JL, Bellato CR, Ferreira SO, et al. (2020) Preparation and evaluation of hydrocalumite-iron oxide magnetic intercalated with dodecyl sulfate for removal of agrichemicals. J Environ Manage 255: 109845. https://doi.org/10.1016/j.jenvman.2019.109845 doi: 10.1016/j.jenvman.2019.109845
|
| [6] |
Ge YL, Zhang YF, Yang Y, et al. (2019) Enhanced adsorption and catalytic degradation of organic dyes by nanometer iron oxide anchored to single-wall carbon nanotubes. Appl Surf Sci 488: 813-826. https://doi.org/10.1016/j.apsusc.2019.05.221 doi: 10.1016/j.apsusc.2019.05.221
|
| [7] |
Jin J, Ohkoshi S, Hashimoto K (2004) Giant coercive field of nanometer-sized iron oxide. Adv Mater 16: 48-51. https://doi.org/10.1002/adma.200305297 doi: 10.1002/adma.200305297
|
| [8] |
Jolivet JP, Tronc E, Chaneac C (2006) Iron oxides: From molecular clusters to solid. A nice example of chemical versatility. C R Geosci 338: 488-497. https://doi.org/10.1016/j.crte.2006.04.014 doi: 10.1016/j.crte.2006.04.014
|
| [9] |
Li Y, Zhao L, Wang Y, et al. (2018) Effects of Fe2O3 on the properties of ceramics from steel slag. Int J Miner Metall Mater 25: 413-419. https://doi.org/10.1007/s12613-018-1586-7 doi: 10.1007/s12613-018-1586-7
|
| [10] |
Tao S, Liu S, Yuan Y, et al. (2022) A microstructural and compositional study of ε-Fe2O3 crystals in the Hare's Fur Jian Ware. Crystals 12: 367. https://doi.org/10.3390/cryst12030367 doi: 10.3390/cryst12030367
|
| [11] |
Malviya KD, Dotan H, Shlenkevich D, et al. (2016) Systematic comparison of different dopants in thin film hematite (α-Fe2O3) photoanodes for solar water splitting. J Mater Chem A 4: 3091-3099. https://doi.org/10.1039/C5TA07095C doi: 10.1039/C5TA07095C
|
| [12] |
Xu J, Wen Q, Zhang X, et al. (2021) One-Step construction of multi-walled CNTs loaded with α-Fe2O3 nanoparticles for efficient, photocatalytic properties. Materials 14: 2820. https://doi.org/10.3390/ma14112820 doi: 10.3390/ma14112820
|
| [13] |
Sivula K, Formal FL, Gratzel M (2011) Solar water splitting: progress using hematite (α-Fe2O3) photoelectrodes. Chem Sus Chem 4: 432-449. https://doi.org/10.1002/cssc.201000416 doi: 10.1002/cssc.201000416
|
| [14] |
Yu S, Hong VMN, Wang F, et al. (2018) Synthesis and application of iron-based nanomaterials as anodes of lithiumion batteries and supercapacitors. J Mater Chem A 6: 9332-9367. https://doi.org/10.1039/C8TA01683F doi: 10.1039/C8TA01683F
|
| [15] |
Machala L, Zboril R, Gendanken A (2007) Amorphous iron (Ⅲ) oxide A review. J Phys Chem B 111: 4003-4018. https://doi.org/10.1021/jp064992s doi: 10.1021/jp064992s
|
| [16] |
Kment S, Riboni F, Pausova S, et al. (2017) Photoanodes based on TiO2 and α-Fe2O3 for solar water splitting-superior role of 1D nanoarchitectures and of combined heterostructures. Chem Soc Rev 46: 3716-3769. https://doi.org/10.1039/C6CS00015K doi: 10.1039/C6CS00015K
|
| [17] |
Gong XB, You SJ, Wang XH, et al. (2014) A novel stainless steel mesh/cobalt oxide hybrid electrode for efficient catalysis of oxygen reduction in a microbial fuel cell. Biosens Bioelectron 55: 237-241. https://doi.org/10.1016/j.bios.2013.12.015 doi: 10.1016/j.bios.2013.12.015
|
| [18] |
Zhu Y, Zhang B, Wang DW, et al. (2015) Order of activity of nitrogen, iron oxide, and FeNx complexes towards oxygen reduction in alkaline medium. ChemSusChem 8: 4016-4021. https://doi.org/10.1002/cssc.201501141 doi: 10.1002/cssc.201501141
|
| [19] |
Teja AS, Koh PY (2009) Synthesis, properties, and applications of magnetic iron oxide nanoparticles. Cheminform 55: 22-45. https://doi.org/10.1002/cssc.201501141 doi: 10.1002/cssc.201501141
|
| [20] |
Shen S, Lindley SA, Chen X, et al. (2016) Hematite heterostructures for photoelectrochemical water splitting: rational materials design and charge carrier dynamics. Energy Environ Sci 9: 2744-2775. https://doi.org/10.1039/C6EE01845A doi: 10.1039/C6EE01845A
|
| [21] |
Zhang N, Guo Y, Wang X, et al. (2017) A beta-Fe2O3 nanoparticle-assembled film for photoelectrochemical water splitting. Dalton Trans 46: 10673-10677. https://doi.org/10.1039/C7DT00900C doi: 10.1039/C7DT00900C
|
| [22] |
Schrebler R, Ballesteros LA, Gomez H, et al. (2014) Electrochemically grown self-organized hematite nanotube arrays for photoelectrochemical water splitting. J Electrochem Soc 161: 903-908. https://doi.org/10.1149/2.0481414jes doi: 10.1149/2.0481414jes
|
| [23] |
Danno T, Nakatsuka D, Kusano Y, et al. (2013) Crystal structure of β-Fe2O3 and topotactic phase transformation to α-Fe2O3. Cryst Growth Des 13: 770-774. https://doi.org/10.1021/cg301493a doi: 10.1021/cg301493a
|
| [24] |
Zhang N, Wang X, Feng J, et al. (2020) Paving the road toward the use of β-Fe2O3 in solar water splitting: Raman identification, phase transformation and strategies for phase stabilization. Natl Sci Rev 7: 1059-1067. https://doi.org/10.1093/nsr/nwaa039 doi: 10.1093/nsr/nwaa039
|
| [25] |
Tucek J, Machala L, Ono S, et al. (2015) Zeta-Fe2O3-A new stable polymorph in iron (Ⅲ) oxide family. Sci Rep 5: 15091. https://doi.org/10.1038/srep15091 doi: 10.1038/srep15091
|
| [26] | Chirita M, Grozescu I (2009) Fe2O3-Nanoparticles, physical properties and their photochemical and photo electrochemical applications. Chem Bull 54: 1-8. |
| [27] |
Ding Y, Morber JR, Snyder RL, et al. (2007) Nanowire structural evolution from Fe3O4 to ε-Fe2O3. Adv Funct Matter 17: 1172-1178. https://doi.org/10.1002/adfm.200601024 doi: 10.1002/adfm.200601024
|
| [28] |
Yu Q, Meng X, Wang T, et al. (2015) Hematite films decorated with nanostructured ferric oxyhydroxide as photoanodes for efficient and stable photoelectrochemical water splitting. Adv Funct Mater 25: 2686-2692. https://doi.org/10.1002/adfm.201500383 doi: 10.1002/adfm.201500383
|
| [29] |
Tronc E, Chaneac C, Jolivet JP (1998) Structural and magnetic characterization of ɛ-Fe2O3. J Solid State Chem 139: 93-104. https://doi.org/10.1006/jssc.1998.7817 doi: 10.1006/jssc.1998.7817
|
| [30] |
Yoshikiyo M, Yamada K, Namai A, et al. (2012) Study of the electronic structure and magnetic properties of ε-Fe2O3 by first-principles calculation and molecular orbital calculations. J Phys Chem C 116: 8688-8691. https://doi.org/10.1021/jp300769z doi: 10.1021/jp300769z
|
| [31] |
Wang L, Wang Y, Zhang M, et al. (2019) Three-dimensional microstructure of ε‑Fe2O3 crystals in ancient chinese sauce glaze porcelain revealed by focused ion beam scanning electron microscopy. Anal Chem 91: 13054-13061. https://doi.org/10.1021/acs.analchem.9b03244 doi: 10.1021/acs.analchem.9b03244
|
| [32] |
Yusuf SM, Mukadama MD, Teresa JMD, et al. (2010) Structural and magnetic properties of amorphous iron oxide. Physica B 405: 1202-1206. https://doi.org/10.1016/j.physb.2009.11.040 doi: 10.1016/j.physb.2009.11.040
|
| [33] | Signorini L, Pasquini L, Savini L, et al. (2003) Size-dependent oxidation in iron/iron oxide core-shell nanoparticles. Phys Rev B 195423. https://doi.org/10.1103/PhysRevB.68.195423 |
| [34] |
Townsend TK, Sabio EM, Browning ND, et al. (2011) Photocatalytic water oxidation with suspended alpha-Fe2O3 particles-effects of nano scaling. Energy Environ Sci 4: 4270-4275. https://doi.org/10.1039/C1EE02110A doi: 10.1039/C1EE02110A
|
| [35] |
Yen FS, Chen WC, Yang JM, et al. (2002) Crystallite size variations of nano sized Fe2O3 powders during γ-to α-phase transformation. Nano Lett 2: 245-252. https://doi.org/10.1021/nl010089m doi: 10.1021/nl010089m
|
| [36] |
Wheeler DA, Wang G, Ling Y, et al. (2012) Nanostructured hematite: synthesis, characterization, charge carrier dynamics, and photoelectrochemical properties. Energy Environ Sci 5: 6682-6702. https://doi.org/10.1039/C2EE00001F doi: 10.1039/C2EE00001F
|
| [37] |
Machala L, Tucek J, Zboril R (2011) Polymorphous transformations of nanometric iron (Ⅲ) oxide: A review. Chem Mater 23: 3255-3272. https://doi.org/10.1021/cm200397g doi: 10.1021/cm200397g
|
| [38] |
Tucek J, Zboril R, Namai A, et al. (2010) ɛ-Fe2O3: An advanced nanomaterial exhibiting giant coercive field, millimeter-wave ferromag-netic resonance, and magnetoelectric coupling. Chem Mater 22: 6483-6505. https://doi.org/10.1021/cm101967h doi: 10.1021/cm101967h
|
| [39] |
Yamada K, Tokoro H, Yoshikiyo M, et al. (2012) The phase transition of ɛ-InxFe2−xO3 nanomagnets with a large thermal hysteresis loop. J Appl Phys 111: 07B506. https://doi.org/10.1063/1.3672075 doi: 10.1063/1.3672075
|
| [40] |
Lindgren T, Wang H, Beermann N, et al. (2002) Aqueous photoelectrochemistry of hematite nanorod array. Sol Energy Mater Sol Cells 71: 231-243. https://doi.org/10.1016/S0927-0248(01)00062-9 doi: 10.1016/S0927-0248(01)00062-9
|
| [41] |
Li Y, Wang Z, Liu R (2021) Superparamagnetic-Fe2O3/Fe3O4 heterogeneous nanoparticles with enhanced biocompatibility. Nanomaterials 11: 834. https://doi.org/10.3390/nano11040834 doi: 10.3390/nano11040834
|
| [42] |
Husain H, Hariyanto B, Sulthonul M, et al. (2018) Local structure examination of mineral-derived Fe2O3 powder by Fe K-edge EXAFS and XANES. IOP Conference Series: Materials Science and Engineering 367: 012027. https:// doi:10.1088/1757-899X/367/1/012027. doi: 10.1088/1757-899X/367/1/012027
|
| [43] |
Demangeat E, Pédrot M, Dia A, et al. (2018) Colloidal and chemical stabilities of iron oxide nanoparticles in aqueous solutions: the interplay of structural, chemical and environmental drivers. Environ Sci Nano 5: 992-1001. https://doi.org/10.1039/C7EN01159H doi: 10.1039/C7EN01159H
|
| [44] |
Schaetz A, Reiser O, Stark W (2010) Nanoparticles as semi-heterogeneous catalyst supports. Chem Eur J 16: 8950-8967. https://doi.org/10.1002/chem.200903462 doi: 10.1002/chem.200903462
|
| [45] |
Vayssieres L, Beermann N, Lindquist SE, et al. (2001) Controlled aqueous chemical growth of oriented three-dimensional crystalline nanorod arrays: application to iron (Ⅲ) oxides. Chem Mater 13: 233-235. https://doi.org/10.1021/cm001202x doi: 10.1021/cm001202x
|
| [46] |
Beermann N, Vayssieres L, Lindquist SE, et al. (2000) Photoelectrochemical studies of oriented nanorod thin films of hematite. J Electrochem Soc 147: 2456-2461. https://doi.org/10.1149/1.1393553 doi: 10.1149/1.1393553
|
| [47] |
Vayssieres L, Sathe C, Butorin SM, et al. (2005) One-dimensional quantum-confinement effect in α-Fe2O3 ultrafine nanorod arrays. Adv Mater 17: 2320-2323. https://doi.org/10.1002/adma.200500992 doi: 10.1002/adma.200500992
|
| [48] |
Erlebach A, Kurland HD, Grabow J, et al. (2015) Structure evolution of nanoparticulate Fe2O3. Nanoscale 7: 2960-2969. https://doi.org/10.1039/C4NR06989G doi: 10.1039/C4NR06989G
|
| [49] |
Touileb K, Hedhibi A, Djoudjou R, et al. (2019) Mixing design for ATIG morphology and microstructure study of 316L stainless steel. Eng Technol Appl Sci Res 9: 3990-3997. https://doi.org/10.48084/etasr.2665 doi: 10.48084/etasr.2665
|
| [50] |
Chandrasekar G, Kailasanathan C, Vasundara M (2018) Investigation on un-peened and laser shock peened dissimilar weldments of Inconel 600 and AISI 316L fabricated using activated-TIG welding technique. J Manuf Process 35: 466-478. https://doi.org/10.1016/j.jmapro.2018.09.004 doi: 10.1016/j.jmapro.2018.09.004
|
| [51] |
Iglesias O, Labarta A (2001) Finite-size and surface effects in maghemite nanoparticles: Monte Carlo simulations. Phys Rev B 63: 184416. https://doi.org/10.1103/PhysRevB.63.184416 doi: 10.1103/PhysRevB.63.184416
|
| [52] |
Hoang VV, Khanh BTHL (2009) Static and thermodynamic properties of liquid and amorphous Fe2O3 nanoparticles. J Phys Condens Matter 21: 075103. https://doi.org/10.1088/0953-8984/21/7/075103 doi: 10.1088/0953-8984/21/7/075103
|
| [53] |
Zhonghua W, Lin G, Qianshu L, et al. (1999) Surface atomic structures of Fe2O3 nanoparticles coated with cetyltrimethyl ammonium bromide and sodium dodecyl benzene sulphonate: an extended x-ray absorption fine-structure study. J Phys Condens Matter 11: 4961-4970. https://doi.org/10.1088/0953-8984/11/26/301 doi: 10.1088/0953-8984/11/26/301
|
| [54] |
Chen LX, Liu T, Thurnauer MC, et al. (2002) Fe2O3 nanoparticle structures investigated by x-ray absorption near-edge structure, surface modifications, and model calculations. J Phys Chem B 106: 8539-8546. https://doi.org/10.1021/jp025544x doi: 10.1021/jp025544x
|
| [55] |
Khanh BTHL, Hoang VV, Zung H (2008) Structural properties of amorphous Fe2O3 nanoparticles. Eur Phys J D 49: 325-332. https://doi.org/10.1140/epjd/e2008-00168-1 doi: 10.1140/epjd/e2008-00168-1
|
| [56] |
Kelm K, Mader W (2005) Synthesis and structural analysis of ε-Fe2O3. Z Anorg Allg Chem 631: 2383-2389. https://doi.org/10.1002/zaac.200500283 doi: 10.1002/zaac.200500283
|
| [57] |
Lee S, Xu H (2016) Size-dependent phase map and phase transformation kinetics for nanometric iron (Ⅲ) oxides (γ → ε →α pathway). J Phys Chem 120: 13316-13322. https://doi.org/10.1021/acs.jpcc.6b05287 doi: 10.1021/acs.jpcc.6b05287
|
| [58] |
Belashchenko DK (1997) Computer simulation of the structure and properties of non-crystalline oxides. Russ Chem Rev 66: 733-762. https://doi.org/10.1070/RC1997v066n09ABEH000236 doi: 10.1070/RC1997v066n09ABEH000236
|
| [59] | Mahmoudi M, Stroeve P, Milani AS, et al. (2011) Superparamagnetic Iron Oxide Nanoparticles: Synthesis, Surface Engineering, Cytotoxicity and Biomedical Applications, New York: Nova Science Publishers. |
| [60] |
Muñoz JLG, Romaguera A, Fauth F, et al. (2017) Unveiling a new high-temp erature ordered magnetic phase in ε-Fe2O3. Chem Mater 29: 9705-9713. https://doi.org/10.1021/acs.chemmater.7b03417 doi: 10.1021/acs.chemmater.7b03417
|
| [61] |
Dejoie C, Sciau P, Li W, et al. (2014) Learning from the past: rare ε-Fe2O3 in the ancient black-glazed Jian (Tenmoku) wares. Sci Rep 4: 4941. https://doi.org/10.1038/srep04941 doi: 10.1038/srep04941
|
| [62] |
Xu H, Lee S, Xu H (2017) Luogufe ngite: a new nano-mineral of Fe2O3 polymorph with giant coercive field. Am Mineral 102: 711-719. https://doi.org/10.2138/am-2017-5849 doi: 10.2138/am-2017-5849
|
| [63] |
Wang X, Zhou W (2002) Glass transition of microtome-sliced thin films. Macromolecules 35: 6747-6750. https://doi.org/10.1021/ma020291r doi: 10.1021/ma020291r
|
| [64] |
Schuller J, Melnichenko YB, Richert R, et al. (1994) Dielectric studies of the glass transition in porous media. Phys Rev Lett 73: 2224-2228. https://doi.org/10.1103/PhysRevLett.73.2224 doi: 10.1103/PhysRevLett.73.2224
|
| [65] |
Zhang Z, Zhao M, Jiang Q (2001) Glass transition thermodynamics of organic nanoparticles. Physica B 293: 232-236. https://doi.org/10.1016/S0921-4526(00)00564-0 doi: 10.1016/S0921-4526(00)00564-0
|
| [66] |
Alcoutlabi M, McKenna GB (2005) Effects of confinement on material behavior at the nanometre size scale. J Phys Condens Matter 17: 461-524. https://doi.org/10.1088/0953-8984/17/15/R01 doi: 10.1088/0953-8984/17/15/R01
|
| [67] |
Jackson CL, McKenna GB (1996) Vitrification and crystallization of organic liquids confined to nanoscale pores. Chem Mater 8: 2128-2137. https://doi.org/10.1021/cm9601188 doi: 10.1021/cm9601188
|
| [68] |
Dung NT (2020) Factors affecting the earth's surface on heterogeneous dynamics of CaSiO3 material. Mater Sci Eng B 260: 114648. https://doi.org/10.1016/j.mseb.2020.114648 doi: 10.1016/j.mseb.2020.114648
|
| [69] |
Tuan TQ, Dung NT (2019) Molecular dynamics studies the effects of the earth's surface depth on the heterogeneous kinetics of MgSiO3. Results Phys 15: 102671. https://doi.org/10.1016/j.rinp.2019.102671 doi: 10.1016/j.rinp.2019.102671
|
| [70] |
Dung NT, Cuong NC, Van DQ (2019) Molecular dynamics studies the effect of structure MgSiO3 bulk on formation process geology of the Earth. Int J Comput Mater Sci Eng 8: 1950011. https://doi.org/10.1142/S2047684119500118 doi: 10.1142/S2047684119500118
|
| [71] |
Zarringhalam M, Ahmadi-Danesh-Ashtiani H, Toghraie D, et al. (2019) The effects of suspending copper nanoparticles into argon base fluid inside a microchannel under boiling flow condition by using of molecular dynamic simulation. J Mol Liq 293: 111474. https://doi.org/10.1016/j.molliq.2019.111474 doi: 10.1016/j.molliq.2019.111474
|
| [72] |
Javadzadegan A, Joshaghani M, Moshfegh A, et al. (2020) Accurate meso-scale simulation of mixed convective heat transfer in a porous media for a vented square with hot elliptic obstacle: an LBM approach. Physica A 537: 122439. https://doi.org/10.1016/j.physa.2019.122439 doi: 10.1016/j.physa.2019.122439
|
| [73] |
Hadipeykani M, Aghadavoudi F, Toghraie D (2020) A molecular dynamics simulation of the glass transition temperature and volumetric thermal expansion coefficient of thermoset polymer based epoxy nanocomposite reinforced by CNT: a statistical study. Physica A 546: 123995. https://doi.org/10.1016/j.physa.2019.123995 doi: 10.1016/j.physa.2019.123995
|
| [74] |
Dung NT, Van CL, Tălu S (2022) Molecular dynamics simulation of bulk Cu material under various factors. Appl Sci 12: 4437. https://doi.org/10.3390/app12094437. doi: 10.3390/app12094437
|
| [75] |
Koparde VN, Cummings PT (2005) Molecular dynamics simulation of titanium dioxide nanoparticle sintering. J Phys Chem B 109: 24280-24287. https://doi.org/10.1021/jp054667p doi: 10.1021/jp054667p
|
| [76] |
Song P, Wen D (2010) Molecular dynamics simulation of the sintering of metallic nanoparticles, J Nanopart Res 12: 823-829. https://doi.org/10.1007/s11051-009-9718-7 doi: 10.1007/s11051-009-9718-7
|
| [77] |
Harris RA (2019) Chemotherapy drug temozolomide adsorbed onto iron-oxide (Fe3O4) nanoparticles as nanocarrier: A simulation study. J Mol Liq 288: 111084. https://doi.org/10.1016/j.molliq.2019.111084 doi: 10.1016/j.molliq.2019.111084
|
| [78] |
McWilliams RS, Dylan KS, Jon HE, et al. (2012) Phase transformations and metallization of magnesium oxide at high pressure and temperature. Science 338: 1330-1333. https://doi.org/10.1126/science.1229450 doi: 10.1126/science.1229450
|
| [79] |
Spaulding DK, McWilliams RS, Jeanloz R, et al. (2017) Evidence for a phase transition in silicate melt at extreme pressure and temperature conditions. Phys Rev Lett 108: 065701. https://doi.org/10.1103/PhysRevLett.108.065701 doi: 10.1103/PhysRevLett.108.065701
|
| [80] |
Sans JA, Monteseguro V, Garbarino G, et al. (2018) Stability and nature of the volume collapse of ε-Fe2O3 under extreme conditions. Nature communications 9: 4554. https://doi.org/10.1038/s41467-018-06966-9 doi: 10.1038/s41467-018-06966-9
|
Figures(11) / Tables(4)

Dung Nguyen Trong, Van Cao Long, Phu Nguyen Dang, Ştefan Ţălu. A molecular dynamics study concerning the effect of high-temperature and high-pressure on the structure and phase transition of Fe2O3 material[J]. AIMS Materials Science, 2022, 9(3): 406-429. doi: 10.3934/matersci.2022024


 DownLoad: