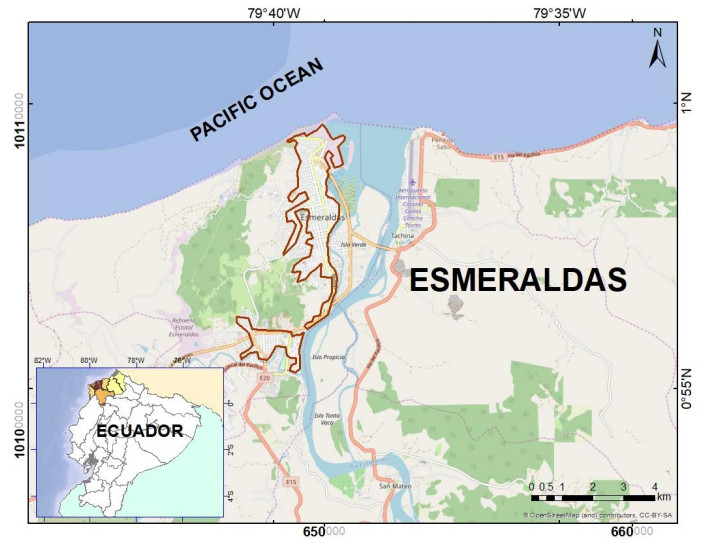
The current study investigated the probable impact from a tsunami to a populated area located along the northwest ecuadorian coast, specifically in the key oil-industrial city of esmeraldas. a numerical tsunami simulation was performed considering the seismological and tectonic aspects of the area. The damage probability was calculated using fragility functions (ffs). Briefly, 16 cases of source models with slightly different fault parameters were tested, where one was selected as the worst scenario of tsunami inundation. This scenario was a hypothetic earthquake case (mw 8.7) located in front of esmeraldas city, approximately 100 km offshore along the ecuador—colombia trench, with three shallow fault segments (top depth of 10 km), a strike aligned with the trench axis, a middle dip angle of 28°, assuming large slips of 5 to 15 m, and a rake angle of 90°. The results from the numerical simulation were comparable to a similar study previously conducted and with those of historically documented data. The tsunami damage estimation using FFs resulted in estimated damages of 50% and 44% in exposed buildings and population, respectively. Results also showed that the most impacted areas were located next to the coastal shoreline and river. tourism, oil exports, and port activities, in general, would be affected in this scenario; thus, compromising important industries that support the national budget. Results from this study would assist in designing or improving tsunami risk reduction strategies, disaster management, use of coastal zones, and planning better policies.
Citation: Teresa Vera San Martín, Leonardo Gutierrez, Mario Palacios, Erick Mas, Adriano Bruno, Shunichi Koshimura. Tsunami damage estimation in Esmeraldas, Ecuador using fragility functions[J]. AIMS Geosciences, 2021, 7(4): 669-694. doi: 10.3934/geosci.2021040
The current study investigated the probable impact from a tsunami to a populated area located along the northwest ecuadorian coast, specifically in the key oil-industrial city of esmeraldas. a numerical tsunami simulation was performed considering the seismological and tectonic aspects of the area. The damage probability was calculated using fragility functions (ffs). Briefly, 16 cases of source models with slightly different fault parameters were tested, where one was selected as the worst scenario of tsunami inundation. This scenario was a hypothetic earthquake case (mw 8.7) located in front of esmeraldas city, approximately 100 km offshore along the ecuador—colombia trench, with three shallow fault segments (top depth of 10 km), a strike aligned with the trench axis, a middle dip angle of 28°, assuming large slips of 5 to 15 m, and a rake angle of 90°. The results from the numerical simulation were comparable to a similar study previously conducted and with those of historically documented data. The tsunami damage estimation using FFs resulted in estimated damages of 50% and 44% in exposed buildings and population, respectively. Results also showed that the most impacted areas were located next to the coastal shoreline and river. tourism, oil exports, and port activities, in general, would be affected in this scenario; thus, compromising important industries that support the national budget. Results from this study would assist in designing or improving tsunami risk reduction strategies, disaster management, use of coastal zones, and planning better policies.

| [1] | Gupta HK, Gahalaut VK (2013) Three Great Tsunamis: Lisbon(1755) Sumatra-Andaman (2004) and Japan(2011), Springer Briefs in Earth Science, Springer. |
| [2] | Levin B, Nosov M (2016) Physics of tsunamis, Springer. 399. |
| [3] | IOC, Tsunami Glossary, 2013, Unesco: Paris, 45. |
| [4] | Levin B, Nosov M (2009) Physics of Tsunamis, Springer. 327. |
| [5] | Bryan E (2014) Tsunami The Underrated Hazard, Springer-Praxis. |
| [6] |
Geist EL (2002) Complex earthquake rupture and local tsunamis. J Geophys Res 107: 2086. doi: 10.1029/2000JB000139

|
| [7] | Rooney A (2012) Tsunami! (NATURE'S FURY), Encyclopedia Britannica, Inc. |
| [8] | Tolkova E (2018) Tsunami Propagation In Tidal Rivers. Sringer Briefs in Earth Sciences, Springer, 123. |
| [9] | USGS, Search Earthquake Catalog, 2019. Available from: https://earthquake.usgs.gov/earthquakes/search/. |
| [10] |
Otero LJ, Restrepo JC, Gonzalez M (2014) Tsunami hazard assessment in the southern Colombian Pacific basin and a proposal to regenerate a previous barrier island as protection. Nat Hazards Earth Sys Sci 14: 1155-1168. doi: 10.5194/nhess-14-1155-2014
|
| [11] |
Chlieh M, Mothes PA, Nocquet JM, et al. (2014) Distribution of discrete seismic asperities and aseismic slip along the Ecuadorian megathrust. Earth Planet Sci Lett 400: 292-301. doi: 10.1016/j.epsl.2014.05.027
|
| [12] |
Ioualalen M, Monfret T, Béthoux N, et al. (2014) Tsunami mapping in the Gulf of Guayaqui, Ecuador, due to local seismicity. Mar Geophys Res 35: 361-378. doi: 10.1007/s11001-014-9225-9
|
| [13] |
Ye L, Kanamori H, Avouac JP, et al. (2016) The 16 April 2016, M W 7.8 (M S 7.5) Ecuador earthquake: A quasi-repeat of the 1942 M S 7.5 earthquake and partial re-rupture of the 1906 M S 8.6 Colombia-Ecuador earthquake. Earth Planet Sci Lett 454: 248-258. doi: 10.1016/j.epsl.2016.09.006
|
| [14] |
Bethoux N, Segovia M, Alvarez V, et al. (2011) Seismological study of the central Ecuadorian margin: Evidence of upper plate deformation. J South Am Earth Sci 31: 139-152. doi: 10.1016/j.jsames.2010.08.001
|
| [15] |
Yi L, Xu CJ, Wen YM, et al. (2018) Rupture process of the 2016 Mw 7.8 Ecuador earthquake from joint inversion of InSAR data and teleseismic P waveforms. Tectonophysics 722: 163-174. doi: 10.1016/j.tecto.2017.10.028
|
| [16] |
Collot JY, Ribodetti A, Agudelo W, et al. (2011) The South Ecuador subduction channel: Evidence for a dynamic mega-shear zone from 2D fine-scale seismic reflection imaging and implications for material transfer. J Geophys Res Solid Earth 116: 1-20. doi: 10.1029/2011JB008429
|
| [17] |
Gutscher MA, Malavieille J, Lallemand S, et al. (1999) Tectonic segmentation of the North Andean margin: impact of the Carnegie Ridge collision. Earth Planet Scie Lett 168: 255-270. doi: 10.1016/S0012-821X(99)00060-6
|
| [18] | Kanamori H, McNally K (1982) Variable Rupture Mode of the Subduction Zone along the Ecuador-Colombia Coast. Bull Seismol Soc Am 72: 1241-1253. |
| [19] | Arreaga P, Ortiz M, Farreras S (2006) Mapping the possible tsunami hazard as the first step towards a tsunami resistant community in Esmeraldas, Ecuador, Tsunamis Case Studies and Recent Developments, Springer: Netherlands, 203-215. |
| [20] | Chunga K, Toulkeridis T, Vear-Grunauer X, et al. (2017) Review of Earthquakes and Tsunami Records and Characterization of Capable Faults on the Northwestern Coast Of Ecuador. J Tsunami Soc Int 36: 100-127. |
| [21] | Contreras M (2014) Riesgo de tsunami en Ecuador. Ingenius 12: 68-75. |
| [22] | Espinoza J (1992) Terremotos tsunamigénicos en el Ecuador. Acta Oceanográfica del Pacífico 7: 21-28. |
| [23] |
Ioualalen M, Ratzov G, Collot J, et al. (2011) The tsunami signature on a submerged promontory: the case study of the Atacames Promontory, Ecuador. Geophys J Int 184: 680-688. doi: 10.1111/j.1365-246X.2010.04878.x
|
| [24] | Pararas C (2012) Potential of Tsunami Generation along the Colombia/Ecuador Subduction Margin and the Dolores-Guayaquil Mega-Thrust. J Tsunami Soc Int 31: 209-230. |
| [25] |
De Risi R, Goda K (2016) Probabilistic Earthquake-Tsunami Multi-Hazard Analysis: Application to the Tohoku Region, Japan. Front Built Environ 2: 19. doi: 10.3389/fbuil.2016.00025
|
| [26] |
Koshimura S, Namegaya Y, Yanagisawa H (2009) Tsunami Fragility—A New Measure to Identify Tsunami Damage. J Disaster Res 4: 479-488. doi: 10.20965/jdr.2009.p0479
|
| [27] | Macabuag J (2017) Tsunami Damage Prediction for Buildings: Development of Methods for Empirical and Analytical Fragility Function Derivation, Department of Civil, Environmental and Geomatic Engineering, University College London. |
| [28] |
Mas E, Koshimura S, Suppasri A, et al. (2012) Developing Tsunami fragility curves using remote sensing and survey data of the 2010 Chilean Tsunami in Dichato. Nat Hazards Earth Sys Sci 8: 2689-2697. doi: 10.5194/nhess-12-2689-2012
|
| [29] | Vera T (2015) Tsunami Damage Estimation in Esmeraldas, Ecuador Using Tsunami Fragility Functions, Tsukuba, Japan, 59. |
| [30] |
Charvet I, Suppasri A, Imamura F (2014) Empirical fragility analysis of building damage caused by the 2011 Great East Japan tsunami in Ishinomaki city using ordinal regression, and influence of key geographical features. Stoch Environ Res Risk Assess 28: 1853-1867. doi: 10.1007/s00477-014-0850-2
|
| [31] |
Reese S, Bradley B, Bind J, et al. (2011) Empirical building fragilities from observed damage in the 2009 South Pacific tsunami. Earth Sci Rev 107: 156-173. doi: 10.1016/j.earscirev.2011.01.009
|
| [32] |
Alam MS, Barbosa AR, Scott MH, et al. (2018) Development of Physics-Based Tsunami Fragility Functions Considering Structural Member Failures. J Struct Eng 144: 04017221. doi: 10.1061/(ASCE)ST.1943-541X.0001953
|
| [33] |
Attary N, van de Lindt JW, Unnikrishnan VU, et al. (2017) Methodology for Development of Physics-Based Tsunami Fragilities. J Struct Eng 143: 12. doi: 10.1061/(ASCE)ST.1943-541X.0001715
|
| [34] |
Dias WPS, Yapa HD, Peiris LMN (2009) Tsunami vulnerability functions from field surveys and Monte Carlo simulation. Civ Eng Environ Syst 26: 181-194. doi: 10.1080/10286600802435918
|
| [35] | Karafagka S, Fotopoulou S, Pitilakis K (2016) Tsunami fragility curves for seaport buildings and warehouses. Nat Hazards Infrastruct, 28-30. |
| [36] | Kircher CA, Bouabid J (2014) New Building Damage and Loss Functions for Tsunami. Tenth U S Nat Conf Earthquake Eng. |
| [37] |
Nanayakkara KIU, Dias WPS (2015) Fragility curves for structures under tsunami loading. Nat Hazards 80: 471-486. doi: 10.1007/s11069-015-1978-1
|
| [38] |
Park S, van de Lindt JW, Cox D, et al. (2012) Successive Earthquake-Tsunami Analysis to Develop Collapse Fragilities. J Earthquake Eng 16: 851-863. doi: 10.1080/13632469.2012.685209
|
| [39] |
Petrone C, Rossetto T, Goda K (2017) Fragility assessment of a RC structure under tsunami actions via nonlinear static and dynamic analyses. Eng Struct 136: 36-53. doi: 10.1016/j.engstruct.2017.01.013
|
| [40] |
Medina S, Lizarazo-Marriaga J, Estrada M, et al. (2019) Tsunami analytical fragility curves for the Colombian Pacific Coast: A reinforced concrete building example. Eng Struct 196: 109309. doi: 10.1016/j.engstruct.2019.109309
|
| [41] |
Belliazzi S, Lignola GP, Di Ludovico M, et al. (2021) Preliminary tsunami analytical fragility functions proposal for Italian coastal residential masonry buildings. Structures 31: 68-79. doi: 10.1016/j.istruc.2021.01.059
|
| [42] | Ferrotto MF, Cavaleri L (2021) Masonry structures: A proposal of analytical generation of fragility functions for tsunami impact—Application to the Mediterranean coasts. Eng Struct 242. |
| [43] | INEC, INEC presenta sus proyecciones poblacionales cantonales 2010-2020. 2010. Available from: https://www.ecuadorencifras.gob.ec/inec-presenta-sus-proyecciones-poblacionales-cantonales/. |
| [44] |
Prezzi C, Silberleigt V (2015) Seismic hazards along Ecuador, Perú and northern Chile (South America). Nat Hazards 79: 1159-1175. doi: 10.1007/s11069-015-1900-x
|
| [45] |
Yoshimoto M, Kumagai H, Acero W, et al. (2017) Depth-dependent rupture mode along the Ecuador-Colombia subduction zone. Geophys Res Lett 44: 2203-2210. doi: 10.1002/2016GL071929
|
| [46] | Social, Sistema de Indicadores Sociales del Ecuador. 2019. Available from: http://www.siise.gob.ec/siiseweb/. |
| [47] | Poulard S (2012) REDATAM +SP, CEPAL. Available from: https://www.cepal.org/es/temas/redatam/acerca-redatam. |
| [48] |
Luque A, Edwards GAS, Lalande C (2012) The local governance of climate change: new tools to respond to old limitations in Esmeraldas, Ecuador. Local Environ 18: 738-751. doi: 10.1080/13549839.2012.716414
|
| [49] | MINTUR, Boletín de Estadísticas-Turísticas 2012-2016. 2017. Ministerio de Turismo del Ecuador. |
| [50] | INEC, Presentacion Esmeraldas Censo económico 2011. 2011. Available from: https://anda.inec.gob.ec/anda/index.php/catalog/586/related_materials. |
| [51] | Valdivia G (2018) "Wagering Life" in the Petro-City: Embodied Ecologies of Oil Flow, Capitalism, and Justice in Esmeraldas, Ecuador. Ann Am Assoc Geogr 108: 549-557. |
| [52] | Bank EC (2018) Reporte de Sector Petrolero. Ⅱ trimestre de 2018, Publicaciones económicas, Ecuadorian Central Bank: Ecuador. |
| [53] | Bank EC (2017) Reporte de Sector Petrolero. IV trimestre de 2017, Publicaciones económicas, Ecuadorian Central Bank: Ecuador. |
| [54] | MINTUR (2018) Perfiles de Turismo Internacional 2017,152. |
| [55] | INEC (2010) CPV Interactivo para Investigadores y Académicos: Glosario de Términos Censales*, INEC, 15. |
| [56] |
Dominey-Howes D, Papathoma M (2007) Validating a Tsunami Vulnerability Assessment Model (the PTVA Model) Using Field Data from the 2004 Indian Ocean Tsunami. Nat Hazards 40: 113-136. doi: 10.1007/s11069-006-0007-9
|
| [57] | Turismo MD (2017) Boletín de Estadísticas Turisticas, 2012-2016. 179. |
| [58] |
Kendrick E, Bevis M, Smalley Jr R, et al. (2003) The Nazca-South America Euler vector and its rate of change. J South Am Earth Sci 16: 125-131. doi: 10.1016/S0895-9811(03)00028-2
|
| [59] |
Gailler A, Charvis P, Flueh ER (2007) Segmentation of the Nazca and South American plates along the Ecuador subduction zone from wide angle seismic profiles. Earth Planet Sci Lett 260: 444-464. doi: 10.1016/j.epsl.2007.05.045
|
| [60] |
DeMets C, Gordon RG, Argus DF, et al. (1990) Current plate motions. Geophys J Int 101: 425-478. doi: 10.1111/j.1365-246X.1990.tb06579.x
|
| [61] |
Ruff LJ, Kanamori H (1980) Seismicity and the subduction process. Phys Earth Planet Inter 23: 240-252. doi: 10.1016/0031-9201(80)90117-X
|
| [62] |
Collot JY, Charvis P, Gutscher MA, et al. (2002) Exploring the Ecuador-Colombia Active Margin and Interplate Seismogenic Zone. EOS 23: 185-190. doi: 10.1029/2002EO000120
|
| [63] |
Proust JN, Martillo C, Michaud F, et al. (2016) Subduction of seafloor asperities revealed by a detailed stratigraphic analysis of the active margin shelf sediments of Central Ecuador. Mar Geol 380: 345-362. doi: 10.1016/j.margeo.2016.03.014
|
| [64] | Collot JY, Michaud F, Alvarado A, et al. (2009) Visión general de la morfologia submarina del margen convergente de Ecuador-Sur de Colombia: Implicaciones sobre la transferencia de masa y la edad de la subducción de la Cordillera de Carnegie. 47-74. |
| [65] |
Bilek SL (2010) Invited review paper: Seismicity along the South American subduction zone: Review of large earthquakes, tsunamis, and subduction zone complexity. Tectonophysics 495: 2-14. doi: 10.1016/j.tecto.2009.02.037
|
| [66] |
Parra H, Benito MB, Gaspar-Escribano JM (2016) Seismic hazard assessment in continental Ecuador Parra. Bull Earthquake Eng 14: 2129-2159. doi: 10.1007/s10518-016-9906-7
|
| [67] | Swenson J, Beck S (1996) Historical 1942 Ecuador and 1942 Peru Subduction Earthquakes, and Earthquake cycles along Colombia-Ecuador and Peru Subduction segments. Pageoph 146: 35. |
| [68] | Arreaga P (2004) Análisis de riesgo por tsunamis en la ciudad de Esmeraldas, Escuela Superior Politécnica del Litoral: Guayaquil-Ecuador, 320. |
| [69] | Segovia M (2001) El sismo de Bahía del 4 de agosto de 1998: Caracterización del mecanismo de ruptura y análisis de la sismicidad en la zona costera. Titulo de Ingeniera Geologia tesis: Escuela Politecnica Nacional, Quito, Ecuador. Available from: https://bibdigital.epn.edu.ec/. |
| [70] |
Nocquet JM, Jarrin P, Vallee M, et al. (2016) Supercycle at the Ecuadorian subduction zone revealed after the 2016 Pedernales earthquake. Nat Geosci 10: 145-149. doi: 10.1038/ngeo2864
|
| [71] |
Vaca S, Vallee M, Nocquet JM, et al. (2018) Recurrent slow slip events as a barrier to the northward rupture propagation of the 2016 Pedernales earthquake (Central Ecuador). Tectonophysics 724-725: 80-92. doi: 10.1016/j.tecto.2017.12.012
|
| [72] | Contreras M (2013) Chronology of tsunamis in Ecuador from 1586 to 2012. Revista La Técnica 11: 50-59. |
| [73] |
Papazachos BC, Scordilis ME, Panagiotopoulos DG, et al. (2001) Global Relations Between Seismic Fault Parameteres and Moment Magnitude of Earthquakes. Bull Geol Soc Greece 36: 1482-1489. doi: 10.12681/bgsg.16538
|
| [74] |
Jimenez C, Moggiano N, Mas E, et al. (2013) Seismic Source of 1746 Callao Earthquake from Tsunami Numerical Modeling. J Disaster Res 8: 266-273. doi: 10.20965/jdr.2013.p0266
|
| [75] | Imamura F, Yalciner CA, Ozyurt G (1995) Tsunami Modelling Manual. IOC Int Train Course Tsunami Numer Modell, 58. |
| [76] |
Okada Y (1985) Surface deformation due to shear and tensile faults in a half-space. Bull Seismol Soc Am 75: 1135-1154. doi: 10.1785/BSSA0750041135
|
| [77] |
Tanioka Y, Satake K (1996) Tsunami generation by horizontal displacement of ocean bottom. Geophys Res Lett 15: 861-864. doi: 10.1029/96GL00736
|
| [78] | Arreaga P (2015) Tsunami Inundation Modeling and Hazard Mapping of the South Coast of Ecuador. National Graduate Institute for Policy Studies. Building Reserch Institute, 73. |
| [79] | Charvet I, Macabuag J, Rossetto T (2017) Estimating Tsunami-Induced Building Damage through Fragility Functions: Critical Review and Research Needs. Front Built Environ 3. |
| [80] |
Suppasri A, Mas E, Charvet I, et al. (2013) Building damage characteristics based on surveyed data and fragility curves of the 2011 Great East Japan tsunami. Nat Hazards 66: 319-341. doi: 10.1007/s11069-012-0487-8
|
| [81] |
Koshimura S, Oie T, Yanagisawa H, et al. (2009) Developing Fragility Functions for Tsunami Damage Estimation Using Numerical Model and Post-Tsunami Data from Banda Aceh, Indonesia. Coastal Eng J 51: 243-273. doi: 10.1142/S0578563409002004
|
| [82] | UNDRR. Terminology|PreventionWeb.net. 2020. Available from: https://digitallibrary.un.org/record/857333. |
| [83] | Shi P, Kasperson R (2015) World Atlas of Natural Disaster Risk, BNUP-Springer, 381. |
| [84] |
Rehman, K, Cho YS (2016) Building Damage Assessment Using Scenario Based Tsunami Numerical Analysis and Fragility Curves. Water 8: 109. doi: 10.3390/w8030109
|
| [85] | Suppasri A, Mas E, Koshimura S, et al. (2012) Developing Tsunami Fragility Curves from the Surveyed Data of the 2011 Great East Japan Tsunami in Sendai and Ishinomaki Plains. Coastal Eng J 54: 1250008. |
| [86] | SGR (2012) Tsunami Inundation Charts. Available from: http://www.gestionderiesgos.gob.ec/wp-content/uploads/downloads/2013/12/Muisne.pdf. |
| [87] | Cruz M, Acosta M, Vasquez N (2005) Riesgos por Tsunami en la Costa ecuatoriana, Nacional del Ecuador del Instituto Panamericano de Geografia e Historia, Organizacion de Estados Americanos, OEA. Publicaciones de geofísica. |
| [88] | INEC (2010) Censo de Población y Vivienda. Available from: https://www.ecuadorencifras.gob.ec/base-de-datos-censo-de-poblacion-y-vivienda-2010/. |
| [89] |
Vera San Martín T, Rodriguez Rosado G, Arreaga Vargas P, et al. (2018) Population and building vulnerability assessment by possible worst-case tsunami scenarios in Salinas, Ecuador. Nat Hazards 93: 275-297. doi: 10.1007/s11069-018-3300-5
|


Figures(11) / Tables(4)

Teresa Vera San Martín, Leonardo Gutierrez, Mario Palacios, Erick Mas, Adriano Bruno, Shunichi Koshimura. Tsunami damage estimation in Esmeraldas, Ecuador using fragility functions[J]. AIMS Geosciences, 2021, 7(4): 669-694. doi: 10.3934/geosci.2021040


 DownLoad: