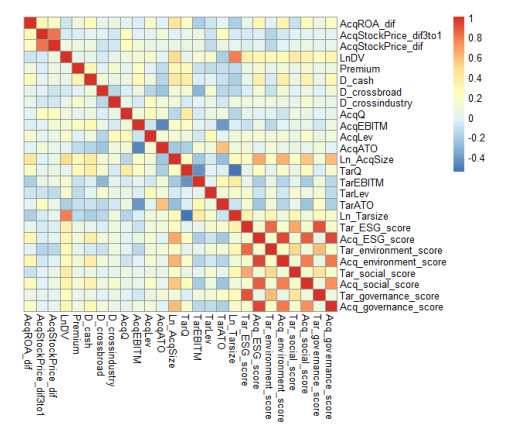
This research aims to study the impact of the target's ESG score on the acquirer's ROA and stock price changes after M&A deals by regressing the percentage change of acquirer's performance change against the target's ESG score and a set of control variables. This research contributes to the current literature by exploring whether this impact is influenced by the acquirer's pre-M&A ESG level through two methods—expressing the coefficient of the target's ESG as s linear function of the acquirer's ESG and dividing the deals into two groups according to the acquirer's ESG level. The result of shows that the impact of the target's ESG score on the acquirer's ROA change is significant at 95% confidence level and varies for low-ESG and high-ESG acquirer groups. Although most acquirers suffer ROA declines one year after the deals, the ROA decline is aggravated for low-ESG acquirers but is relieved for high-ESG acquirers. This discrepancy can be attributed to the temporary integration costs that are higher for low-ESG acquirers than for high-ESG peers if the target's ESG level increases. Besides, this research concludes that the impact of the target's ESG score does not have a significant impact on the acquirer's stock price change before and after an M&A deal.
Citation: Xuan Feng. The role of ESG in acquirers' performance change after M&A deals[J]. Green Finance, 2021, 3(3): 287-318. doi: 10.3934/GF.2021015
This research aims to study the impact of the target's ESG score on the acquirer's ROA and stock price changes after M&A deals by regressing the percentage change of acquirer's performance change against the target's ESG score and a set of control variables. This research contributes to the current literature by exploring whether this impact is influenced by the acquirer's pre-M&A ESG level through two methods—expressing the coefficient of the target's ESG as s linear function of the acquirer's ESG and dividing the deals into two groups according to the acquirer's ESG level. The result of shows that the impact of the target's ESG score on the acquirer's ROA change is significant at 95% confidence level and varies for low-ESG and high-ESG acquirer groups. Although most acquirers suffer ROA declines one year after the deals, the ROA decline is aggravated for low-ESG acquirers but is relieved for high-ESG acquirers. This discrepancy can be attributed to the temporary integration costs that are higher for low-ESG acquirers than for high-ESG peers if the target's ESG level increases. Besides, this research concludes that the impact of the target's ESG score does not have a significant impact on the acquirer's stock price change before and after an M&A deal.

| [1] |
Abbasi M, Nilsson F (2016) Developing environmentally sustainable logistics: Exploring themes and challenges from a logistics service providers' perspective. Transpo Res Part D 46: 273-283. doi: 10.1016/j.trd.2016.04.004

|
| [2] |
Arouri M, Pijourlet G (2017) CSR performance and the value of cash holdings: International evidence. J Bus Ethics 140: 263-284. doi: 10.1007/s10551-015-2658-5
|
| [3] |
Arouri M, Gomes M, Pukthuanthong K (2019) Corporate social responsibility and M&A uncertainty. J Corp Financ 56: 176-198. doi: 10.1016/j.jcorpfin.2019.02.002
|
| [4] |
Barney JB, Hansen MH (1994) Trustworthiness as a source of competitive advantage. Strat Manage J 15: 175-190. doi: 10.1002/smj.4250150912
|
| [5] |
Bettinazzi EL, Zollo M (2017) Stakeholder orientation and acquisition performance. Strat Manage J 38: 2465-2485. doi: 10.1002/smj.2672
|
| [6] |
Branco MC, Rodrigues LL (2006) Corporate social responsibility and resource-based perspectives. J Bus Ethics 69: 111-132. doi: 10.1007/s10551-006-9071-z
|
| [7] |
Cheng B, Ioannou I, Serafeim G (2014) Corporate social responsibility and access to finance. Strat Manage J 35: 1-23. doi: 10.1002/smj.2131
|
| [8] |
Deng X, Kang JK, Low BS (2013) Corporate social responsibility and stakeholder value maximization: Evidence from mergers. J Financ Econ 110: 87-109. doi: 10.1016/j.jfineco.2013.04.014
|
| [9] |
Edmans A, Goldstein I, Jiang W (2012) The real effects of financial markets: The impact of prices on takeovers. J Financ 67: 933-971. doi: 10.1111/j.1540-6261.2012.01738.x
|
| [10] | Feng X (2021) Economic and ecological optimization of the London urban logistics system considering infection risk during pandemic periods. Int J Supply Oper Manage 8: 114-133. |
| [11] |
Ferrell A, Liang H, Renneboog L (2016) Socially responsible firms. J Financ Econ 122: 585-606. doi: 10.1016/j.jfineco.2015.12.003
|
| [12] | Fombrun CJ, Gardberg NA, Barnett ML (2000) Opportunity platforms and safety nets: Corporate citizenship and reputational risk. Bus Society Rev 105. |
| [13] | Franklin J (2019) ESG now a key factor in M&A. Inter Financ Law Rev. |
| [14] | Franklin J (2020) ESG set to take larger role in M&A in 2020. Int Financ Law Rev. |
| [15] |
Fransen L (2013) The embeddedness of responsible business practice: Exploring the interaction between national-institutional environments and corporate social responsibility. J Bus Ethics 115: 213-227. doi: 10.1007/s10551-012-1395-2
|
| [16] | Freeman RE (1984) Strategic Management: A Stakeholder Approach (Pittman-Ballinger, Boston). |
| [17] | Gibson R, Krueger P, Schmidt PS (2019) ESG rating disagreement and stock returns. Swiss Financ Inst Res Pap, 19-67. |
| [18] |
Gillan SL, Koch A, Starks LT (2021) Firms and social responsibility: A review of ESG and CSR research in corporate finance. J Corp Financ, 101889. doi: 10.1016/j.jcorpfin.2021.101889
|
| [19] |
Godfrey PC (2005) The relationship between corporate philanthropy and shareholder wealth: A risk management perspective. Acad Manage Rev 30: 777-798. doi: 10.5465/amr.2005.18378878
|
| [20] |
Gomes M, Marsat, S. (2018). Does CSR impact premiums in M&A transactions? Financ Res Lett 26: 71-80. doi: 10.1016/j.frl.2017.12.005
|
| [21] |
Ioannou I, Serafeim G (2012) What drives corporate social performance? The role of nation-level institutions. J Int Bus Stud 43: 834-864. doi: 10.1057/jibs.2012.26
|
| [22] |
Liang H, Renneboog L (2017) On the foundations of corporate social responsibility. J Financ 72: 853-910. doi: 10.1111/jofi.12487
|
| [23] | Liang H, Renneboog L, Vansteenkiste C (2017) Cross-Border Acquisitions and Employee-Engagement. Eur Corp Governance Institute (ECGI)-Finance Working Paper, 496. |
| [24] |
Manocha P, Srai JS (2020) Exploring Environmental Supply Chain Innovation in M&A. Sustainability 12: 10105. doi: 10.3390/su122310105
|
| [25] | Manocha P, Srai J, Kumar M (2016) Understanding the role of Sustainability in Mergers & Acquisitions from the perspective of Supply Chain Management-How green is the deal, In 20th Cambridge International Manufacturing Symposium. Available from: https: //doi. org/10.17863/CAM (Vol. 6150). |
| [26] |
Martínez-Ferrero J, Banerjee S, García-Sánchez IM (2016) Corporate social responsibility as a strategic shield against costs of earnings management practices. J Bus Ethics 133: 305-324. doi: 10.1007/s10551-014-2399-x
|
| [27] |
Ng AC, Rezaee Z (2015) Business sustainability performance and cost of equity capital. J Corp Financ 34: 128-149. doi: 10.1016/j.jcorpfin.2015.08.003
|
| [28] |
Rao C, Goh M, Zhao Y, et al. (2015) Location selection of city logistics centers under sustainability. Transp Res Part 36: 29-44. doi: 10.1016/j.trd.2015.02.008
|
| [29] | Rydell A, Leucht A (2020) Looking behind the curtain: Exploring the role and content of ESG in M&A Due Diligence. |
| [30] |
Salvi A, Petruzzella F, Giakoumelou A (2018) Green M&A deals and bidders' value creation: the role of sustainability in post-acquisition performance. Int Bus Res 11: 96-105. doi: 10.5539/ibr.v11n7p96
|
| [31] | Sargan JD (1958) The estimation of economic relationships using instrumental variables. Econometrica, 393-415. |
| [32] | Stock JH, Yogo M (2005) Testing for weak instruments in linear IV regression. Identif Inference Econometric Models 80: 1. |
| [33] |
Tampakoudis I, Anagnostopoulou E (2020) The effect of mergers and acquisitions on environmental, social and governance performance and market value: Evidence from EU acquirers. Bus Strat Environ 29: 1865-1875. doi: 10.1002/bse.2475
|
| [34] | United Nations (2004) Who cares wins: Connecting financial markets to a changing world. New York. |
Figures(1) / Tables(9)

Xuan Feng. The role of ESG in acquirers' performance change after M&A deals[J]. Green Finance, 2021, 3(3): 287-318. doi: 10.3934/GF.2021015


 DownLoad: