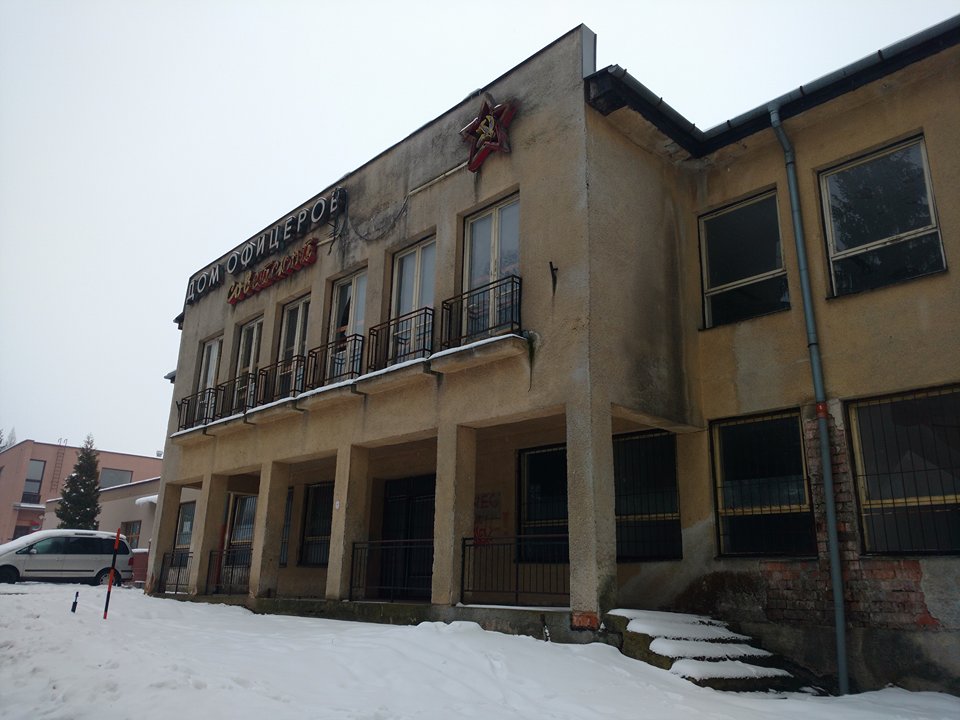
Cultural landscape is a concept that characterizes the diversity of forms, urban structure, historical value and symbolic function, reflecting the fact that a cultural landscape is a materialized system that carries a variety of verbal, visual and physical aspects of human existence. This scientific paper is based on a definition of cultural landscape that consists of cultural layers which are often associated with the memory of place, and our research is based on Taylor's definition and exploration of cultural landscapes. In terms of the linear dimension of human history, cultures interact, sometimes destroy and forget, but at the same time, the cultural layers are stacked, layered and acquired in various forms and features. The methodology is based on a qualitative case study with focus on challenges connected with transformation and recovery of area that carries traumatic legacy of the past. In the conclusion, the state of historical revitalization is presented.
Citation: Jana Pecnikova. Speaking territories in the cultural landscape: Challenges of transformation in the Central Europe[J]. Urban Resilience and Sustainability, 2023, 1(4): 251-259. doi: 10.3934/urs.2023016
Cultural landscape is a concept that characterizes the diversity of forms, urban structure, historical value and symbolic function, reflecting the fact that a cultural landscape is a materialized system that carries a variety of verbal, visual and physical aspects of human existence. This scientific paper is based on a definition of cultural landscape that consists of cultural layers which are often associated with the memory of place, and our research is based on Taylor's definition and exploration of cultural landscapes. In terms of the linear dimension of human history, cultures interact, sometimes destroy and forget, but at the same time, the cultural layers are stacked, layered and acquired in various forms and features. The methodology is based on a qualitative case study with focus on challenges connected with transformation and recovery of area that carries traumatic legacy of the past. In the conclusion, the state of historical revitalization is presented.

| [1] | Taylor K (2012) Landscape and meaning: Context for a global discourse on cultural landscape values. Managing Cultural Landscapes. Available from: http://hdl.handle.net/1885/59693. |
| [2] | Taylor K (2014) Cities as cultural landscapes. In: Bandarin, F., Van Oers, R., Reconnecting the City: The Historic Urban Landscape Approach and the Future of Urban Heritage, 172–202. https://doi.org/10.1002/9781118383940.ch7 |
| [3] | Taylor K, Clair AS, Mitchell NJ (2015) Conserving Cultural Landscapes: Challenges and New Directions. New York: Routledge. |
| [4] | Oevermann H, Mieg HA (2015) Industrial Heritage Sites in Transformation. New York: Routledge. |
| [5] | Collavitti AM (2018) Urban Heritage Management. Switzerland: Springer, Cham. https://doi.org/10.1007/978-3-319-72338-9 |
| [6] | Ogawa Y (2019) The Memory Police. New York: Pantheon. |
| [7] | Assman A (2011) Cultural Memory and Western Civilization. Cambridge: Cambridge University Press. |
| [8] | Macdonald S (2013) Memorylands. London: Routledge. |
| [9] | Czepczynski M (2012) Cultural Landscapes of Post-Socialist Countries. Dorchester: Ashgate. |
| [10] | Kubicki P, Mach E (2022) European Cities in the Process of Constructing and Transmitting European Cultural Heritage. Kraków: Księgarnia Akademicka Publishing. https://doi.org/10.12797/9788381386708 |
| [11] | Kostialova K (2015) The main aspects of the transformation of town disctricts—Podborova housing estate. Kulturna a socialna diverzita na Slovensku/Cultural and Social Diversity in Slovakia. Banska Bystrica: Belianum. |

Figures(2)
Jana Pecnikova. Speaking territories in the cultural landscape: Challenges of transformation in the Central Europe[J]. Urban Resilience and Sustainability, 2023, 1(4): 251-259. doi: 10.3934/urs.2023016


 DownLoad: