The province of Zamboanga del Norte is endowed with ample water resources which are the primary sources of domestic water for the people in the area. Nevertheless, these water resources face several man-made and industrial activities that generate unwanted pollution. In this study, the physicochemical characteristics of the major rivers of Zamboanga del Norte, Philippines were investigated to know the present condition and assess the overall water quality. The physicochemical parameters that were investigated includes pH, temperature, nitrate-nitrogen (NO3-N), total suspended solids (TSS), total phosphates ($ {\mathrm{P}\mathrm{O}}_{4}^{2-} $) and total mercury (Hg). The results of the water analyses revealed that the pH, temperature, nitrate as NO3-N and the total Hg were within the acceptable range prescribed by Department of Environment and Natural Resources (DENR) and World Health Organization (WHO). However, there was a significant increase of the total suspended solids (TSS) concentrations of 138±58.9,142.3±36.6 and 243±9.5 mg/L, respectively from downstream, midstream and upstream of Sindangan river. The total suspended solids (TSS) concentrations exceeded the permissible limit of 25–65 mg/L recommended by Department of Environment and Natural Resources (DENR). Furthermore, the data showed that all values of the total phosphates for all the river systems exceeded the prescribed limit. Thus, to maintain the water quality of these rivers, proper monitoring and government intervention are very much required.
Citation: Romie D. Laranjo, Maria Rio A. Naguit, Farida C. Jamolod, Kristine Gladys E. Jambre, Norma I. Cabornay, Victor B. Bernido, Maricon Denber S. Gahisan. Evaluation of the physicochemical parameters on the water quality of the major rivers of Zamboanga del Norte, Philippines[J]. AIMS Environmental Science, 2023, 10(3): 382-397. doi: 10.3934/environsci.2023022
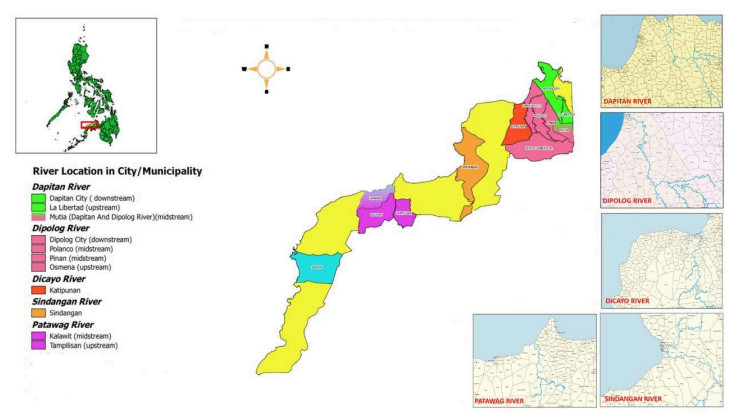
The province of Zamboanga del Norte is endowed with ample water resources which are the primary sources of domestic water for the people in the area. Nevertheless, these water resources face several man-made and industrial activities that generate unwanted pollution. In this study, the physicochemical characteristics of the major rivers of Zamboanga del Norte, Philippines were investigated to know the present condition and assess the overall water quality. The physicochemical parameters that were investigated includes pH, temperature, nitrate-nitrogen (NO3-N), total suspended solids (TSS), total phosphates ($ {\mathrm{P}\mathrm{O}}_{4}^{2-} $) and total mercury (Hg). The results of the water analyses revealed that the pH, temperature, nitrate as NO3-N and the total Hg were within the acceptable range prescribed by Department of Environment and Natural Resources (DENR) and World Health Organization (WHO). However, there was a significant increase of the total suspended solids (TSS) concentrations of 138±58.9,142.3±36.6 and 243±9.5 mg/L, respectively from downstream, midstream and upstream of Sindangan river. The total suspended solids (TSS) concentrations exceeded the permissible limit of 25–65 mg/L recommended by Department of Environment and Natural Resources (DENR). Furthermore, the data showed that all values of the total phosphates for all the river systems exceeded the prescribed limit. Thus, to maintain the water quality of these rivers, proper monitoring and government intervention are very much required.

| [1] |
Pleto J, Migo VP, Arboleda M (2020) Preliminary water and sediment quality assessment of the Meycauayan river segment of the Marilao-Meycauayan-Obando river system in Bulacan, the Philippines. J Health Pollut 10: 200609. https://doi.org/10.5696/2156-9614-10.26.200609 doi: 10.5696/2156-9614-10.26.200609

|
| [2] |
Uddin MJ, Jeong YK (2021) Urban river pollution in Bangladesh during last 40 years: potential public health and ecological risk, present policy, and future prospects toward smart water management. Heliyon, 7: e06107. https://doi.org/10.1016/j.heliyon.2021.e06107 doi: 10.1016/j.heliyon.2021.e06107
|
| [3] |
Bhutiani R, Ahamad F, Ram K (2021) Quality assessment of groundwater at Laksar Block, Haridwar in Uttarakhand, India using water quality index: a case study. J Appl Nat Sci 13: 197 - 203. https://doi.org/10.31018/jans.v13i1.2435 doi: 10.31018/jans.v13i1.2435
|
| [4] |
Rahmanian N, Ali SHB, Homayoonfard M, et al. (2015) Analysis of physiochemical parameters to evaluate the drinking water quality in the State of Perak, Malaysia. J Chem-Ny 2015: 1-10. https://doi.org/10.1155/2015/716125 doi: 10.1155/2015/716125
|
| [5] |
Haque MA, Jewel MAS, Sultana MP (2019) Assessment of physicochemical and bacteriological parameters in surface water of Padma River, Bangladesh. Appl Water Sci 9: 1-8. https://doi.org/10.1007/s13201-018-0885-5 doi: 10.1007/s13201-018-0885-5
|
| [6] | Campiseño S, Laranjo R (2010) Estimation of greenhouse gas (GHG) emission level from waste and garbage disposed in the coastal barangays of Dapitan city: implications to their waste management practices. E-Int Sci Res J 2: 309-314. |
| [7] |
Varol M, Tokatli C (2023) Evaluation of the water quality of a highly polluted stream with water quality indices and health risk assessment methods. Chemosphere 311: 1-10 https://doi.org/10.1016/j.chemosphere.2022.137096 doi: 10.1016/j.chemosphere.2022.137096
|
| [8] |
Githaiga KB, Njuguna SM, Gituru RW, Yan X (2021) Water quality assessment, multivariate analysis and human health risks of heavy metals in eight major lakes in Kenya. J Environ Man 297: 1-11 https://doi.org/10.1016/j.jenvman.2021.113410 doi: 10.1016/j.jenvman.2021.113410
|
| [9] |
Sood A, Singh KD, Pandey P, et al. (2008) Assessment of bacterial indicators and physicochemical parameters to investigate pollution status of Gangetic river system of Uttarakhand (India). Ecological Indicators 8: 709–717. http://dx.doi.org/10.1016/j.ecolind.2008.01.001 doi: 10.1016/j.ecolind.2008.01.001
|
| [10] | Udyavara V, Thangavel S, Venugopal MN (2019) Occurrence and distribution of pollution indicator bacteria in shellfish harvesting waters of Karnataka. Indian J Geo-Mar Sci 48: 217-222. |
| [11] | Pipes WO, (1981) Bacteriological indicators of pollution, Boca Raton, FL: CRC Press, 242. |
| [12] |
Biswas AK, Tortajada C (2019) Water quality management: a globally neglected issue. Int J Water Resour D 35: 913-916. https://doi.org/10.1080/07900627.2019.1670506 doi: 10.1080/07900627.2019.1670506
|
| [13] | WHO (2011) Guidelines for drinking - water quality (4th Ed.). Geneva, World Health Organization, 1-541. |
| [14] |
Clemente ED (2020) Evaluating the water quality contribution of Estero de Paco to Pasig River and Manila Bay, Philippines. E3S Web of Conferences 148: 1-7. https://doi.org/10.1051/e3sconf/202014 doi: 10.1051/e3sconf/202014
|
| [15] | Paringit EC, Rodriguez MS, Balicanta LP, et al. (2017) LiDAR surveys and flood mapping report of Silaga River. In: Paringit EC (Ed.), Flood Hazard Mapping of the Philippines using LiDAR, Quezon City: University of the Philippines Training Center for Applied Geodesy and Photogrammetry, 153. |
| [16] |
Worsfold PJ, Omaka ON, Gimbert LJ, et al. (2005) Sampling protocols and storage parameters in the analysis of phosphorus and nitrate samples in natural waters. Talanta 66: 273-293. https//doi.org/10.1016/j.talanta.2004.09.006. doi: 10.1016/j.talanta.2004.09.006
|
| [17] |
Prior H, Johnes PJ (2002) Regulation of surface water quality in a Cretaceous Chalk catchment, UK: an assessment of the relative importance of instream and wetland processes. Sci Total Environ 282-283: 159–174. https://doi.org/10.1016/S0048-9697(01)00950-0 doi: 10.1016/S0048-9697(01)00950-0
|
| [18] | Greenberg AE, Clesceri LS, Eaton AD (Eds.) (1992) Standard Methods for the Examination of Water and Wastewater 18th Edition, Method 4500-P D. Washington, DC: American Public Health Association, American Water Works Association, Water Environment Federation, 4-114. |
| [19] | United States Environmental Protection Agency (USEPA) (1971) Method 352.1. Available from: https://www.epa.gov/sites/default/files/2015-08/documents/method_352-1_1971.pdf |
| [20] | Weiner RF, Matthews RA (2003) Environmental Engineering 4th Ed, Burlington, MA: Butterworth-Heinemann, 94-96. |
| [21] | Baird RB, Eaton AD, Rice EW (Eds.) (2017) Standard Methods for the Examination of Water and Wastewater 23rd Edition, Method 2540-D. Washington, DC: American Public Health Association, American Water Works Association, Water Environment Federation, 188-189. https://doi.org/10.2105/SMWW.2882.002 |
| [22] | Department of Environment and Natural Resources (2016). DENR Administrative Order No. 2016-08. Water Quality Guidelines and General Effluent Standards of 2016. Available from: https://emb.gov.ph/wp-content/uploads/2019/04/DAO-2016-08_WATER-QUALITY-GUIDELINES-AND-GENERAL-EFFLUENT-STANDARDS.pdf. |
| [23] | Department of Environment and Natural Resources (2021). DENR Administrative Order No. 2021-19. Updated Water Quality Guidelines (WQG) and General Effluent Standards (GES) for Selected Parameters. Available from: https://emb.gov.ph/wp-content/uploads/2021/07/DAO-2021-19-UPDATED-WQG-AND-GES-FOR-SELECTED-PARAM.pdf |
| [24] |
Roy M, Shamim F, Chatterjee S (2021) Evaluation of physicochemical and biological parameters on the water quality of Shilabati River, West Bengal, India. Water Sci 35: 71-81. https://doi.org/10.1080/23570008.2021.1928902 doi: 10.1080/23570008.2021.1928902
|
| [25] |
Gupta N, Pandey P, Hussain J (2017) Effect of physicochemical and biological parameters on the quality of river water of Narmada, Madhya Pradesh, India. Water Sci 31: 11-23. http://dx.doi.org/10.1016/j.wsj.2017.03.002 doi: 10.1016/j.wsj.2017.03.002
|
| [26] | Edori OS (2020) Physical and chemical characteristics of water from Ede Onyima Creek, Okarki-Engenni, Rivers State, Nigeria. Chem Res J 5: 144-154. |
| [27] | United States Geological Survey (USGS) (2018) Temperature and water. Available from: https://www.usgs.gov/special-topics/water-science-school/science/temperature-and-water. |
| [28] |
Edori OS, Edori ES (2021) Evaluation of physicochemical characteristics of surface water from Orashi river, Rivers State, Southern Nigeria. Athens J Sci 8: 105-122. https://doi.org/10.30958/ajs.8-2-2 doi: 10.30958/ajs.8-2-2
|
| [29] |
Fathi E, Zamani-Ahmadmahmoodi R, Zare-Bidaki R (2018) Water quality evaluation using water quality index and multivariate methods, Beheshtabad river, Iran. Appl Water Sci 8: 210. https://doi.org/10.1007/s13201-018-0859-7 doi: 10.1007/s13201-018-0859-7
|
| [30] |
Mezgebe K, Gebrekidan A, Hadera A, et al. (2015) Assessment of physico-chemical parameters of Tsaeda Agam River in Mekelle City, Tigray, Ethiopia. B Chem Soc Ethiopia 29: 377-385. http://dx.doi.org/10.4314/bcse.v29i3.5. doi: 10.4314/bcse.v29i3.5
|
| [31] |
Bakure BZ, Fikadu S, Malu A (2020) Analysis of physicochemical water quality parameters for streams under agricultural, urban and forest land-use types: in the case of gilgel Gibe catchment, Southwest Ethiopia. Appl Water Sci 10: 234. https://doi.org/10.1007/s13201-020-01318-9 doi: 10.1007/s13201-020-01318-9
|
| [32] |
Paul, D (2017) Research on heavy metal pollution of river Ganga: a review. Ann Agrarian Sci 5: 278-286. http://dx.doi.org/10.1016/j.aasci.2017.04.001 doi: 10.1016/j.aasci.2017.04.001
|
| [33] |
Cabello CA, Canini ND, Lluisma BC (2022) Water quality assessment of Dodiongan Falls in Bonbonon, Iligan City, Philippines. AIMS Environ Sci 9: 526–537. https://doi.org/10.3934/environsci.2022031 doi: 10.3934/environsci.2022031
|

Figures(2) / Tables(4)

Romie D. Laranjo, Maria Rio A. Naguit, Farida C. Jamolod, Kristine Gladys E. Jambre, Norma I. Cabornay, Victor B. Bernido, Maricon Denber S. Gahisan. Evaluation of the physicochemical parameters on the water quality of the major rivers of Zamboanga del Norte, Philippines[J]. AIMS Environmental Science, 2023, 10(3): 382-397. doi: 10.3934/environsci.2023022


 DownLoad: