A study was carried to investigate by placing a side stream filter in a cooling tower to observe the water conservation in the system. For any coal based power plant cycles of concentration plays important role for water conservation. The cycles of concentration in cooling tower was increased by installation of membrane system. The drain of the side stream filter was disposed to effluent treatment plant (ETP), while the filtered water will be recycled to the cooling tower inlet. The water parameter was measured by using various flow rates, pressure, and other factors. Significant water savings were demonstrated in the pilot. Maximum make-up water and outflow were both reduced by 14% and 48%, respectively. To save the most water, permeate recovery must be as high as possible. Water savings were minimal due to silica scaling on the membranes. Selected membranes are capable of lower total dissolved system (TDS) rejection than the 88% of total required membranes in the primary study, which might help to save water. The increased energy consumed by membrane treatment was compensated for by lower water outlays. To prevent scaling antiscalent chemical with chemical dosing system was installed along with membrane system.
Citation: Chetan Dhokai, Ritesh Ramesh Palkar, Vicky Jain. Water saving in thermal power plant by use of membrane filter in cooling tower treatment[J]. AIMS Environmental Science, 2022, 9(3): 282-292. doi: 10.3934/environsci.2022020
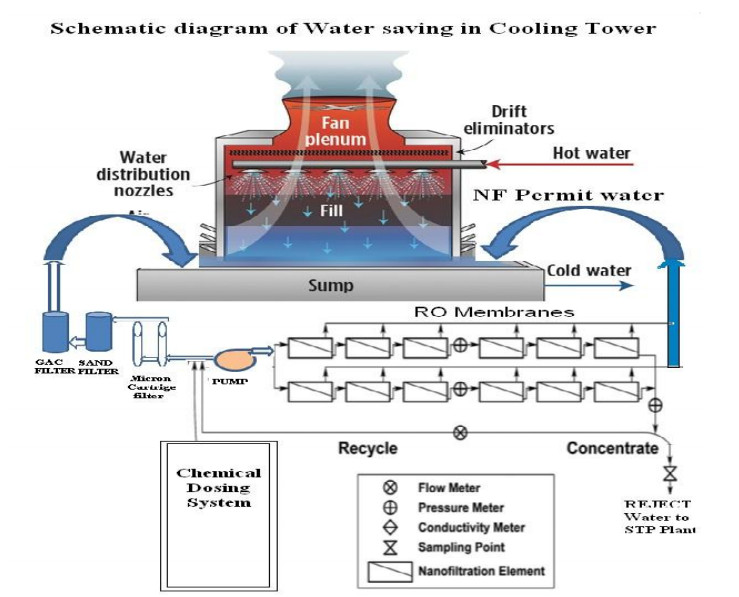
A study was carried to investigate by placing a side stream filter in a cooling tower to observe the water conservation in the system. For any coal based power plant cycles of concentration plays important role for water conservation. The cycles of concentration in cooling tower was increased by installation of membrane system. The drain of the side stream filter was disposed to effluent treatment plant (ETP), while the filtered water will be recycled to the cooling tower inlet. The water parameter was measured by using various flow rates, pressure, and other factors. Significant water savings were demonstrated in the pilot. Maximum make-up water and outflow were both reduced by 14% and 48%, respectively. To save the most water, permeate recovery must be as high as possible. Water savings were minimal due to silica scaling on the membranes. Selected membranes are capable of lower total dissolved system (TDS) rejection than the 88% of total required membranes in the primary study, which might help to save water. The increased energy consumed by membrane treatment was compensated for by lower water outlays. To prevent scaling antiscalent chemical with chemical dosing system was installed along with membrane system.

| [1] | EEA, OPOCE (2009) Water resources across Europe-confronting water scarcity and drought (EEA Report No. 2). European Environment Agency (EEA), Office for Official Publications of the European Communities (OPOCE), Copenhagen, Denmark. |
| [2] |
MurrantD, QuinnA, ChapmanL, et al. (2017) Water use of the UK thermal electricity generation fleet by 2050: Part 2 quantifying the problem. Energy Policy 108: 859-874. https://doi.org/10.1016/j.enpol.2017.03.047 doi: 10.1016/j.enpol.2017.03.047

|
| [3] |
Feeley TJ, Skone TJ, Stlegel GJ, et al. (2008) Water: a critical resource in the thermoelectric power industry. Energy 33: 1-11. https://doi.org/10.1016/j.energy.2007.08.007 doi: 10.1016/j.energy.2007.08.007
|
| [4] | Matson J, Harris, T (1979) Zero Discharge of Cooling Water by Side stream Softening. Water Pollution Control Federation 51: 2602-2614. |
| [5] | CutlerDS, DeanJD, DawJA, et al. (2019) Alternative Water Treatment Technologies for Cooling Tower Applications (No. NREL/TP-7A40-71845). National Renewable Energy Lab. (NREL), Golden, CO (United States). |
| [6] | Jones R(1991) Waste water purification system. Wastewater Resources Inc, USA. |
| [7] | NRC (2008) Desalination A National Perspective. The National Academies Press, Washington D. C, United States. |
| [8] |
Kumar P, Gupta P, Kumar S (2022) Comparing energy nexus efficiency of Energy Recovery Inc (ERI) over turbo pumps for cost saving of 12.6 MLD SWRO based desalination plant. Energy Nexus 5: 100015. https://doi.org/10.1016/j.nexus.2021.100015 doi: 10.1016/j.nexus.2021.100015
|
| [9] | Walton B (2010) The Price of Water: A Comparison of Water Rates. Usage in 30 U.S. Cities in, Circle of Blue. |
| [10] |
Shahzad MW, Burhan M, Ang L, et al. (2017) Energy-water-environment nexus underpinning future desalination sustainability. Desalination 413: 52-64. http: https://doi.org/10.1016/j.desal.2017.03.009 doi: 10.1016/j.desal.2017.03.009
|
| [11] |
Jensen Q, Macedonio CA, Drioli F (2015) Membrane technology for water production inagriculture: Desalination and wastewater reuse. Desalination 364: 17-32. https://doi.org/10.1016/j.desal.2015.03.001 doi: 10.1016/j.desal.2015.03.001
|
| [12] |
Hightower M, Pierce SA (2008) The energy challenge. Nature 452: 285-286. https://doi.org/10.1038/452285a doi: 10.1038/452285a
|
| [13] |
Sardari K, Fyfe P, Lincicome D, et al. (2018) Combined electrocoagulation andmembrane distillation for treating high salinity produced waters. J Membr Sci 564: 82-96. https://doi.org/10.1016/j.desal.2020.114886 doi: 10.1016/j.desal.2020.114886
|
| [14] |
Tzotzi C, Pahiadaki T, Yiantsios SG, et al. (2007) A study of CaCO3scale formation and inhibition in RO and NF membrane processes. J Membr Sci 296: 171-184. https://doi.org/10.1016/j.memsci.2007.03.031 doi: 10.1016/j.memsci.2007.03.031
|
| [15] |
Semiat R, Sutzkover I, Hasson D (2003) Characterization of the effectiveness of silicaanti-scalants. Desalination 159: 11-19. https://doi.org/10.1016/S0011-9164(03)90041-5 doi: 10.1016/S0011-9164(03)90041-5
|
| [16] |
Drak A, Glucina K, Busch M, et al. (2000) Laboratory technique for predicting the scaling propensity of RO feed waters. Desalination 132: 233-242. https://doi.org/10.21608/bfemu.2020.126197 doi: 10.21608/bfemu.2020.126197
|
| [17] |
Ravanchi MT, Kaghazchi T, KargariA (2009) Application of membrane separation processes in petrochemical industry: A review. Desalination 235: 199-244. https://doi.org/10.1016/j.desal.2007.10.042 doi: 10.1016/j.desal.2007.10.042
|
| [18] |
Jhaveri JH, Murthy ZVP (2016) A comprehensive review on anti-fouling nanocomposite membranes for pressure driven membrane separation processes. Desalination 379: 137-154. https://doi.org/10.1016/j.desal.2015.11.009 doi: 10.1016/j.desal.2015.11.009
|
| [19] |
Greenlee LF, Lawler DF, Freeman BD, et al. (2009) Reverse osmosis desalination: Water sources, technology, and today's challenges. Water Res 43: 2317-2348. http://dx.doi.org/10.1016/j.watres.2009.03.010 doi: 10.1016/j.watres.2009.03.010
|
| [20] |
Huang H, Schwab K, Jacangelo JG (2009) Pretreatment for Low Pressure Membranes in Water Treatment: A Review. Environ Sci Technol 43: 3011-3019. https://doi.org/10.1021/es802473r doi: 10.1021/es802473r
|
| [21] |
Liron S, Asher B, Chaim S (2017) Use of an integrated biophysical process for the treatment of halo- and nitro- organic wastes. AIMS Environmental Science 4: 523-539. https://doi.org/10.3934/environsci.2017.4.523 doi: 10.3934/environsci.2017.4.523
|
| [22] |
Kateřina S, Denisa P, Hana S, et al. (2016) Selective adhesion of wastewater bacteria to Pleurotus ostreatus mycelium in a trickle-bed bioreactor. AIMS Environmental Science 3: 395-407. https://doi.org/10.3934/environsci.2016.3.395 doi: 10.3934/environsci.2016.3.395
|
| [23] | Kretzschmar AL, Manefield M (2015) The role of lipids in activated sludge floc. formation. AIMS Environmental Science 2: 122-133. https://doi.org/10.3934.2015.2.122 |
| [24] |
Wen JF, Liu YJ, Tu YJ, et al. (2015) Energy and chemical efficient nitrogen removal at a full-scale MBR water reuse facility. AIMS Environmental Science 2: 42-55. https://doi.org/10.3934/environsci.2015.1.42 doi: 10.3934/environsci.2015.1.42
|
| [25] |
Naderi E, Azizivahed A, Asrari A (2022) A step toward cleaner energy production: A water saving-based optimization approach for economic dispatch in modern power systems. Electric Power Systems Research 4: 107689. https://doi.org/10.1016/j.epsr.2021.107689 doi: 10.1016/j.epsr.2021.107689
|


Figures(5) / Tables(4)

Chetan Dhokai, Ritesh Ramesh Palkar, Vicky Jain. Water saving in thermal power plant by use of membrane filter in cooling tower treatment[J]. AIMS Environmental Science, 2022, 9(3): 282-292. doi: 10.3934/environsci.2022020


 DownLoad: