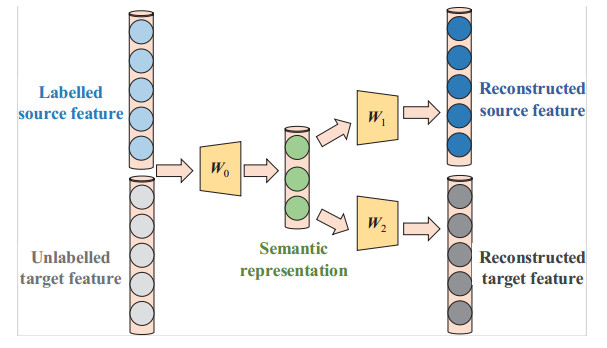
Zero-shot learning aims to transfer the model of labeled seen classes in the source domain to the disjoint unseen classes without annotations in the target domain. Most existing approaches generally consider directly adopting the visual-semantic projection function learned in the source domain to the target domain without adaptation. However, due to the distribution discrepancy between the two domains, it remains challenging in dealing with the projection domain shift problem. In this work, we formulate a novel bi-shifting semantic auto-encoder to learn the semantic representations of the target instances and reinforce the generalization ability of the projection function. The encoder aims at mapping the visual features into the semantic space by leveraging the visual features of target instances and is guided by the semantic prototypes of seen classes. While two decoders manage to respectively reconstruct the original visual features in the source and target domains. Thus, our model can capture the generalized semantic characteristics related with the seen and unseen classes to alleviate the projection function problem. Furthermore, we develop an efficient algorithm by the advantage of the linear projection functions. Extensive experiments on the five benchmark datasets demonstrate the competitive performance of our proposed model.
Citation: Yu Wang. Bi-shifting semantic auto-encoder for zero-shot learning[J]. Electronic Research Archive, 2022, 30(1): 140-167. doi: 10.3934/era.2022008
Zero-shot learning aims to transfer the model of labeled seen classes in the source domain to the disjoint unseen classes without annotations in the target domain. Most existing approaches generally consider directly adopting the visual-semantic projection function learned in the source domain to the target domain without adaptation. However, due to the distribution discrepancy between the two domains, it remains challenging in dealing with the projection domain shift problem. In this work, we formulate a novel bi-shifting semantic auto-encoder to learn the semantic representations of the target instances and reinforce the generalization ability of the projection function. The encoder aims at mapping the visual features into the semantic space by leveraging the visual features of target instances and is guided by the semantic prototypes of seen classes. While two decoders manage to respectively reconstruct the original visual features in the source and target domains. Thus, our model can capture the generalized semantic characteristics related with the seen and unseen classes to alleviate the projection function problem. Furthermore, we develop an efficient algorithm by the advantage of the linear projection functions. Extensive experiments on the five benchmark datasets demonstrate the competitive performance of our proposed model.

| [1] |
M. Everingham, S. M. Eslami, L. Gool, C. K. Williams, J. Winn, A. Zisserman, The pascal visual object classes challenge: a retrospective, Int. J. Comput. Vis., 111 (2015), 98–136. https://doi.org/10.1007/s11263-014-0733-5 doi: 10.1007/s11263-014-0733-5

|
| [2] | S. J. Dickinson, A. Leonardis, B. Schiele, M. J. Tarr, Object categorization: computer and human vision perspectives, Cambridge University Press, Cambridge, 2009. https://doi.org/10.1017/cbo9780511635465 |
| [3] |
X. Zhang, Y. H. Yang, Z. Han, H. Wang, C. Gao, Object class detection: a survey, ACM Comput. Surv., 46 (2013), 1–53. https://doi.org/10.1145/2522968.2522978 doi: 10.1145/2522968.2522978
|
| [4] |
Y. Li, S. Wang, Q. Tian, X. Ding, Feature representation for statistical-learning-based object detection: a review, Pattern Recognit., 48 (2015), 3542–3559. https://doi.org/10.1016/j.patcog.2015.04.018 doi: 10.1016/j.patcog.2015.04.018
|
| [5] |
Z. Zhao, P. Zheng, S. Xu, X. Wu, Object detection with deep learning: a review, IEEE Trans. Neural Netw. Learn. Syst., 30 (2019), 3212–3232. https://doi.org/10.1109/tnnls.2018.2876865 doi: 10.1109/tnnls.2018.2876865
|
| [6] |
K. Oksuz, B. C. Cam, S. Kalkan, E. Akbas, Imbalance problems in object detection: a review, IEEE Trans. Pattern Anal. Mach. Intell., 43 (2021), 3388–3415. https://doi.org/10.1109/tpami.2020.2981890 doi: 10.1109/tpami.2020.2981890
|
| [7] |
L. Liu, W. Ouyang, X. Wang, P. Fieguth, J. Chen, X. Liu, et al. Deep learning for generic object detection: a survey, Int. J. Comput. Vis., 128 (2020), 261–318. https://doi.org/10.1007/s11263-019-01247-4 doi: 10.1007/s11263-019-01247-4
|
| [8] |
S. Ghosh, N. Das, I. Das, U. Maulik, Understanding deep learning techniques for image segmentation, ACM Comput. Surv., 52 (2019), 1–35. https://doi.org/10.1145/3329784 doi: 10.1145/3329784
|
| [9] |
S. Minaee, Y. Y. Boykov, F. Porikli, A. J. Plaza, N. Kehtarnavaz, D. Terzopoulos, Image segmentation using deep learning: a survey, IEEE Trans. Pattern Anal. Mach. Intell., (2021). https://doi.org/10.1109/tpami.2021.3059968 doi: 10.1109/tpami.2021.3059968
|
| [10] |
R. Datta, D. Joshi, J. Li, J. Z. Wang, Image retrieval: ideas, influences, and trends of the new age, ACM Comput. Surv., 40 (2008), 1–60. https://doi.org/10.1145/1348246.1348248 doi: 10.1145/1348246.1348248
|
| [11] |
D. Zhang, M. M. Islam, G. Lu, A review on automatic image annotation techniques, Pattern Recognit., 45 (2012), 346–362. https://doi.org/10.1016/j.patcog.2011.05.013 doi: 10.1016/j.patcog.2011.05.013
|
| [12] |
X. Li, T. Uricchio, L. Ballan, M. Bertini, C. G. Snoek, A. D. Bimbo, Socializing the semantic gap: a comparative survey on image tag assignment, refinement, and retrieval, ACM Comput. Surv., 49 (2016), 1–39. https://doi.org/10.1145/2906152 doi: 10.1145/2906152
|
| [13] |
P. Wiriyathammabhum, D. Summers-Stay, C. Fermüller, Y. Aloimonos, Computer vision and natural language processing: recent approaches in multimedia and robotics, ACM Comput. Surv., 49 (2020), 1–44. https://doi.org/10.1145/3009906 doi: 10.1145/3009906
|
| [14] |
Y. Belinkov, J. Glass, Analysis methods in neural language processing: a survey, Trans. Assoc. Comput. Linguist., 7 (2019), 49–72. https://doi.org/10.1162/tacl_a_00254 doi: 10.1162/tacl_a_00254
|
| [15] |
K. Gauman, B. Leibe, Visual object recognition, Synth. Lect. Artif. Intell. Mach. Learn., 5 (2011), 1–181. https://doi.org/10.2200/S00332ED1V01Y201103AIM011 doi: 10.2200/S00332ED1V01Y201103AIM011
|
| [16] |
Y. Bengio, A. Courville, P. Vincent, Representation learning: a review and new perspectives, IEEE Trans. Pattern Anal. Mach. Intell., 35 (2013), 1798–1828. https://doi.org/10.1109/tpami.2013.50 doi: 10.1109/tpami.2013.50
|
| [17] | I. Goodfellow, Y. Bengio, A. Courville, Deep learning, MIT Press, Cambridge, 2016. |
| [18] |
G. Litjens, T. Kooi, B. E. Bejnordi, A. A. A. Setio, F. Ciompi, M. Ghafoorian, et al., A survey on deep learning in medical image analysis, Med. Image Anal., 42 (2017), 60–88. https://doi.org/10.1016/j.media.2017.07.005 doi: 10.1016/j.media.2017.07.005
|
| [19] |
J. Gu, Z. Wang, J. Kuen, L. Ma, A. Shahroudy, B. Shuai, et al., Recent advances in convolutional neural networks, Pattern Recognit., 77 (2018), 354–377. https://doi.org/10.1016/j.patcog.2017.10.013 doi: 10.1016/j.patcog.2017.10.013
|
| [20] | M. G. Kendall, A. Stuart, J. K. Ord, Kendall's advanced theory of statistics, 5$^{th}$ edition, Oxford University Press, Oxford, 1987. |
| [21] | J. Deng, W. Dong, R. Socher, L. Li, K. Li, F. Li, Imagenet: a large-scale hierarchical image database, in IEEE Conf. Comput. Vis. Pattern Recognit., IEEE, (2009), 248–255. https://doi.org/10.1109/cvpr.2009.5206848 |
| [22] | California Institute of Technology, The caltech-ucsd birds-200-2011 dataset, Computation & Neural Systems Technical Report of California Institute of Technology, 2011. Available from: http://www.vision.caltech.edu/visipedia/CUB-200-2011.html. |
| [23] |
Y. Wang, Q. Yao, J. T. Kwok, L. M. Ni, Generalizing from a few examples: a survey on few-shot learning, ACM Comput. Surv., 53 (2020), 1–34. https://doi.org/10.1145/3386252 doi: 10.1145/3386252
|
| [24] |
W. J. Scheirer, A. de Rezende Rocha, A. Sapkota, T. E. Boult, Toward open set recognition, IEEE Trans. Pattern Anal. Mach. Intell., 35 (2012), 1757–1772. https://doi.org/10.1109/tpami.2012.256 doi: 10.1109/tpami.2012.256
|
| [25] |
C. Geng, S. Huang, S. Chen, Recent advances in open set recognition: a survey, IEEE Trans. Pattern Anal. Mach. Intell., 43 (2021), 3614–3631. https://doi.org/10.1109/tpami.2020.2981604 doi: 10.1109/tpami.2020.2981604
|
| [26] |
I. Biederman, Recognition-by-components: a theory of human image understanding, Psychol. Rev., 94 (1987), 115–147. https://doi.org/10.1037/0033-295x.94.2.115 doi: 10.1037/0033-295x.94.2.115
|
| [27] |
C. H. Lampert, H. Nickisch, S. Harmeling, Attribute-based classification for zero-shot visual object categorization, IEEE Trans. Pattern Anal. Mach. Intell., 36 (2013), 453–465. https://doi.org/10.1109/tpami.2013.140 doi: 10.1109/tpami.2013.140
|
| [28] | W. Xu, Y. Xian, J. Wang, B. Schiele, Z. Akata, Attribute prototype network for zero-shot learning, preprint, arXiv: 2008.08290. |
| [29] |
S. Changpinyo, W. L. Chao, B. Gong, F. Sha, Classifier and exemplar synthesis for zero-shot learning, Int. J. Comput. Vis., 128 (2020), 166–201. https://doi.org/10.1007/s11263-019-01193-1 doi: 10.1007/s11263-019-01193-1
|
| [30] |
Z. Ji, H. Wang, Y. Pang, L. Shao, Dual triplet network for image zero-shot learning, Neurocomputing, 373 (2020), 90–97. https://doi.org/10.1016/j.neucom.2019.09.062 doi: 10.1016/j.neucom.2019.09.062
|
| [31] |
Y. Ma, X. Xu, F. Shen, H. Shen, Similarity preserving feature generating networks for zero-shot learning, Neurocomputing, 406 (2020), 333–342. https://doi.org/10.1016/j.neucom.2019.08.111 doi: 10.1016/j.neucom.2019.08.111
|
| [32] | M. M. Palatucci, D. A. Pomerleau, G. E. Hinton, T. Mitchell, Zero-shot learning with semantic output codes, in Ann. Conf. Neural Inf. Process. Syst., MIT Press, 22 (2009), 1410–1418. |
| [33] |
M. Johnson, M. Schuster, Q. V. Le, M. Krikun, Y. Wu, Z. Chen, et al., Google' s multilingual neural machine translation system: enabling zero-shot translation, Trans. Assoc. Comput. Linguist., 5 (2017), 339–351. https://doi.org/10.1162/tacl_a_00065 doi: 10.1162/tacl_a_00065
|
| [34] | N. Nakashole, R. Flauger, Knowledge distillation for bilingual dictionary induction, in Conf. Empirical Methods Nat. Language Process., ACL, (2017), 2497–2506. https://doi.org/10.18653/v1/d17-1264 |
| [35] | H. Larochelle, D. Erhan, Y. Bengio, Zero-data learning of new tasks, in AAAI Conf. Artif. Intell., AAAI, 1 (2008), 646–651. |
| [36] | C. H. Lampert, H. Nickisch, S. Harmeling, Learning to detect unseen object classes by between-class attribute transfer, in IEEE Conf. Comput. Vis. Pattern Recognit., IEEE, (2009), 951–958. https://doi.org/10.1109/cvpr.2009.5206594 |
| [37] | N. Mohammad, M. Tomas, B. Samy, S. Yoram, S. Jonathon, F. Andrea, et al., Zero-shot learning by convex combination of semantic embeddings, preprint, arXiv: 1312.5650. |
| [38] | A. Frome, G. S. Corrado, J. Shlens, S. Bengio, J. Dean, M. Ranzat, et al., Devise: a deep visual-semantic embedding model, in Ann. Conf. Neural Inform. Process. Syst., MIT Press, 2 (2013), 2121–2129. |
| [39] | R. Socher, M. Ganjoo, H. Sridhar, O. Bastani, C. D. Manning, A. Y. Ng, Zero-shot learning through cross-modal transfer, in Ann. Conf. Neural Inform. Process. Syst., MIT Press, 26 (2013), 935–943. |
| [40] | S. Reed, Z. Akata, H. Lee, B. Schiele, Learning deep representations of fine-grained visual descriptions, in IEEE Conf. Comput. Vis. Pattern Recognit., IEEE, (2016), 49–58. https://doi.org/10.1109/cvpr.2016.13 |
| [41] | Z. Akata, S. Reed, D. Walter, H. Lee, B. Schiele, Evaluation of output embeddings for fine-grained image classification, in IEEE Conf. Comput. Vis. Pattern Recognit., IEEE, (2015), 2927–2936. https://doi.org/10.1109/cvpr.2015.7298911 |
| [42] | Y. Xian, Z. Akata, G. Sharma, Q. Nguyen, M. Hein, B. Schiele, Latent embeddings for zero-shot classification, in IEEE Conf. Comput. Vis. Pattern Recognit., IEEE, (2016), 69–77. https://doi.org/10.1109/cvpr.2016.15 |
| [43] |
Y. Fu, T. M. Hospedales, T. Xiang, S. Gong, Transductive multi-view zero-shot learning, IEEE Trans. Pattern Anal. Mach. Intell., 37 (2015), 2332–2345. https://doi.org/10.1109/tpami.2015.2408354 doi: 10.1109/tpami.2015.2408354
|
| [44] |
S. Rahman, S. Khan, F. Porikli, A unified approach for conventional zero-shot, generalized zero-shot, and few-shot learning, IEEE Trans. Image Process., 27 (2018), 5652–5667. https://doi.org/10.1109/tip.2018.2861573 doi: 10.1109/tip.2018.2861573
|
| [45] | S. Daghaghi, T. Medini, A. Shrivastava, Sdm-net: a simple and effective model for generalized zero-shot learning, preprint, arXiv: 1909.04790. |
| [46] |
Z. Jia, Z. Zhang, L. Wang, C. Shan, T. Tan, Deep unbiased embedding transfer for zero-shot learning, IEEE Trans. Image Process., 29 (2019), 1958–1971. https://doi.org/10.1109/tip.2019.2947780 doi: 10.1109/tip.2019.2947780
|
| [47] | B. Romera-Paredes, P. H. S. Torr, An embarrassingly simple approach to zero-shot learning, in Int. Conf. Machine Learn., ACM, 37 (2015), 2152–2161. https://doi.org/10.1007/978-3-319-50077-5_2 |
| [48] | E. Kodirov, T. Xiang, S. Gong, Semantic autoencoder for zero-shot learning, in IEEE Conf. Comput. Vis. Pattern Recognit., IEEE, (2017), 3174–3183. https://doi.org/10.1109/cvpr.2017.473 |
| [49] | S. Changpinyo, W. L. Chao, B. Gong, F. Sha, Synthesized classifiers for zero-shot learning, in IEEE Conf. Comput. Vis. Pattern Recognit., IEEE, (2016), 5327–5336. https://doi.org/10.1109/cvpr.2016.575 |
| [50] | Y. Xian, T. Lorenz, B. Schiele, Z. Akata, Feature generating networks for zero-shot learning, in IEEE Conf. Comput. Vis. Pattern Recognit., IEEE, (2018), 5542–5551. https://doi.org/10.1109/cvpr.2018.00581 |
| [51] | H. Huang, C. Wang, P. S. Yu, C. Wang, Generative dual adversarial network for generalized zero-shot learning, in IEEE Conf. Comput. Vis. Pattern Recognit., IEEE, (2019), 801–810. https://doi.org/10.1109/cvpr.2019.00089 |
| [52] | S. Xu, Z. Gao, G. Xie, Bi-semantic reconstructing generative network for zero-shot learning, preprint, arXiv: 1912.03877. |
| [53] | Z. Ye, F. Lyu, L. Li, Q. Fu, J. Ren, F. Hu, Sr-gan: semantic rectifying generative adversarial network for zero-shot learning, in IEEE Int. Conf. Multimedia & Expo, IEEE, (2019), 85–90. https://doi.org/10.1109/icme.2019.00023 |
| [54] | Y. Zhu, M. Elhoseiny, B. Liu, X. Peng, A. Elgammal, A generative adversarial approach for zero-shot learning from noisy texts, in IEEE Conf. Comput. Vis. Pattern Recognit., IEEE, (2018), 1004–1013. https://doi.org/10.1109/cvpr.2018.00111 |
| [55] | A. Mishra, S. Krishna Reddy, A. Mittal, H. A. Murthy, A generative model for zero shot learning using conditional variational autoencoders, in IEEE Conf. Comput. Vis. Pattern Recognit., IEEE, (2018), 2188–2196. https://doi.org/10.1109/cvprw.2018.00294 |
| [56] | Z. Wan, D. Chen, Y. Li, X. Yan, J. Zhang, Y. Yu, et al., Transductive zero-shot learning with visual structure constraint, preprint, arXiv: 1901.01570. |
| [57] | M. Ye, Y. Guo, Zero-shot classification with discriminative semantic representation learning, in IEEE Conf. Comput. Vis. Pattern Recognit., IEEE, (2017), 7140–7148. https://doi.org/10.1109/cvpr.2017.542 |
| [58] |
Z. Akata, F. Perronnin, Z. Harchaoui, C. Schmid, Label-embedding for image classification, IEEE Trans. Pattern Anal. Mach. Intell., 38 (2016), 1425–1438. https://doi.org/10.1109/tpami.2015.2487986 doi: 10.1109/tpami.2015.2487986
|
| [59] |
Y. Yu, Z. Ji, X. Li, J. Guo, Z. Zhang, H. Ling, et al., Transductive zero-shot learning with a self-training dictionary approach, IEEE T. Cybern., 48 (2018), 2908–2919. https://doi.org/10.1109/tcyb.2017.2751741 doi: 10.1109/tcyb.2017.2751741
|
| [60] |
Y. Shi, W. Wei, Discriminative embedding autoencoder with a regressor feedback for zero-shot learning, IEEE Access, 8 (2020), 11019–11030. https://doi.org/10.1109/access.2020.2964613 doi: 10.1109/access.2020.2964613
|
| [61] | J. Song, C. Shen, Y. Yang, Y. Liu, M. Song, Transductive unbiased embedding for zero-shot learning, in IEEE Conf. Comput. Vis. Pattern Recognit., IEEE, (2018), 1024–1033. https://doi.org/10.1109/cvpr.2018.00113 |
| [62] | V. K. Verma, P. Rai, A simple exponential family framework for zero-shot learning, in Joint European Conference on Machine Learning and Knowledge Discovery in Databases, Springer, (2017), 792–808. https://doi.org/10.1007/978-3-319-71246-8_48 |
| [63] | M. Kan, S. Shan, X. Chen, Bi-shifting auto-encoder for unsupervised domain adaptation, in Int. Conf. Comput. Vis., IEEE, (2015), 3846–3854. https://doi.org/10.1109/cvpr.2017.547 |
| [64] | J. Zhang, W. Li, P. Ogunbona, Joint geometrical and statistical alignment for visual domain adaptation, in IEEE Conf. Comput. Vis. Pattern Recognit., IEEE, (2017), 1859–1867. https://doi.org/10.1109/cvpr.2017.547 |
| [65] | E. Kodirov, T. Xiang, Z. Fu, S. Gong, Unsupervised domain adaptation for zero-shot learning, in Int. Conf. Comput. Vis., IEEE, (2015), 2452–2460. https://doi.org/10.1109/iccv.2015.282 |
| [66] | Y. Liu, Q. Gao, J. Li, J. Han, L. Shao, Zero shot learning via low-rank embedded semantic autoencoder, in International Joint Conference on Artificial Intelligence, Morgan Kaufmann, (2018), 2490–2496. https://doi.org/10.24963/ijcai.2018/345 |
| [67] | Z. Zhang, V. Saligrama, Zero-shot learning via semantic similarity embedding, in Int. Conf. Comput. Vis., IEEE, (2015), 4166–4174. https://doi.org/10.1109/iccv.2015.474 |
| [68] | J. Li, M. Jin, K. Lu, Z. Ding, Z. Huang, Leveraging the invariant side of generative zero-shot learning, in IEEE Conf. Comput. Vis. Pattern Recognit., IEEE, (2019), 7394–7403. https://doi.org/10.1109/cvpr.2019.00758 |
| [69] | M. Radovanović, A. Nanopoulos, M. Ivanović, Hubs in space: popular nearest neighbors in high-dimensional data, J. Mach. Learn. Res., 11 (2010), 2487–2531. |
| [70] | L. Zhang, T. Xiang, S. Gong, Learning a deep embedding model for zero-shot learning, in IEEE Conf. Comput. Vis. Pattern Recognit., IEEE, (2017), 2021–2030. https://doi.org/10.1109/cvpr.2017.321 |
| [71] | Y. Shigeto, I. Suzuki, K. Hara, M. Shimbo, Y. Matsumoto, Ridge regression, hubness, and zero-shot learning, in Joint European Conference on Machine Learning and Knowledge Discovery in Databases, Springer, (2015), 135–151. https://doi.org/10.1007/978-3-319-23528-8_9 |
| [72] | Y. Wu, W. Cao, Y. Liu, Z. Ming, J. Li, B. Lu, Semantic auto-encoder with l2-norm constraint for zero-shot learning, in Int. Conf. Mach. Learn. Comput., ACM, (2021), 101–105. https://doi.org/10.1145/3457682.3457699 |
| [73] | Y. Li, D. Wang, H. Hu, Y. Lin, Y. Zhuang, Zero-shot recognition using dual visual-semantic mapping paths, in IEEE Conf. Comput. Vis. Pattern Recognit., IEEE, (2017), 3279–3287. https://doi.org/10.1109/cvpr.2017.553 |
| [74] | P. Lancaster, M. Tismenetsky, The theory of matrices: with applications, 2$^{nd}$ edition, Academic Press, Amsterdam, 1985. |
| [75] |
Y. Xian, C. H. Lampert, B. Schiele, Z. Akata, Zero-shot learning – a comprehensive evaluation of the good, the bad and the ugly, IEEE Trans. Pattern Anal. Mach. Intell., 41 (2018), 2251–2265. https://doi.org/10.1109/tpami.2018.2857768 doi: 10.1109/tpami.2018.2857768
|
| [76] | A. Farhadi, I. Endres, D. Hoiem, D. Forsyth, Describing objects by their attributes, in IEEE Conf. Comput. Vis. Pattern Recognit., IEEE, (2009), 1778–1785. https://doi.org/10.1109/cvpr.2009.5206772 |
| [77] |
G. Patterson, C. Xu, H. Su, J. Hays, The sun attribute database: beyond categories for deeper scene understanding, Int. J. Comput. Vis., 108 (2014), 59–81. https://doi.org/10.1007/s11263-013-0695-z doi: 10.1007/s11263-013-0695-z
|
| [78] | C. Szegedy, W. Liu, Y. Jia, P. Sermanet, S. Reed, D. Anguelov, et al., Going deeper with convolutions, in IEEE Conf. Comput. Vis. Pattern Recognit., IEEE, (2015), 1–9. https://doi.org/10.1109/cvpr.2015.7298594 |
| [79] | S. M. Shojaee, M. S. Baghshah, Semi-supervised zero-shot learning by a clustering-based approach, preprint, arXiv: 1605.09016. |
| [80] |
Y. Guo, G. Ding, J. Han, Y. Gao, Zero-shot learning with transferred samples, IEEE Trans. Image Process., 26 (2017), 3277–3290. https://doi.org/10.1109/tip.2017.2696747 doi: 10.1109/tip.2017.2696747
|
| [81] | Y. Annadani, S. Biswas, Preserving semantic relations for zero-shot learning, in IEEE Conf. Comput. Vis. Pattern Recognition, IEEE, (2018), 7603–7612. https://doi.org/10.1109/cvpr.2018.00793 |
| [82] |
H. Zhang, Y. Long, Y. Guan, L. Shao, Triple verification network for generalized zero-shot learning, IEEE Trans. Image Process., 28 (2019), 506–517. https://doi.org/10.1109/tip.2018.2869696 doi: 10.1109/tip.2018.2869696
|
| [83] | L. Van der Maaten, G. Hinton, Visualizing data using t-sne, J. Mach. Learn. Res., 9 (2008), 2579–2605. |
| [84] |
Z. Zhang, Y. Li, J. Yang, Y. Li, M. Gao, Cross-layer autoencoder for zero-shot learning, IEEE Access, 7 (2019), 167584–167592. https://doi.org/10.1109/access.2019.2953454 doi: 10.1109/access.2019.2953454
|
Figures(8) / Tables(6)
Yu Wang. Bi-shifting semantic auto-encoder for zero-shot learning[J]. Electronic Research Archive, 2022, 30(1): 140-167. doi: 10.3934/era.2022008


 DownLoad: