Citation: R. Citarella, M. Lepore, M. Perrella, C. Calì. Multiple crack propagation by DBEM in a riveted lap-joint[J]. AIMS Materials Science, 2016, 3(4): 1577-1586. doi: 10.3934/matersci.2016.4.1577

| [1] | Citarella R (2015) Residual strength evaluation by DBEM for a cracked lap joint. Frattura ed Integrità Strutturale 35: 523–533. |
| [2] | Citarella R (2016) Multiple crack propagation by DBEM in a riveted butt-joint: a simplified bidimensional approach. Frattura ed Integrità Strutturale 36: 160–167. |
| [3] |
Citarella R (2011) MSD Crack propagation on a repaired aeronautic panel by DBEM. Adv Eng Softw 42: 887–901. doi: 10.1016/j.advengsoft.2011.02.014

|
| [4] | Citarella R, Cricrì G, Armentani E (2013) Multiple crack propagation with Dual Boundary Element Method in stiffened and reinforced full scale aeronautic panels. Key Eng Mater 560: 129–155. |
| [5] |
Sepe R, Armentani E, Lascio PD, et al. (2015) Crack Growth Behavior of Welded Stiffened Panel. Procedia Eng 109: 473–483. doi: 10.1016/j.proeng.2015.06.251
|
| [6] |
Silva LFM, Gonçalves JPM, Oliveira FMF, et al. (2000) Multiple-site damage in riveted lap-joints: experimental simulation and finite element prediction. Int J Fatigue 22: 319–338. doi: 10.1016/S0142-1123(99)00129-2
|
| [7] |
Citarella R, Carlone P, Sepe R, et al. (2016) DBEM crack propagation in friction stir welded aluminum joints. Adv Eng Softw 101: 50–59. doi: 10.1016/j.advengsoft.2015.12.002
|
| [8] | Lamanna G, Sepe R, Pozzi A (2014) Tensile testing of hybrid composite joints. Appl Mech Mater 575: 452–456. |
| [9] |
Hong HK, Chen JT (1988) Derivations of Integral Equations of Elasticity. ASCE J Eng Mech 114: 1028–1044. doi: 10.1061/(ASCE)0733-9399(1988)114:6(1028)
|
| [10] |
Chen JT, Hong HK (1999) Review of dual boundary element methods with emphasis on hypersingular integrals and divergent series. ASME Appl Mech Rev 52: 17–33. doi: 10.1115/1.3098922
|
| [11] |
Citarella R, Carlone P, Lepore M, et al. (2016) Hybrid technique to assess the fatigue performance of multiple cracked FSW joints. Eng Fract Mech 162: 38–50. doi: 10.1016/j.engfracmech.2016.05.005
|
| [12] | C M BEASY Ltd (2011) BEASY V10r14 Documentation. |
| [13] |
Calì C, Citarella R (2004) Residual strength assessment for a butt joint in MSD condition. Adv Eng Softw 35: 373–382. doi: 10.1016/j.advengsoft.2004.03.009
|
| [14] | Citarella R, Cricrì G, Lepore M, et al. (2014) Assessment of Crack Growth from a Cold Worked Hole by Coupled FEM-DBEM Approach. Key Eng Mater 577–578: 669–672. |
| [15] | Cavallini G, Lazzeri R (2003) Report on Experimental Fatigue Crack Growth in medium and complex components. ADMIRE project report: ADMIRE-TR-3.0-67-3.1/UP. Dipartimento di Ingegneria Aerospaziale, Università di Pisa. |
| [16] | De Castro PMST, De Matos PFP, Moreira PMGP, et al. (2007) An overview on fatigue analysis of aeronautical structural details: open hole, single rivet lap-joint, and lap-joint panel. Mater Sci Eng 468–470: 144–157. |
| [17] |
Armentani E, Citarella R (2006) DBEM and FEM analysis on non-linear multiple crack propagation in an aeronautic doubler-skin assembly. Int J Fatigue 28: 598–608. doi: 10.1016/j.ijfatigue.2005.06.050
|
| [18] |
Citarella R (2009) Non Linear MSD crack growth by DBEM for a riveted aeronautic reinforcement. Adv Eng Softw 40: 253–259. doi: 10.1016/j.advengsoft.2008.04.007
|
| [19] |
Rigby RH, Aliabadi MH (1993) Mixed-mode J-integral method for analysis of 3D fracture problems using DBEM. Eng Anal Bound Elem 11: 239–256. doi: 10.1016/0955-7997(93)90026-H
|
| [20] |
Rigby RH, Aliabadi MH (1998) Decomposition of the mixed-mode J-integral—revisited. Int J Solids Struct 35: 2073–2099. doi: 10.1016/S0020-7683(97)00171-6
|
| [21] |
Yu DZ (2013) A Numerical Analysis of Riveted Lap Joint Containing Multiple-site Damage. Appl Math Inf Sci 7: 699–704 doi: 10.12785/amis/072L46
|
| [22] |
Erdogan F, Sih GC (1963) On the crack extension in plates under plane loading and transverse shear. J Basic Eng 85: 519–527. doi: 10.1115/1.3656897
|
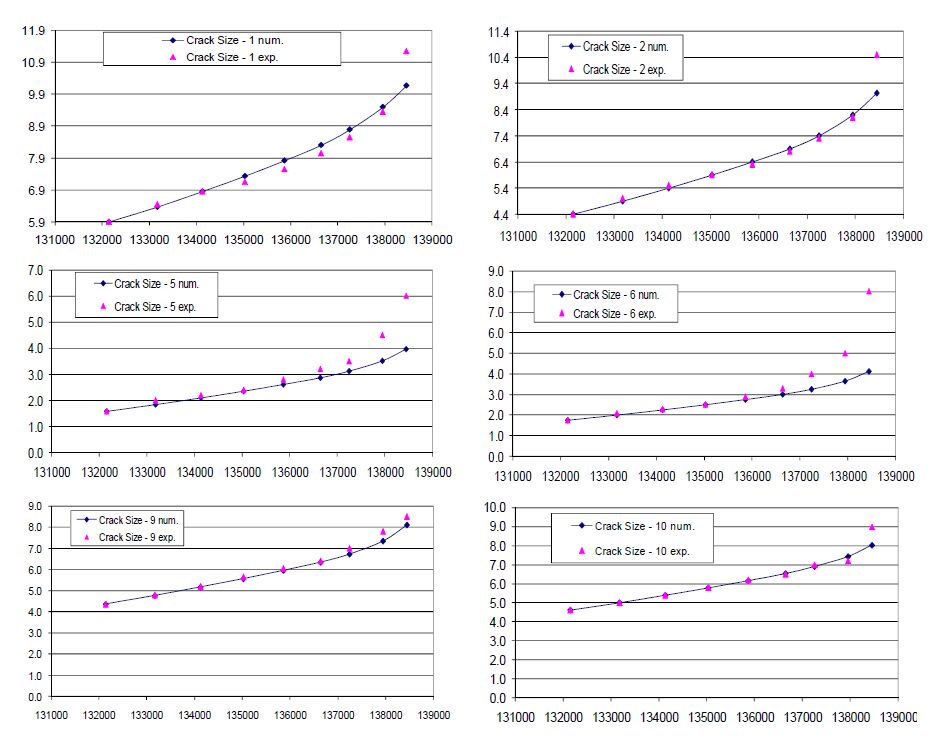
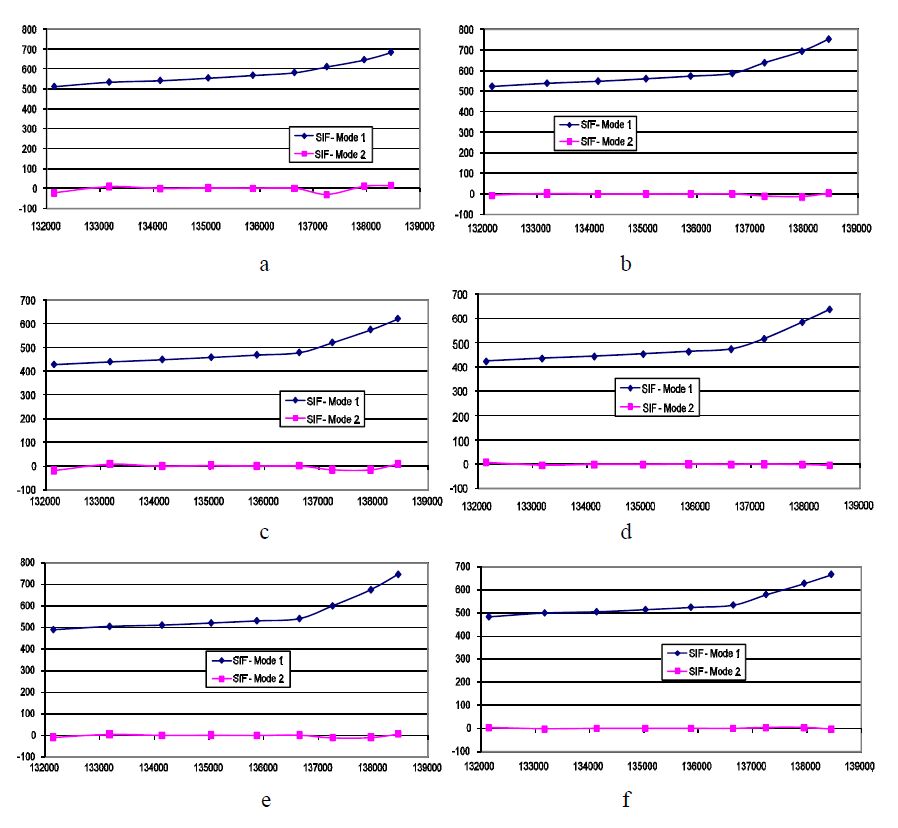
Figures(10)

R. Citarella, M. Lepore, M. Perrella, C. Calì. Multiple crack propagation by DBEM in a riveted lap-joint[J]. AIMS Materials Science, 2016, 3(4): 1577-1586. doi: 10.3934/matersci.2016.4.1577


 DownLoad: