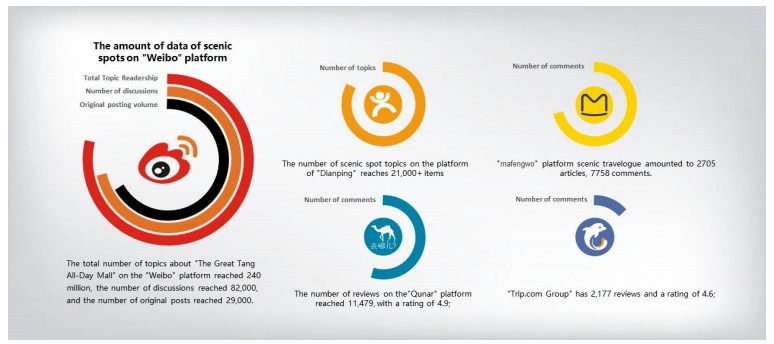
With the rapid rise of social networking software, some attractive content has appeared on social platforms, which has spread rapidly and flourished in the online world. As a commercial district mainly featuring Tang culture, the Great Tang All-Day Mall has received widespread attention both in reality and on the Internet. In this paper, a big data semantic analysis model is introduced into the online reviews of the commercial district of the Great Tang All-Day Mall to understand the behaviour and experience of tourists. Using a large-scale review dataset, an exploratory analysis of the Great Tang All-Day Mall has been conducted. A comprehensive list of topics discussed by tourists visiting the Great Tang All-Day Mall has been created. The interests and concerns of the visitor groups are demonstrated. The proposed methodology and findings help commercial district managers understand visitors' perceptions so that effective marketing and improvement plans could be developed to attract and retain future customers.
Citation: Weidi Zhang, Lei Liang. The Great Tang All-Day Mall attractive cause analysis and guidance strategy[J]. Urban Resilience and Sustainability, 2024, 2(1): 6-26. doi: 10.3934/urs.2024002
With the rapid rise of social networking software, some attractive content has appeared on social platforms, which has spread rapidly and flourished in the online world. As a commercial district mainly featuring Tang culture, the Great Tang All-Day Mall has received widespread attention both in reality and on the Internet. In this paper, a big data semantic analysis model is introduced into the online reviews of the commercial district of the Great Tang All-Day Mall to understand the behaviour and experience of tourists. Using a large-scale review dataset, an exploratory analysis of the Great Tang All-Day Mall has been conducted. A comprehensive list of topics discussed by tourists visiting the Great Tang All-Day Mall has been created. The interests and concerns of the visitor groups are demonstrated. The proposed methodology and findings help commercial district managers understand visitors' perceptions so that effective marketing and improvement plans could be developed to attract and retain future customers.

| [1] | Cheng R (2013) The survey of Xi'an Great Tang All Day Mall's spatial pattern and operational condition. Master's thesis, Xi'an University of Architecture and Technology, Shaanxi, 2013. http://dx.doi.org/10.7666/d.D375454 |
| [2] |
Zhao KS, Liu M (2022) Research on the optimization and improvement of tourism leisure districts from the perspective of business format—Taking the Great Tang All-Day Mall as an example. Tourism Overview: 5–11. http://dx.doi.org/10.3969/j.issn.1004-3292.2022.04.002 doi: 10.3969/j.issn.1004-3292.2022.04.002

|
| [3] | Yang X, Jin P, Chen X (2015) The construction of a kind of chat corpus in Chinese word segmentation. 2015 IEEE/WIC/ACM International Conference on Web Intelligence and Intelligent Agent Technology (WI-IAT), IEEE, Singapore. 168–172. http://dx.doi.org/10.1109/WI-IAT.2015.196 |
| [4] | Chen ZY (2022) A study on tourist perception evaluation based on data text analysis on the NLPIR platform. Master's thesis, Guizhou University, Guizhou, 2022. http://dx.doi.org/10.27047/d.cnki.ggudu.2021.001394 |
| [5] |
Schuckert M, Liu X, Law R (2015) Hospitality and tourism online reviews: Recent trends and future directions. J Travel Tour Mark 32: 608–621. http://dx.doi.org/10.1080/10548408.2014.933154 doi: 10.1080/10548408.2014.933154
|
| [6] |
Bi JW, Liu Y, Fan ZP, et al. (2019) Wisdom of crowds: Conducting importance-performance analysis (IPA) through online reviews. Tourism Manage 70: 460–478. https://doi.org/10.1016/j.tourman.2018.09.010 doi: 10.1016/j.tourman.2018.09.010
|
| [7] | Chang WL (2016) Discovering the voice from travellers: A sentiment analysis for online reviews. In: Sugumaran, V., Yoon, V., Shaw, M., E-Life: Web-Enabled Convergence of Commerce, Work, and Social Life, WEB 2015, Lecture Notes in Business Information Processing, Springer, Cham, 258. http://dx.doi.org/10.1007/978-3-319-45408-5_2 |
| [8] |
Shih HY (2006) Network characteristics of drive tourism destinations: An application of network analysis in tourism. Tourism Manage 27: 1029–1039. https://doi.org/10.1016/j.tourman.2005.08.002 doi: 10.1016/j.tourman.2005.08.002
|
| [9] |
Guo Y, Barnes SJ, Jia Q (2017) Mining meaning from online ratings and reviews: Tourist satisfaction analysis using latent dirichletallocation. Tourism Manage 59: 467–483. https://doi.org/10.1016/j.tourman.2016.09.009 doi: 10.1016/j.tourman.2016.09.009
|
| [10] |
Xiang Z, Du Q, Ma Y, et al. (2017) A comparative analysis of major online review platforms: Implications for social media analytics in hospitality and tourism. Tourism Manage 58: 51–65. https://doi.org/10.1016/j.tourman.2016.10.001 doi: 10.1016/j.tourman.2016.10.001
|
| [11] |
Park DH, Lee J, Han I (2007) The effect of on-line consumer reviews on consumer purchasing intention: The moderating role of involvement. Int J Electron Comm 11: 125–148. http://dx.doi.org/10.2753/JEC1086-4415110405 doi: 10.2753/JEC1086-4415110405
|
| [12] | Liu WT (2021) Research on the evaluation and promotion of Shaoshan tourism service quality based on online comments. Master's thesis, Xiangtan University, Hunan, 2021. http://dx.doi.org/10.27426/d.cnki.gxtdu.2020.001508 |
| [13] |
Xie KL, Zhang Z, Zhang Z (2014) The business value of online consumer reviews and management response to hotel performance. Int J Hosp Manag 43: 1–12. https://doi.org/10.1016/j.ijhm.2014.07.007 doi: 10.1016/j.ijhm.2014.07.007
|
| [14] |
Li G, Law R, Vu HQ, et al. (2015) Identifying emerging hotel preferences using emerging pattern mining technique. Tourism Manage 46: 311–321. https://doi.org/10.1016/j.tourman.2014.06.015 doi: 10.1016/j.tourman.2014.06.015
|
| [15] |
Calheiros AC, Moro S, Rita P (2017) Sentiment classification of consumer-generated online reviews using topic modelling. J Hosp Market Manag 26: 675–693. http://dx.doi.org/10.1080/19368623.2017.1310075 doi: 10.1080/19368623.2017.1310075
|
| [16] | Hofmann T (1999) Probabilistic latent semantic indexing. Proceedings of the 22nd Annual International ACM SIGIR Conference on Research and Development in Information Retrieval, 50–57. http://dx.doi.org/10.1145/312624.312649 |
| [17] | Zhang H, Miao J, Liu Z, et al. (2020) NLPIR-Parser: Making Chinese and English semantic analysis easier and complete. 15th International Conference on the Statistical Analysis of Textual Data. Available from: http://www.nlpir.org/wordpress/wp-content/uploads/2020/07/NLPIR-20200401-ZHANG-Etal.pdf. |
| [18] | Zhang H, Shang J (2009) NLPIR-Parser: An intelligent semantic analysis toolkit for big data.[Software]. Version 1.0.0.1. Beijing: LING-JOIN, 2009. Available from https://github.com/NLPIR-team/NLPIR/tree/master/NLPIR-Parser. |
| [19] | Li S (2023) A study on the impact of social media content marketing on the recognition of tourism destination brands. Master's Thesis, Shaanxi Normal University, Shaanxi, 2023. http://dx.doi.org/10.27292/d.cnki.gsxfu.2021.000757 |
| [20] |
Zhao Q (2022) Data analysis and visualization of a tourism website based on python web crawling. Electron Des Eng 30: 152–155. http://dx.doi.org/10.14022/j.issn1674-6236.2022.16.033 doi: 10.14022/j.issn1674-6236.2022.16.033
|
| [21] |
Wang N, Dong HQ (2021) Research on the construction of information ontology for user participation in online travel websites—Taking mafengwo online travel website as an example. J Mod Inform: 64–75. http://dx.doi.org/10.3969/j.issn.1008-0821.2021.06.006 doi: 10.3969/j.issn.1008-0821.2021.06.006
|
| [22] | Li R (2022) Research on online tourism website information service quality evaluation based on user perception. Master's Thesis, Jilin University, Jilin, 2022. http://dx.doi.org/10.27162/d.cnki.gjlin.2021.004273 |
| [23] |
Qian W (2022) Python-based analysis of tourism website data crawling. Comput Program Skills Maint: 85–87+118. http://dx.doi.org/10.16184/j.cnki.comprg.2022.09.026 doi: 10.16184/j.cnki.comprg.2022.09.026
|
| [24] |
Li XY, Zhao Y, Xiao ZL, et al. (2022) Analysis and visualization design analysis of tourism website data based on python web crawling. Comput Knowl Technol 18: 58–60+70. http://dx.doi.org/10.14004/j.cnki.ckt.2022.2093 doi: 10.14004/j.cnki.ckt.2022.2093
|
| [25] | Águeda M, Rita P, Guerreiro P (2019) Sentiment analysis in online reviews classification using text mining techniques. 2019 14th Iberian Conference on Information Systems and Technologies (CISTI), IEEE, Coimbra, Portugal. http://dx.doi.org/10.23919/CISTI.2019.8760671 |
| [26] | Hau PL (2022) Emotional analysis of online comments on Yungang Caves. Master's Thesis, Dongbei University of Finance and Economics, Liaoning, 2022. http://dx.doi.org/10.27006/d.cnki.gdbcu.2022.000606 |
| [27] | Peng T (2022) Research on sentiment analysis and emotion recognition technology of dialogue texts. Master's Thesis, Dalian University of Technology, Liaoning, 2022. http://dx.doi.org/10.26991/d.cnki.gdllu.2022.002233 |
| [28] |
Li XZ (2022) Immersion, sharing, interaction: A study on the ritual communication of the "Chang'an twelve hours" in the ancient style district of Xi'an. Radio & TV J: 31–34. http://dx.doi.org/10.19395/j.cnki.1674-246x.2022.09.044 doi: 10.19395/j.cnki.1674-246x.2022.09.044
|
| [29] |
Li XS (2022) "Immersive Experience" Ignites the cultural and tourism industry in Luoyang. Ren-Da Jian She: 19–21. http://dx.doi.org/10.3969/j.issn.1009-6671.2022.04.007 doi: 10.3969/j.issn.1009-6671.2022.04.007
|
| [30] |
Lin H, Gao J, Tian J (2022) Impact of tourist-to-tourist interaction on responsible tourist behaviour: Evidence from China. J Destin Mark Manage 24: 100709. https://doi.org/10.1016/j.jdmm.2022.100709 doi: 10.1016/j.jdmm.2022.100709
|
| [31] |
Wang XX, Zeng XY, Zhang CZ (2020) The production of cultural atmosphere and tourist experience in ancient-style commercial streets: An exploratory study based on Xibu Old Street in Zhangjiajie. Tourism Sci 34: 46–55. https://doi.org/10.16323/j.cnki.lykx.2020.04.004 doi: 10.16323/j.cnki.lykx.2020.04.004
|
| [32] |
Yu F (2019) Revival and transformation methods based on traditional cultural intellectual property. Art Panorama: 130–131. http://dx.doi.org/10.3969/j.issn.1002-2953.2019.05.046 doi: 10.3969/j.issn.1002-2953.2019.05.046
|
| [33] |
Lin YQ, Shen Y (2022) Immersive experience: The integration of creativity, technology, and tourism. Tourism Tribune 37: 6–8. http://dx.doi.org/10.19765/j.cnki.1002-5006.2022.10.004 doi: 10.19765/j.cnki.1002-5006.2022.10.004
|
| [34] |
Su HX, Hao GH (2022) A study on the influence of reference groups on tourists' civic behaviour—A case study of the Great Tang All-Day Mall scenic area. Mod Bus Trade Ind 43: 13–15. http://dx.doi.org/10.19311/j.cnki.1672-3198.2022.05.006 doi: 10.19311/j.cnki.1672-3198.2022.05.006
|
Figures(9) / Tables(1)
Weidi Zhang, Lei Liang. The Great Tang All-Day Mall attractive cause analysis and guidance strategy[J]. Urban Resilience and Sustainability, 2024, 2(1): 6-26. doi: 10.3934/urs.2024002


 DownLoad: