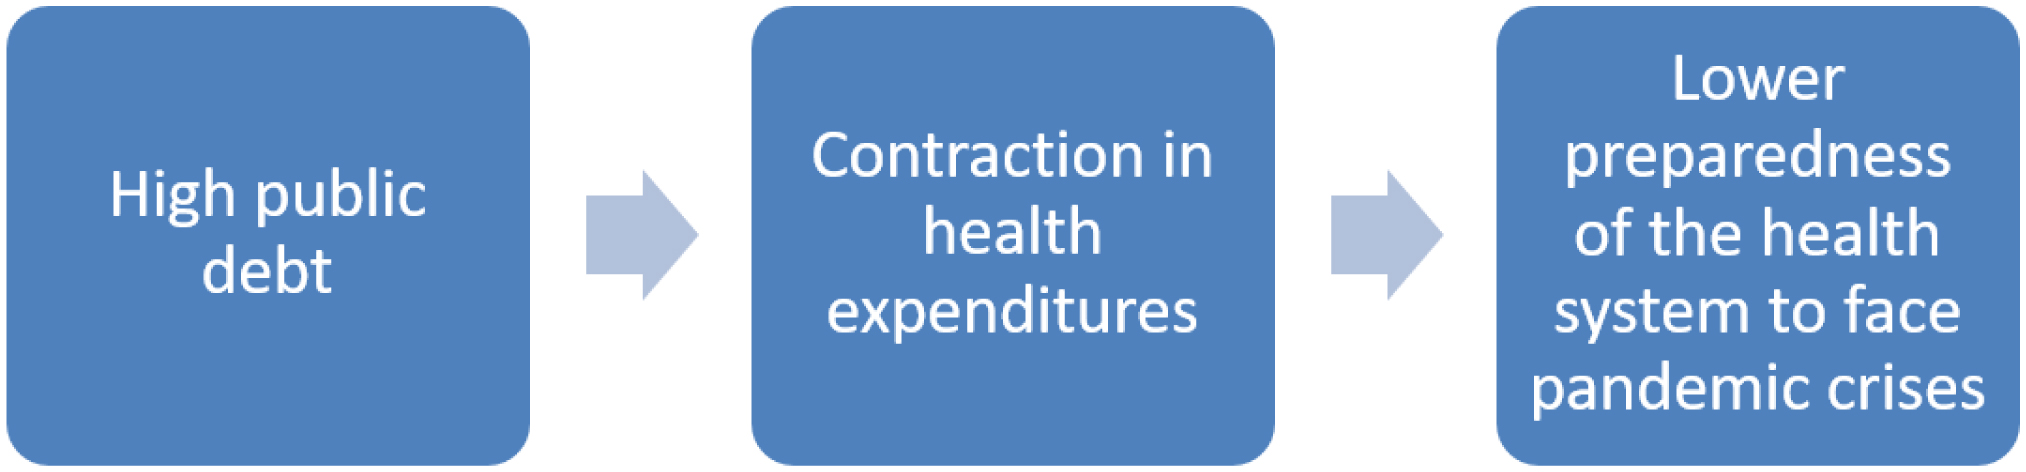
The investigation goal here was to analyze how the level of public debt affects preparedness of health systems to face emergencies. In particular, this study examined the negative effects of high public debt on health systems of European countries in the presence of the COVID-19 pandemic crisis. Empirical evidence revealed that European countries with a lower level of government debt as a percentage of GDP both in 2009 and 2019 (the period before the arrival of the pandemic) had lower COVID-19 fatality rates compared to countries with higher levels of public debt. The explanation is that high levels of public debt in countries trigger budget constraints that limit their ability to allocate resources to healthcare systems (e.g., health expenditures and investments), weakening health system performance and causing systemic vulnerability and lower preparedness during emergencies, such as with the COVID-19 pandemic. Implications of health policies are suggested to improve strategies of crisis management.
Citation: Mario Coccia, Igor Benati. Negative effects of high public debt on health systems facing pandemic crisis: Lessons from COVID-19 in Europe to prepare for future emergencies[J]. AIMS Public Health, 2024, 11(2): 477-498. doi: 10.3934/publichealth.2024024
The investigation goal here was to analyze how the level of public debt affects preparedness of health systems to face emergencies. In particular, this study examined the negative effects of high public debt on health systems of European countries in the presence of the COVID-19 pandemic crisis. Empirical evidence revealed that European countries with a lower level of government debt as a percentage of GDP both in 2009 and 2019 (the period before the arrival of the pandemic) had lower COVID-19 fatality rates compared to countries with higher levels of public debt. The explanation is that high levels of public debt in countries trigger budget constraints that limit their ability to allocate resources to healthcare systems (e.g., health expenditures and investments), weakening health system performance and causing systemic vulnerability and lower preparedness during emergencies, such as with the COVID-19 pandemic. Implications of health policies are suggested to improve strategies of crisis management.

| [1] | Amarlou A, Coccia M (2023) Estimation of diffusion modelling of unhealthy nanoparticles by using natural and safe microparticles. NCR 8: 117-121. https://doi.org/10.22036/ncr.2023.02.004 |
| [2] | Kargı B, Coccia M, Uçkaç B (2023) Findings from the first wave of covid-19 on the different impacts of lockdown on public health and economic growth. Int J Econ Sci 12: 21-39. https://doi.org/10.52950/ES.2023.12.2.002 |
| [3] |
Kargı B, Coccia M, Uçkaç Bekir Cihan (2023) The relation between restriction policies against Covid-19, economic growth and mortality rate in society. Migr Lett 20: 218-231. https://doi.org/10.47059/ml.v20i5.3538 
|
| [4] |
Kargı B, Coccia M, Uçkaç Bekir Cihan (2023) How does the wealth level of nations affect their COVID19 vaccination plans?. Econ Manag Sustai 8: 6-19. https://doi.org/10.14254/jems.2023.8-2.1
|
| [5] |
Coccia M (2021) Recurring waves of COVID-19 pandemic with different effects in public health. JEB 8: 28-45. http://dx.doi.org/10.1453/jeb.v8i1.2184
|
| [6] |
Uçkaç BC, Coccia M, Kargı B (2023) Diffusion COVID-19 in polluted regions: Main role of wind energy for sustainable and health. Int J Membr Sc Technol 10: 2755-2767. https://doi.org/10.15379/ijmst.v10i3.2286
|
| [7] | Uçkaç BC, Coccia M, Kargı B (2023) Simultaneous encouraging effects of new technologies for socioeconomic and environmental sustainability. Bull Soc-Econo Humanit Res 19: 100-120. https://doi.org/10.52270/26585561_2023_19_21_100 |
| [8] | Abel JG, Gietel-Basten S (2020) International remittance flows and the economic and social consequences of COVID-19. Environ 52: 1480-1482. |
| [9] |
Akan AP, Coccia M (2022) Changes of air pollution between countries because of lockdowns to face COVID-19 pandemic. Appl Sci 12: 12806. https://doi.org/10.3390/app122412806
|
| [10] |
Akan AP, Coccia M (2023) Transmission of COVID-19 in cities with weather conditions of high air humidity: Lessons learned from Turkish Black Sea region to face next pandemic crisis. COVID 3: 1648-1662. https://doi.org/10.3390/covid3110113
|
| [11] |
Bontempi E, Coccia M, Vergalli S, et al. (2021) Can commercial trade represent the main indicator of the COVID-19 diffusion due to human-to-human interactions? A comparative analysis between Italy, France, and Spain. Environ Res 201: 111529. https://doi.org/10.1016/j.envres.2021.111529
|
| [12] |
Coccia M (2020) Factors determining the diffusion of COVID-19 and suggested strategy to prevent future accelerated viral infectivity similar to COVID. Sci Total Environ 729: 138474. https://doi.org/10.1016/j.scitotenv.2020.138474
|
| [13] |
Coccia M (2021) The impact of first and second wave of the COVID-19 pandemic: comparative analysis to support control measures to cope with negative effects of future infectious diseases in society. Environ Res 197: 111099. https://doi.org/10.1016/j.envres.2021.111099
|
| [14] |
Coccia M (2022) Optimal levels of vaccination to reduce COVID-19 infected individuals and deaths: A global analysis. Environ Res 204: 112314. https://doi.org/10.1016/j.envres.2021.112314
|
| [15] |
Coccia M (2023) High potential of technology to face new respiratory viruses: mechanical ventilation devices for effective healthcare to next pandemic emergencies. Technol Soc 73: 102233. https://doi.org/10.1016/j.techsoc.2023.102233
|
| [16] |
Goolsbee A, Syverson C (2021) Fear, lockdown, and diversion: Comparing drivers of pandemic economic decline 2020. J Public Econ 193: 104311. https://doi.org/10.1016/j.jpubeco.2020.104311
|
| [17] |
Núñez-Delgado A, Bontempi E, Coccia M, et al. (2021) SARS-CoV-2 and other pathogenic microorganisms in the environment. Environ Res 201: 111606. https://doi.org/10.1016/j.envres.2021.111606
|
| [18] |
Tisdell CA (2020) Economic, social and political issues raised by the COVID-19 pandemic. Econ Anal Policy 68: 17-28. https://doi.org/10.1016/j.eap.2020.08.002
|
| [19] |
Huang BZ, Creekmur B, Yoo MS, et al. (2022) Healthcare utilization among patients diagnosed with COVID-19 in a large integrated health system. J Gen Intern Med 37: 830-837.
|
| [20] | Beaulieu M, Roy J, Rebolledo C, et al. (2022) The management of personal protective equipment during the COVID-19 pandemic: The case of the province of Quebec. HMF 35: 48-52. https://doi.org/10.1177/08404704211053996 |
| [21] |
Persad G, Largent E (2022) COVID-19 vaccine refusal and fair allocation of scarce medical resources. JAMA Health Forum 3: e220356.
|
| [22] |
Beleche T, Kuecken M, Sassi A, et al. (2022) Characteristics of Medical Device Shortages in the US, 2006–20. Health Affair 41: 1790-1794. https://doi.org/10.1377/hlthaff.2022.00643
|
| [23] | Rajaram, Pandey AK, Saproo S, et al. (2022) A research study to understand the impact of pandemic on healthcare workers. J Inform Optim Sci 43: 1209-1220. |
| [24] |
Burrowes SA, Casey SM, Pierre-Joseph N, et al. (2023) COVID-19 pandemic impacts on mental health, burnout, and longevity in the workplace among healthcare workers: A mixed methods study. J Interprofessional Educ Prac 32: 100661.
|
| [25] |
Jordan JA, Shannon C, Browne D, et al. (2023) Healthcare staff mental health trajectories during the COVID-19 pandemic: findings from the COVID-19 Staff Wellbeing Survey. BJPsych Open 9: e112.
|
| [26] |
Poon YS, Lin YP, Griffiths P, et al. (2022) A global overview of healthcare workers' turnover intention amid COVID-19 pandemic: A systematic review with future directions. Hum Resour Health 20: 1-8.
|
| [27] |
Lestari F, Kadir A, Puspitasari A, et al. (2023) Hospital preparedness for COVID-19 in Indonesia. Front Public Health 11: 1187698.
|
| [28] |
Nuzzo JB, Gostin LO (2022) COVID-19 and lessons to improve preparedness for the next pandemic—Reply. JAMA 327: 1823.
|
| [29] |
Coccia M (2023) Sources, diffusion, and prediction in COVID-19 pandemic: lessons learned to face next health emergency. AIMS Public Health 10: 145-168. https://doi.org/10.3934/publichealth.2023012
|
| [30] |
Khan JR, Awan N, Islam MM, et al. (2020) Healthcare capacity, health expenditure, and civil society as predictors of COVID-19 case fatalities: a global analysis. Front Public Health 8: 347. https://doi.org/10.3389/fpubh.2020.00347
|
| [31] |
Magazzino C, Mele M, Coccia M (2022) A machine learning algorithm to analyze the effects of vaccination on COVID-19 mortality. Epidemiol Infect 150: e168. https://doi.org/10.1017/S0950268822001418
|
| [32] |
Padilla L (2023) The health resources and services administration–bureau of health workforce response to the COVID-19 pandemic. Public Health Rep 138: 6S-8S.
|
| [33] |
Bustamante Izquierdo JP, Puertas EB, Hernández D, et al. (2023) COVID-19 and human resources for health: analysis of planning, policy responses and actions in Latin American and Caribbean countries. Hum Resour Health 21: 21.
|
| [34] |
McGill N, Weller-Newton J, Lees C (2022) A new survey tool for evaluating pandemic preparedness in health services. BMC Health Serv Res 22: 708.
|
| [35] | Benati I, Coccia M (2022) Effective contact tracing system minimizes COVID-19 related infections and deaths: Policy lessons to reduce the impact of future pandemic diseases. J Public Admin Gov 12: 19-33. https://doi.org/10.5296/jpag.v12i3.19834 |
| [36] |
Daniels RS, McCauley JW (2023) The health of influenza surveillance and pandemic preparedness in the wake of the COVID-19 pandemic. J Gen Virol 104: p.001822.
|
| [37] |
Huhtakangas M, Kihlström L, Karreinen S, et al. (2022) “A basic frame existed but was not followed” –Finnish public health system's response to COVID-19. Eur J Public Health 32: ckac131-009. https://doi.org/10.1093/eurpub/ckac131.009
|
| [38] |
Moussallem M, Zein-El-Din A, Hamra R, et al. (2022) Evaluating the governance and preparedness of the Lebanese health system for the COVID-19 pandemic: a qualitative study. BMJ Open 12: e058622.
|
| [39] |
Aristei L, D'Ambrosio F, Villani L, et al. (2022) Public health regulations and policies dealing with preparedness and emergency management: The experience of the COVID-19 pandemic in Italy. Int Environ Res Public Health 19: 1091. https://doi.org/10.3390/ijerph19031091
|
| [40] |
Parrado S, Galli D (2021) Intergovernmental veto points in crisis management: Italy and Spain facing the COVID-19 pandemic. Int Re Adm Sci 87: 576-592.
|
| [41] |
Marginean S, Orastean R (2022) Health spending patterns and COVID-19 crisis in European Union: A cross-country analysis. Systems 10: 238.
|
| [42] |
Gupta I (2022) Financing for a resilient health system in India: Lessons from the COVID Pandemic. Health dimensions of COVID-19 in India and beyond 2022: 245.
|
| [43] | Ovsiannikova MA (2022) The impact of health expenditure on COVID-19 mortality. Управленческое консультирование 7: 163-184. |
| [44] |
Oshinubi K, Rachdi M, Demongeot J (2022) Analysis of reproduction number R0 of COVID-19 using current health expenditure as gross domestic product percentage (CHE/GDP) across countries. Healthcare 9: 1247.
|
| [45] |
Godshall CE, Banach DB (2021) Pandemic Preparedness. Infect Dis Clin N Am 35: 1077-1089.
|
| [46] |
Armstrong D, Moore J, Fraher EP, et al. (2021) COVID-19 and the health workforce. Med Care Res Rev 78: 4S-6S.
|
| [47] | Roehr B (2022) Rise in US spending on healthcare in 2009 was twice that in UK. Brit Med J 2012: 344. |
| [48] | Aba G, Ateş M (2016) The relationship between health expenditure and socioeconomic/demographic indicators: an international comparison. J Int Health Sci Manag 2: 113-118. |
| [49] | Raghupathi V, Raghupathi W (2021) The association between healthcare resource allocation and health status: an empirical insight with visual analytics. J Public Health 2021: 1-23. |
| [50] |
Karanikolos M, Azzopardi-Muscat N, Ricciardi W, et al. (2022) The impact of austerity policies on health systems in Southern Europe. Social Welfare Issues in Southern Europe . Routledge 119-139.
|
| [51] |
Levaggi R, Menoncin F (2013) Soft budget constraints in health care: evidence from Italy. Eur J Health Econ 14: 725-737.
|
| [52] | Crivelli E, Leive A, Stratmann MT (2010) Subnational health spending and soft budget constraints in OECD countries. International Monetary Fund . |
| [53] |
Aizenman J, Ito H (2023) Post COVID-19 exit strategies and emerging markets economic challenges. Rev Int Econ 31: 1-34.
|
| [54] |
Agoraki MK, Kardara S, Kollintzas T, et al. (2023) Debt-to-GDP changes and the great recession: European Periphery versus European Core. Int J Finance Econ 28: 3299-3331.
|
| [55] |
Essers D, Cassimon D (2022) Towards HIPC 2.0? Lessons from past debt relief initiatives for addressing current debt problems. JGD 13: 187-231.
|
| [56] |
Bacchiocchi E, Borghi E, Missale A (2011) Public investment under fiscal constraints. Fiscal Studies 32: 11-42.
|
| [57] | Souliotis K, Papadonikolaki J, Papageorgiou M, et al. (2018) The impact of crisis on health and health care: Thoughts and data on the Greek case. Arch Hell Med 35: 9-16. |
| [58] | Theodoropoulou S (2022) Recovery, resilience and growth regimes under overlapping EU conditionalities: the case of Greece. CEP 20: 201-219. |
| [59] | Burriel Llombart P, Checherita-Westphal C, Jacquinot P, et al. (2020) Economic consequences of high public debt: evidence from three large scale DSGE models. Documentos de Trabajo/Banco de España . https://dx.doi.org/10.2139/ssrn.3676264 |
| [60] |
Azizi H, Esmaeili ED, Fakhari A (2020) Challenges and accurate estimates of mortality and case-fatality rates due to COVID-19. New Microbes New Infect 38: 100775. https://doi.org/10.1016/j.nmni.2020.100775
|
| [61] | Papaioannou MG, Tsetsekos G (2021) Sovereign debt, management, and restructurings during the COVID-19 pandemic. Multinatl Finance J 25: 63-71. |
| [62] | Sagan A, Thomas S, McKee M, et al. (2020) COVID-19 and health systems resilience: lessons going forwards. Eurohealth 26: 20-24. |
| [63] |
Coccia M (2021) Pandemic Prevention: Lessons from COVID-19. Encyclopedia 1: 433-444. https://doi.org/10.3390/encyclopedia1020036
|
| [64] | Bouchet MH, Clark E, Groslambert B Country risk assessment: A guide to global investment strategy 1st Edition, Wiley (2023). |
| [65] | Coccia M (2021) Comparative critical decisions in management. Global Encyclopedia of Public Administration, Public Policy, and Governance . Cham: Springer Nature. https://doi.org/10.1007/978-3-319-31816-5_3969-1 |
| [66] | Nickel C, Rother P, Zimmermann L (2010) Major public debt reductions: Lessons from the past, lessons for the future. Eur Cent Bank Working Paper Series : 1241. |
| [67] | Köhler-Töglhofer W, Zagler M (2004) The impact of different fiscal policy regimes on public debt dynamics. Public Debt Conference . Available from: https://ssrn.com/abstract=2070714. |
| [68] |
Iwata Y, IIboshi H (2023) The nexus between public debt and the government spending multiplier: fiscal adjustments matter. Oxf Bull Econ Stat 85: 830-858. https://doi.org/10.1111/obes.12547
|
| [69] | ECB.Government debt reduction strategies in the Euro area. Econ Bull (2016) 4: 1-20. |
| [70] | De Soyres C, Kawai R, Wang M (2022) Public debt and real GDP: Revisiting the impact. International Monetary Fund . |
| [71] |
Heimberger P (2022) Do higher public debt levels reduce economic growth?. J Econ Surv 37: 1061-1089. https://doi.org/10.1111/joes.12536
|
| [72] |
Panizza U, Presbitero AF (2014) Public debt and economic growth: is there a causal effect?. J Macroecon 41: 21-41.
|
| [73] | Fan RY, Lederman D, Nguyen H, et al. (2023) Calamities, debt, and growth in developing countries. IMF Econ Rev : 1-21. |
| [74] |
Georgantas G, Kasselaki M, Tagkalakis A (2023) Τhe effects of fiscal consolidation in OECD countries. Econ Model 118: 106099. https://doi.org/10.1016/j.econmod.2022.106099
|
| [75] | CBO.Consequences of a growing national debt. Budgets & Projections (2014) . Available from: https://www.crfb.org/blogs/cbo-consequences-growing-national-debt. |
| [76] | Coccia M (2018) National debts and government deficits within European Monetary Union: Statistical evidence of economic issues. arXiv . Available from: http://arxiv.org/abs/1806.07830. |
| [77] |
McKee M, Karanikolos M, Belcher P, et al. (2012) Austerity: a failed experiment on the people of Europe. J Clin Med 12: 346. https://doi.org/10.7861/clinmedicine.12-4-346
|
| [78] | Global Burden of Disease 2021 Health Financing Collaborator Network.Global investments in pandemic preparedness and COVID-19: development assistance and domestic spending on health between 1990 and 2026. Lancet Glob Health (2023) 11: e385-e413. https://doi.org/10.1016/S2214-109X(23)00007-4 |
| [79] | Alesina A, Favero C, Giavazzi F (2019) Austerity: When it works and when it doesn't. Princeton University Press. https://doi.org/10.2307/j.ctvc77f4b |
| [80] | Coccia M, Benati I (2023) How healthcare expenditures affect covid-19 fatality rate across European countries?. medRxiv . https://doi.org/10.1101/2023.06.23.23291808 |
| [81] |
Coccia M (2021) The relation between length of lockdown, numbers of infected people and deaths of COVID-19, and economic growth of countries: Lessons learned to cope with future pandemics similar to COVID-19. Sci Total Environ 775: 145801. https://doi.org/10.1016/j.scitotenv.2021.145801
|
| [82] |
Coccia M (2022) Improving preparedness for next pandemics: Max level of COVID-19 vaccinations without social impositions to design effective health policy and avoid flawed democracies. Environ Res 213: 113566. https://doi.org/10.1016/j.envres.2022.113566
|
| [83] |
Coccia M (2022) Meta-analysis to explain unknown causes of the origins of SARS-COV-2. Environ Res 111: 113062. https://doi.org/10.1016/j.envres.2022.113062
|
| [84] |
Coccia M (2022) Preparedness of countries to face COVID-19 pandemic crisis: Strategic positioning and underlying structural factors to support strategies of prevention of pandemic threats. Environ Res 203: 111678. https://doi.org/10.1016/j.envres.2021.111678
|
| [85] | Benati I, Coccia M (2022) Global analysis of timely COVID-19 vaccinations: Improving governance to reinforce response policies for pandemic crises. Int J Health Gov 27: 240-253. https://doi.org/10.1108/IJHG-07-2021-0072 |
| [86] | Kluge HHP, Nitzan D, Azzopardi-Muscat N (2020) COVID-19: reflecting on experience and anticipating the next steps. A perspective from the WHO Regional Office for Europe. Eurohealth 26: 13-15. |
| [87] |
Legido-Quigley H, Asgari N, Teo YY, et al. (2020) Are high-performing health systems resilient against the COVID-19 epidemic?. Lancet 395: 848-850. https://doi.org/10.1016/s0140-6736(20)30551-1
|
| [88] | Coccia M (2019) Comparative institutional changes. Global Encyclopedia of Public Administration, Public Policy, and Governance . Springer. https://doi.org/10.1007/978-3-319-31816-5_1277-1 |
| [89] | Coccia M (2019) Theories of development. Global Encyclopedia of Public Administration, Public Policy, and Governance . Springer. https://doi.org/10.1007/978-3-319-31816-5_939-1 |
| [90] |
Penkler M, Müller R, Kenney M, et al. (2020) Back to normal? Building community resilience after COVID-19. Lancet Diabetes Endo 8: 664-665. https://doi.org/10.1016/s2213-8587(20)30237-0
|
| [91] |
Allen Douglas W (2022) Covid-19 lockdown cost/benefits: A critical assessment of the literature. Int J Econ Bus 29: 1-32. https://doi.org/13571516.2021.1976051
|
| [92] |
Barro RJ (2020) Non-pharmaceutical interventions and mortality in U.S. cities during the great influenza pandemic, 1918–1919. Res Econ 76: 93-106. https://doi.org/10.3386/w27049
|
| [93] | McKee MA (2020) European roadmap out of the covid-19 pandemic. Brit Med J 369. https://doi.org/10.1136/bmj.m1556 |
| [94] |
Coccia M (2022) COVID-19 vaccination is not a sufficient public policy to face crisis management of next pandemic threats. Public Organ Rev 23: 1353-1367. https://doi.org/10.1007/s11115-022-00661-6
|
| [95] |
Coccia M (2022) COVID-19 pandemic over 2020 (with lockdowns) and 2021 (with vaccinations): similar effects for seasonality and environmental factors. Environ Res 208: 112711. https://doi.org/10.1016/j.envres.2022.112711
|
| [96] |
Kapitsinis N (2020) The underlying factors of the COVID-19 spatially uneven spread. Initial evidence from regions in nine EU countries. Reg Sci Policy Pract 12: 1027-1045. https://doi.org/10.1111/rsp3.12340
|
| [97] | EurostatGeneral government gross debt (2023). Available from: https://ec.europa.eu/eurostat/databrowser/view/sdg_17_40/default/table?lang=en |
| [98] | EurostatGovernment deficit/surplus, debt and associated data (2024). Available from: https://ec.europa.eu/eurostat/databrowser/view/gov_10dd_edpt1/default/table?lang=en&category=gov.gov_gfs10.gov_10dd |
| [99] | JHUCOVID-19 Dashboard by the Center for Systems Science and Engineering (CSSE) at Johns Hopkins University (JHU) (2023). Available from: https://www.arcgis.com/apps/dashboards/bda7594740fd40299423467b48e9ecf6 |
| [100] | WHOGlobal health expenditure database: current health expenditure by financing schemes (2023). Available from: https://apps.who.int/nha/database/Select/Indicators/en |
| [101] |
Coccia M (2017) Asymmetric paths of public debts and of general government deficits across countries within and outside the European monetary unification and economic policy of debt dissolution. The Journal of Economic Asymmetries 15: 17-31. https://doi.org/10.1016/j.jeca.2016.10.003
|


Figures(3) / Tables(4)

Mario Coccia, Igor Benati. Negative effects of high public debt on health systems facing pandemic crisis: Lessons from COVID-19 in Europe to prepare for future emergencies[J]. AIMS Public Health, 2024, 11(2): 477-498. doi: 10.3934/publichealth.2024024


 DownLoad: