The novel coronavirus 2019 (2019-nCoV) is a public health emergency of international concern resulting in adverse psychological impacts during the epidemic.
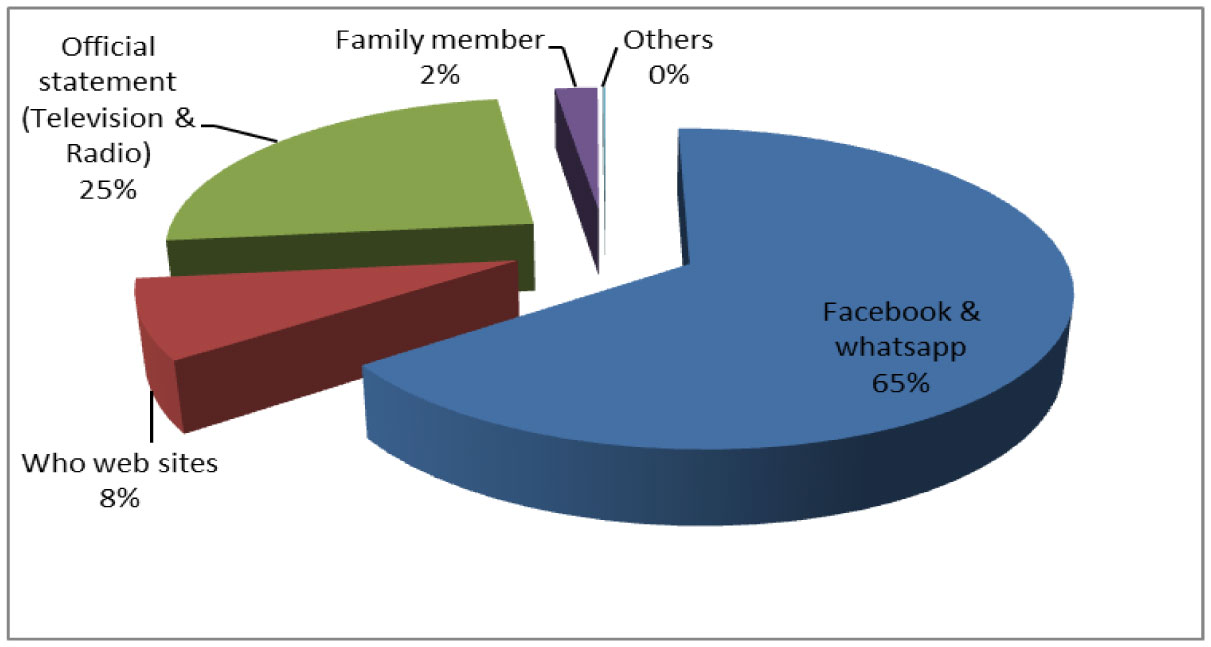
From 1 to 10 April 2020, we conducted an online survey. The online survey collected information on demographic data, precautionary measures against (2019-nCoV), self-health evaluation, knowledge, and concerns about (2019-nCoV), and appraisal of crisis management. The psychological impact was assessed by the General Anxiety Disorder 7-item (GAD-7) scale. The designed questionnaire was answered by participants, and collected data were statistically analyzed.
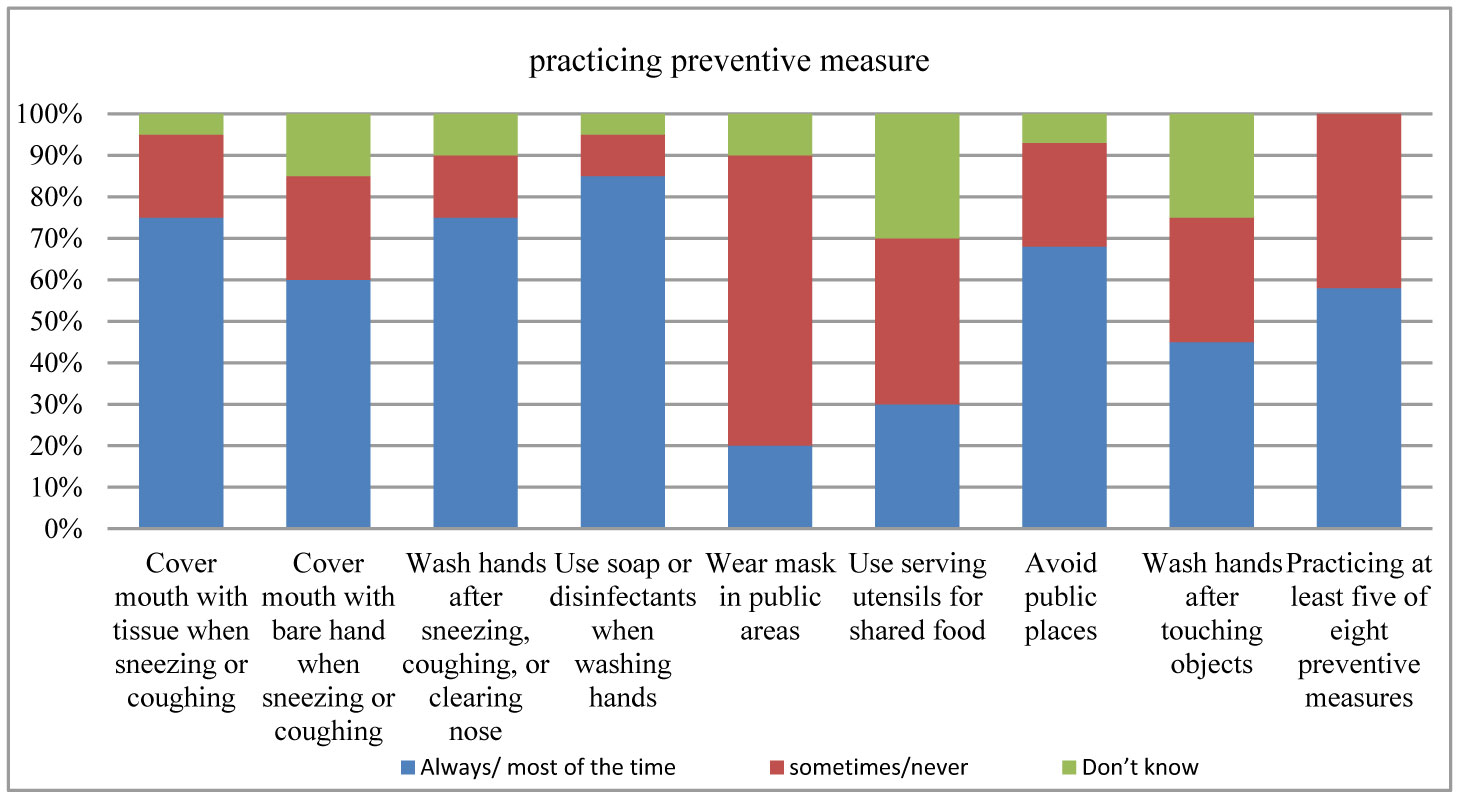
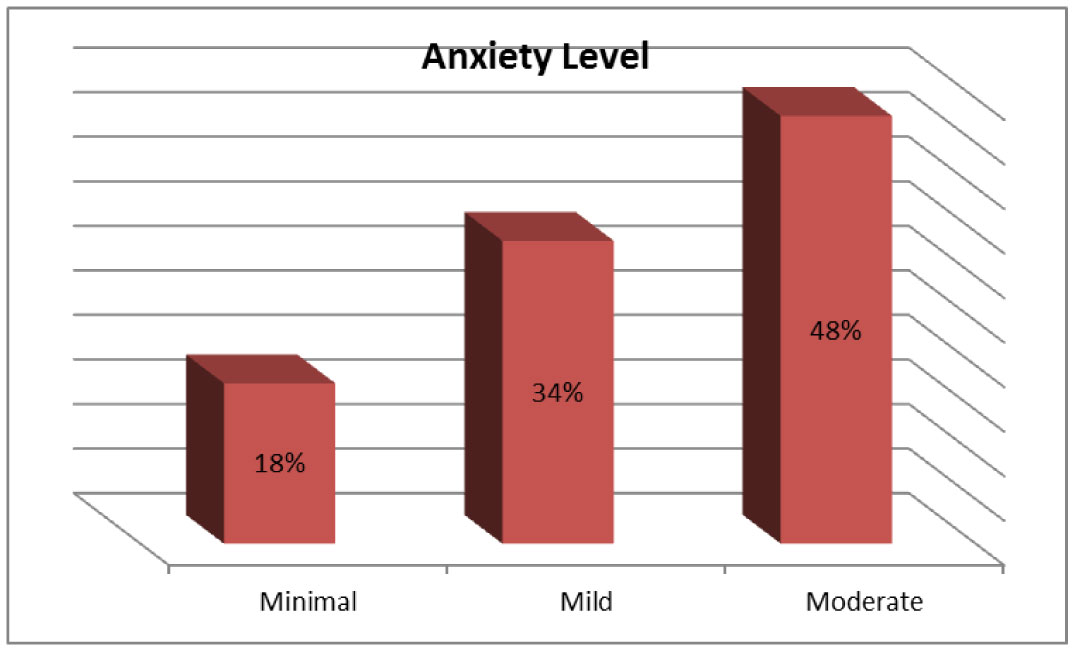
This study included 1200 respondents. In total, 80% of respondents rated the psychological impact; 18% reported minimal anxiety; 34% reported mild anxiety, and 48% with moderate anxiety symptoms. A large proportion (74%) believed that they were very or somewhat likely to contract (2019-nCoV) while only (35%) believed they were unlikely to survive if they contracted the disease. (58%) of the respondents, practiced the precautionary measures directed against person-to-person droplet spread. Respondents with a moderate level of anxiety were most likely to take comprehensive precautionary measures against the infection. Also, older, female, more educated people as well as those who are more likely to contract the infection.
During the outbreak, more than half of the respondents rated the psychological impact as moderate anxiety. Thus, the psychological needs during the outbreak should be addressed appropriately. Our results highlight the need to promote protective personal health practices to interrupt the transmission of the (2019-nCoV) in the community. Therefore, educational public programs about preventive measures should be targeted at the identified groups with low current uptake of precautions.
Citation: Doaa M Magdy, Ahmed Metwally, Omar Magdy. Assessment of community psycho-behavioral responses during the outbreak of novel coronavirus (2019-nCoV): a cross-sectional study[J]. AIMS Public Health, 2022, 9(1): 26-40. doi: 10.3934/publichealth.2022003
The novel coronavirus 2019 (2019-nCoV) is a public health emergency of international concern resulting in adverse psychological impacts during the epidemic.
From 1 to 10 April 2020, we conducted an online survey. The online survey collected information on demographic data, precautionary measures against (2019-nCoV), self-health evaluation, knowledge, and concerns about (2019-nCoV), and appraisal of crisis management. The psychological impact was assessed by the General Anxiety Disorder 7-item (GAD-7) scale. The designed questionnaire was answered by participants, and collected data were statistically analyzed.
This study included 1200 respondents. In total, 80% of respondents rated the psychological impact; 18% reported minimal anxiety; 34% reported mild anxiety, and 48% with moderate anxiety symptoms. A large proportion (74%) believed that they were very or somewhat likely to contract (2019-nCoV) while only (35%) believed they were unlikely to survive if they contracted the disease. (58%) of the respondents, practiced the precautionary measures directed against person-to-person droplet spread. Respondents with a moderate level of anxiety were most likely to take comprehensive precautionary measures against the infection. Also, older, female, more educated people as well as those who are more likely to contract the infection.
During the outbreak, more than half of the respondents rated the psychological impact as moderate anxiety. Thus, the psychological needs during the outbreak should be addressed appropriately. Our results highlight the need to promote protective personal health practices to interrupt the transmission of the (2019-nCoV) in the community. Therefore, educational public programs about preventive measures should be targeted at the identified groups with low current uptake of precautions.
novel coronavirus 2019
General Anxiety Disorder 7-item scale
Ministry of Health and Population

| [1] |
Al-Hazmi A (2016) Challenges presented by MERS coronavirus, and SARS coronavirus to global health. Saudi J Biol Sci 23: 507-511. doi: 10.1016/j.sjbs.2016.02.019

|
| [2] |
Nishiura H, Jung SM, Linton NM, et al. (2020) The extent of transmission of novel coronavirus in Wuhan, China, 2020. J Clin Med 9: 330. doi: 10.3390/jcm9020330
|
| [3] |
Rothan HA, Byrareddy SN (2020) The epidemiology and pathogenesis of coronavirus disease (COVID-19) outbreak. J Autoimmun 109: 102433. doi: 10.1016/j.jaut.2020.102433
|
| [4] |
Muniz-Rodriguez K, Chowell G, Cheung CH, et al. (2020) Doubling Time of the COVID-19 Epidemic by Province, China. Emerg Infect Dis 26: 1912-1914. doi: 10.3201/eid2608.200219
|
| [5] | Guo YR, Cao QD, Hong ZS, et al. (2020) The origin, transmission and clinical therapies on coronavirus disease 2019 (COVID-19) outbreak - an update on the status. Mil Med Res 7: 99-109. |
| [6] | World Health Organization (WHO) WHO Coronavirus Disease (COVID-19) Dashboard (2020) .Available from: https://covid19.who.int/. |
| [7] |
Gilbert M, Pullano G, Pinotti F, et al. (2020) Preparedness and vulnerability of African countries against importations of COVID-19: a modelling study. Lancet 395: 871-877. doi: 10.1016/S0140-6736(20)30411-6
|
| [8] |
Medhat MA, El Kassas M (2020) COVID-19 in Egypt: Uncovered figures or a different situation? J Glob Health 10: 010368. doi: 10.7189/jogh.10.010368
|
| [9] | Centers for Disease Control and Prevention Principles of epidemiology in public health practice (2020) .Available from: https://www.cdc.gov/csels/dsepd/ss1978/lesson3/section2.html. |
| [10] | Presidency of the Council of Ministers COVID 19 update in Egypt (2020) .Available from: https://www.care.gov.eg/EgyptCare/Index.aspx. |
| [11] | Pan American Health Organization (PAHO/WHO) (2019) Protecting mental health during epidemics. American Health Organization. Available from: https://www.paho.org/en/documents/protecting-mental-health-duringepidemics. |
| [12] | Ahorsu DK, Lin CY, Imani V, et al. (2020) The Fear of COVID-19 Scale: Development and Initial Validation. Int J Ment Health Addict 1: 1-9. |
| [13] |
De Berardis D, Fornaro M, Valchera A, et al. (2018) Eradicating Suicide at Its Roots: Preclinical Bases and Clinical Evidence of the Efficacy of Ketamine in the Treatment of Suicidal Behaviors. Int J Mol Sci 19: 2888. doi: 10.3390/ijms19102888
|
| [14] | Harper CA, Satchell LP, Fido D, et al. (2020) Functional fear predicts public health compliance in the COVID-19 pandemic. Int J Ment Health Addict 1: 1-14. |
| [15] |
Rubin GJ, Potts HWW, Michie S (2010) The impact of communications about swine flu (influenza A H1N1v) on public responses to the outbreak: Results from 36 national telephone surveys in the UK. Health Technol Assess 14: 183-266. doi: 10.3310/hta14340-03
|
| [16] | Leung GM (2009) Community psycho-behavioral surveillance and related impact on outbreak control in Hong Kong and Singapore during the SARS epidemic. Hong Kong Med J 15: 30-34. |
| [17] |
Spitzer RL, Kroenke K, Williams JB, et al. (2006) A brief measure for assessing generalized anxiety disorder: the GAD-7. Arch Intern Med 166: 1092-1097. doi: 10.1001/archinte.166.10.1092
|
| [18] |
Leung GM (2003) The impact of community psychological responses on outbreak control for severe acute respiratory syndrome in Hong Kong. J Epidemiol Community Health 57: 857-863. doi: 10.1136/jech.57.11.857
|
| [19] |
Wang C, Pan R, Wan X, et al. (2020) Immediate psychological responses and associated factors during the initial stage of the 2019 coronavirus disease (COVID-19) Epidemic among the general population in China. Int J Environ Res Public Health 17: 1729. doi: 10.3390/ijerph17051729
|
| [20] | Xu K, Cai H, Shen Y, et al. (2020) Management of coronavirus disease-19 (COVID-19): The Zhejiang experience. IMD 49: 147-157. |
| [21] |
Al-Rabiaah A, Temsah MH, Al-Eyadhy AA, et al. (2020) Middle East respiratory syndrome-corona virus (MERS-CoV) associated stress among medical students at a university teaching hospital in Saudi Arabia. J Infect Public Health 5: 687-691. doi: 10.1016/j.jiph.2020.01.005
|
| [22] |
El-Zoghby SM, Soltan EM, Salama HM (2020) Impact of the COVID-19 Pandemic on Mental Health and Social Support among Adult Egyptians. J Community Health 45: 689-695. doi: 10.1007/s10900-020-00853-5
|
| [23] |
Wong JG, Cheung EP, Cheung V, et al. (2004) Psychological responses to the SARS outbreak in healthcare students in Hong Kong. Med Teach 26: 657-659. doi: 10.1080/01421590400006572
|
| [24] |
Bergeron SL, Sanchez AL (2005) Media effects on students during SARS out-break. Emerg Infect Dis 11: 732-734. doi: 10.3201/eid1105.040512
|
| [25] |
Dhaheri AS, Bataineh MF, Mohamad M, et al. (2021) Impact of COVID-19 on mental health and quality of life: Is there any effect? A cross-sectional study of the MENA region. Plos One 16: e0249107. doi: 10.1371/journal.pone.0249107
|
| [26] |
Soni M, Curran VH, Kamboj SK (2013) Identification of a narrow post-ovulatory window of vulnerability to distressing involuntary memories in healthy women. Neurobiol Learn Mem 104: 32-38. doi: 10.1016/j.nlm.2013.04.003
|
| [27] |
Popay J, Bartley M, Owen C (1993) Gender inequalities in health: social position, affective disorders and minor physical morbidity. Soc Sci Med 36: 21-32. doi: 10.1016/0277-9536(93)90302-K
|
| [28] |
Lamb V (1997) Gender differences in correlates of disablement among the elderly in Egypt. Soc Sci Med 45: 127-136. doi: 10.1016/S0277-9536(96)00326-7
|
| [29] | CDC Reducing Stigma (2020) .Available from: https://www.cdc.gov/coronavirus/2019-ncov/daily-life-coping/reducing-stigma.html. |
| [30] | WHO (2020) Mental Health and Psychosocial Considerations During the COVID-19 Outbreak. Available from: https://www.who.int/docs/default-source/coronaviruse/mental-health-considerations.pdf. |
| [31] | UNICEF Social Stigma Associated with the Coronavirus Disease (COVID-19) (2020) .Available from: https://www.unicef.org/documents/social-stigma-associated-coronavirus-disease-covid-19. |
 publichealth-09-01-003-s001.pdf publichealth-09-01-003-s001.pdf |
 |
Figures(3) / Tables(3)

Doaa M Magdy, Ahmed Metwally, Omar Magdy. Assessment of community psycho-behavioral responses during the outbreak of novel coronavirus (2019-nCoV): a cross-sectional study[J]. AIMS Public Health, 2022, 9(1): 26-40. doi: 10.3934/publichealth.2022003


 DownLoad: