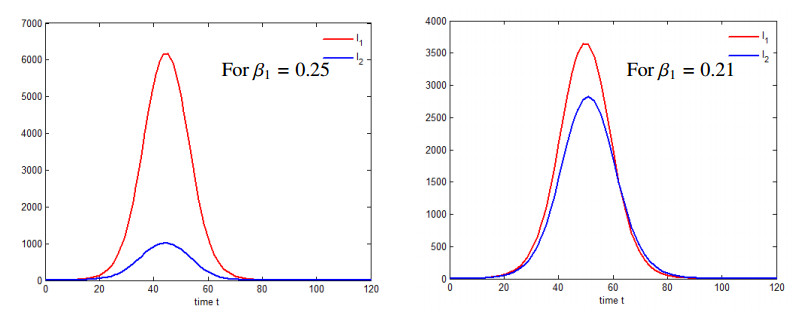
We propose an epidemiological model for the interaction of either two viruses or viral strains with cross-immunity, where the individuals infected by the first virus cannot be infected by the second one, and without cross-immunity, where a secondary infection can occur. The model incorporates distributed recovery and death rates and consists of integro-differential equations governing the dynamics of susceptible, infectious, recovered, and dead compartments. Assuming that the recovery and death rates are uniformly distributed in time throughout the duration of the diseases, we can simplify the model to a conventional ordinary differential equation (ODE) model. Another limiting case arises if the recovery and death rates are approximated by the delta-function, thereby resulting in a new point-wise delay model that incorporates two time delays corresponding to the durations of the diseases. We establish the positiveness of solutions for the distributed delay models and determine the basic reproduction number and an estimate for the final size of the epidemic for the delay model. According to the results of the numerical simulations, both strains can coexist in the population if the disease transmission rates for them are close to each other. If the difference between them is sufficiently large, then one of the strains dominates and eliminates the other one.
Citation: Mohammed Meziane, Ali Moussaoui, Vitaly Volpert. On a two-strain epidemic model involving delay equations[J]. Mathematical Biosciences and Engineering, 2023, 20(12): 20683-20711. doi: 10.3934/mbe.2023915
We propose an epidemiological model for the interaction of either two viruses or viral strains with cross-immunity, where the individuals infected by the first virus cannot be infected by the second one, and without cross-immunity, where a secondary infection can occur. The model incorporates distributed recovery and death rates and consists of integro-differential equations governing the dynamics of susceptible, infectious, recovered, and dead compartments. Assuming that the recovery and death rates are uniformly distributed in time throughout the duration of the diseases, we can simplify the model to a conventional ordinary differential equation (ODE) model. Another limiting case arises if the recovery and death rates are approximated by the delta-function, thereby resulting in a new point-wise delay model that incorporates two time delays corresponding to the durations of the diseases. We establish the positiveness of solutions for the distributed delay models and determine the basic reproduction number and an estimate for the final size of the epidemic for the delay model. According to the results of the numerical simulations, both strains can coexist in the population if the disease transmission rates for them are close to each other. If the difference between them is sufficiently large, then one of the strains dominates and eliminates the other one.

| [1] |
M. Barthélemy, A. Barrat, R. Pastor-Satorras, A. Vespignani, Dynamical patterns of epidemic outbreaks in complex heterogeneous networks, J. Theor. Biol., 235 (2005), 275–288. https://doi.org/10.1016/j.jtbi.2005.01.011 doi: 10.1016/j.jtbi.2005.01.011

|
| [2] |
S. Fisher-Hoch, L. Hutwagner, Opportunistic candidiasis: an epidemic of the 1980s, Clin. Infect. Dis., 21 (1995), 897–904. https://doi.org/10.1093/clinids/21.4.897 doi: 10.1093/clinids/21.4.897
|
| [3] |
C. Chintu, U. H. Athale, P. Patil, hildhood cancers in zambia before and after the hiv epidemic, Arch. Dis. Child., 73 (1995), 100–105. https://doi.org/10.1136/adc.73.2.100 doi: 10.1136/adc.73.2.100
|
| [4] |
R. M. Anderson, C. Fraser, A. C. Ghani, C. A. Donnelly, S. Riley, N. M. Ferguson, et al., Epidemiology, transmission dynamics and control of SARS: the 2002–2003 epidemic, Philos. Trans. R. Soc. London Ser. B Biol. Sci., 359 (2004), 1091–1105. https://doi.org/10.1098/rstb.2004.1490 doi: 10.1098/rstb.2004.1490
|
| [5] |
W. Lam, N. Zhong, W. Tan, Overview on sars in asia and the world, Respirology, 8 (2003), S2–S5. https://doi.org/10.1046/j.1440-1843.2003.00516.x doi: 10.1046/j.1440-1843.2003.00516.x
|
| [6] |
H. Chen, G. Smith, K. Li, J. Wang, X. Fan, J. Rayner, et al., Establishment of multiple sublineages of H5N1 influenza virus in Asia: implications for pandemic control, Proc. Natl. Acad. Sci., 103 (2006), 2845–2850. https://doi.org/10.1073/pnas.0511120103 doi: 10.1073/pnas.0511120103
|
| [7] |
A. M. Kilpatrick, A. A. Chmura, D. W. Gibbons, R. C. Fleischer, P. P. Marra, P. Daszak, Predicting the global spread of h5n1 avian influenza, Proc. Natl. Acad. Sci., 103 (2006), 19368–19373. https://doi.org/10.1073/pnas.0609227103 doi: 10.1073/pnas.0609227103
|
| [8] |
S. Jain, L. Kamimoto, A. M. Bramley, A. M. Schmitz, S. R. Benoit, J. Louie, et al., Hospitalized patients with 2009 H1N1 influenza in the United States, April–June 2009, New Engl. J. Med., 361 (2009), 1935–1944. https://doi.org/10.1056/NEJMoa0906695 doi: 10.1056/NEJMoa0906695
|
| [9] |
M. P. Girard, J. S. Tam, O. M. Assossou, M. P. Kieny, The 2009 A (H1N1) influenza virus pandemic: A review, Vaccine, 28 (2010), 4895–4902. https://doi.org/10.1016/j.vaccine.2010.05.031 doi: 10.1016/j.vaccine.2010.05.031
|
| [10] |
T. R. Frieden, I. Damon, B. P. Bell, T. Kenyon, S. Nichol, Ebola 2014—new challenges, new global response and responsibility, New Engl. J. Med., 371 (2014), 1177–1180. https://doi.org/10.1056/NEJMp1409903 doi: 10.1056/NEJMp1409903
|
| [11] |
W. E. R. Team, Ebola virus disease in West Africa—the first 9 months of the epidemic and forward projections, New Engl. J. Med., 371 (2014), 1481–1495. https://doi.org/10.1056/NEJMoa1411100 doi: 10.1056/NEJMoa1411100
|
| [12] |
T. Haschka, E. Vergu, B. Roche, C. Poletto, L. Opatowski, Retrospective analysis of SARS-CoV-2 omicron invasion over delta in French regions in 2021–22: a status-based multi-variant model, BMC Infect. Dis., 22 (2022), 815. https://doi.org/10.1186/s12879-022-07821-5 doi: 10.1186/s12879-022-07821-5
|
| [13] |
A. Sigal, R. Milo, W. Jassat, Estimating disease severity of Omicron and Delta SARS-CoV-2 infections, Nat. Rev. Immunol., 22 (2022), 267–269. https://doi.org/10.1038/s41577-022-00720-5 doi: 10.1038/s41577-022-00720-5
|
| [14] |
W. O. Kermack, A. G. McKendrick, A contribution to the mathematical theory of epidemics, Proc. R. Soc. London Ser. A Containing Papers A Math. Phys. Charact., 115 (1927), 700–721. https://doi.org/10.1098/rspa.1927.0118 doi: 10.1098/rspa.1927.0118
|
| [15] |
S. Sharma, V. Volpert, M. Banerjee, Extended SEIQR type model for COVID-19 epidemic and data analysis, Math. Biosci. Eng., 17 (2020), 7562–7604. https://doi.org/10.1101/2020.08.10.20171439 doi: 10.1101/2020.08.10.20171439
|
| [16] |
M. A. Khan, A. Atangana, Mathematical modeling and analysis of COVID-19: A study of new variant Omicron, Phys. A Stat. Mech. Appl., 599 (2022), 127452. https://doi.org/10.1016/j.physa.2022.127452 doi: 10.1016/j.physa.2022.127452
|
| [17] |
F. Brauer, Compartmental models in epidemiology, Math. Epidemiol., (2008), 19–79. https://doi.org/10.1007/978-3-540-78911-6_2 doi: 10.1007/978-3-540-78911-6_2
|
| [18] | J. Arino, P. Van Den Driessche, The basic reproduction number in a multi-city compartmental epidemic model, in Positive Systems: Proceedings of the First Multidisciplinary International Symposium on Positive Systems: Theory and Applications (POSTA 2003), (2004), 135–142. https://doi.org/10.1007/978-3-540-44928-7_19 |
| [19] |
J. Arino, Mathematical epidemiology in a data-rich world, Infect. Dis. Modell., 5 (2020), 161–188. https://doi.org/10.1016/j.idm.2019.12.008 doi: 10.1016/j.idm.2019.12.008
|
| [20] |
A. d'Onofrio, M. Banerjee, P. Manfredi, Spatial behavioural responses to the spread of an infectious disease can suppress turing and turing–hopf patterning of the disease, Phys. A Stat. Mech. Appl., 545 (2020), 123773. https://doi.org/10.1016/j.physa.2019.123773 doi: 10.1016/j.physa.2019.123773
|
| [21] |
G. Q. Sun, Z. Jin, Q. X. Liu, L. Li, Chaos induced by breakup of waves in a spatial epidemic model with nonlinear incidence rate, J. Stat. Mech. Theory Exp., 2008 (2008), P08011. https://doi.org/10.1088/1742-5468/2008/08/P08011 doi: 10.1088/1742-5468/2008/08/P08011
|
| [22] |
D. Bichara, A. Iggidr, Multi-patch and multi-group epidemic models: a new framework, J. Math. Biol., 77 (2018), 107–134. https://doi.org/10.1007/s00285-017-1191-9 doi: 10.1007/s00285-017-1191-9
|
| [23] |
R. K. McCormack, L. J. Allen, Multi-patch deterministic and stochastic models for wildlife diseases, J. Biol. Dyn., 1 (2007), 63–85. https://doi.org/10.1080/17513750601032711 doi: 10.1080/17513750601032711
|
| [24] |
E. H. Elbasha, A. B. Gumel, Vaccination and herd immunity thresholds in heterogeneous populations, J. Math. Biol., 83 (2021), 73. https://doi.org/10.1007/s00285-021-01686-z doi: 10.1007/s00285-021-01686-z
|
| [25] |
S. Aniţa, M. Banerjee, S. Ghosh, V. Volpert, Vaccination in a two-group epidemic model, Appl. Math. Lett., 119 (2021), 107197. https://doi.org/10.1016/j.aml.2021.107197 doi: 10.1016/j.aml.2021.107197
|
| [26] |
T. S. Faniran, A. Ali, N. E. Al-Hazmi, J. K. K. Asamoah, T. A. Nofal, M. O. Adewole, New variant of SARS-CoV-2 dynamics with imperfect vaccine, Complexity, 2022 (2022). https://doi.org/10.1155/2022/1062180 doi: 10.1155/2022/1062180
|
| [27] |
T. Nguyen-Huu, P. Auger, A. Moussaoui. On incidence-dependent management strategies against an SEIRS epidemic: Extinction of the epidemic using Allee effect, Mathematics, 11 (2023), 2822. https://doi.org/10.3390/math11132822 doi: 10.3390/math11132822
|
| [28] |
A. Moussaoui, E. H. Zerga, Transmission dynamics of COVID-19 in Algeria: The impact of physical distancing and face masks, AIMS Publ. Health, 7 (2020), 816. https://doi.org/10.3934/publichealth.2020063 doi: 10.3934/publichealth.2020063
|
| [29] |
P. Auger, A. Moussaoui, On the threshold of release of confinement in an epidemic SEIR model taking into account the protective effect of mask, Bull. Math. Biol., 83 (2021), 25. https://doi.org/10.1007/s11538-021-00858-8 doi: 10.1007/s11538-021-00858-8
|
| [30] |
A. Moussaoui, P. Auger, Prediction of confinement effects on the number of COVID-19 outbreak in Algeria, Math. Modell. Nat. Phenom., 15 (2020), 37. https://doi.org/10.1051/mmnp/2020028 doi: 10.1051/mmnp/2020028
|
| [31] |
N. Ahmed, Z. Wei, D. Baleanu, M. Rafiq, M. Rehman, Spatio-temporal numerical modeling of reaction-diffusion measles epidemic system, Chaos An Interdiscip. J. Nonlinear Sci., 29 (2019), 103101. https://doi.org/10.1063/1.5116807 doi: 10.1063/1.5116807
|
| [32] |
J. Filipe, M. Maule, Effects of dispersal mechanisms on spatio-temporal development of epidemics, J. Theor. Biol., 226 (2004), 125–141. https://doi.org/10.1016/s0022-5193(03)00278-9 doi: 10.1016/s0022-5193(03)00278-9
|
| [33] |
M. De la Sen, A. Ibeas, S. Alonso-Quesada, R. Nistal, On a new epidemic model with asymptomatic and dead-infective subpopulations with feedback controls useful for Ebola disease, Discrete Dyn. Nat. Soc., 2017 (2017). https://doi.org/10.1155/2017/4232971 doi: 10.1155/2017/4232971
|
| [34] |
S. Chen, Y. Ran, H. Huang, Z. Wang, K. k. Shang, Epidemic dynamics of two-pathogen spreading for pairwise models, Mathematics, 10 (2022), 1906. https://doi.org/10.3390/math10111906 doi: 10.3390/math10111906
|
| [35] | M. Martcheva, An Introduction to Mathematical Epidemiology, Springer, 2015. https://doi.org/10.1007/978-1-4899-7612-3 |
| [36] | F. Brauer, C. Castillo-Chavez, Z. Feng, Mathematical Models in Epidemiology, Springer, 2019. https://doi.org/10.1007/978-1-4939-9828-9 |
| [37] |
H. W. Hethcote, The mathematics of infectious diseases, SIAM Rev., 42 (2000), 599–653. https://doi.org/10.1137/S0036144500371907 doi: 10.1137/S0036144500371907
|
| [38] |
H. S. Hurd, J. B. Kaneene, The application of simulation models and systems analysis in epidemiology: a review, Prev. Vet. Med., 15 (1993), 81–99. https://doi.org/10.1016/0167-5877(93)90105-3 doi: 10.1016/0167-5877(93)90105-3
|
| [39] |
E. Beretta, Y. Takeuch, Global stability of an sir epidemic model with time delays, J. Math. Biol., 33 (1995), 250–260. https://doi.org/10.1007/BF00169563 doi: 10.1007/BF00169563
|
| [40] |
K. L. Cooke, P. Van Den Driessche, Analysis of an seirs epidemic model with two delays, J. Math. Biol., 35 (1996), 240–260. https://doi.org/10.1007/s002850050051 doi: 10.1007/s002850050051
|
| [41] |
C. C. McCluskey, Complete global stability for an sir epidemic model with de- lay—distributed or discrete, Nonlinear Anal. Real World Appl., 11 (2010), 55–59. https://doi.org/10.1016/j.nonrwa.2008.10.014 doi: 10.1016/j.nonrwa.2008.10.014
|
| [42] |
G. Zaman, Y. H. Kang, I. H. Jung, Optimal treatment of an sir epidemic model with time delay, BioSystems, 98 (2009), 43–50. https://doi.org/10.1016/j.biosystems.2009.05.006 doi: 10.1016/j.biosystems.2009.05.006
|
| [43] |
S. Ghosh, V. Volpert, M. Banerjee, An epidemic model with time-distributed recovery and death rates, Bull. Math. Biol., 84 (2022), 78. https://doi.org/10.1007/s11538-022-01028-0 doi: 10.1007/s11538-022-01028-0
|
| [44] |
S. Ghosh, V. Volpert, M. Banerjee, An epidemic model with time delay determined by the disease duration, Mathematics, 10 (2022), 2561. https://doi.org/10.3390/math10152561 doi: 10.3390/math10152561
|
| [45] |
M. Saade, S. Ghosh, M. Banerjee, V. Volper, An epidemic model with time delays determined by the infectivity and disease durations, Math. Biosci. Eng., 20 (2023), 12864–12888. https://doi.org/10.3934/mbe.2023574 doi: 10.3934/mbe.2023574
|
| [46] |
A. Abbey, Y. Shahar, O. Mokryn, Analysis of the competition among viral strains using a temporal interaction-driven contagion model, Sci. Rep., 12 (2022), 9616. https://doi.org/10.1038/s41598-022-13432-6 doi: 10.1038/s41598-022-13432-6
|


Figures(7)

Mohammed Meziane, Ali Moussaoui, Vitaly Volpert. On a two-strain epidemic model involving delay equations[J]. Mathematical Biosciences and Engineering, 2023, 20(12): 20683-20711. doi: 10.3934/mbe.2023915


 DownLoad: