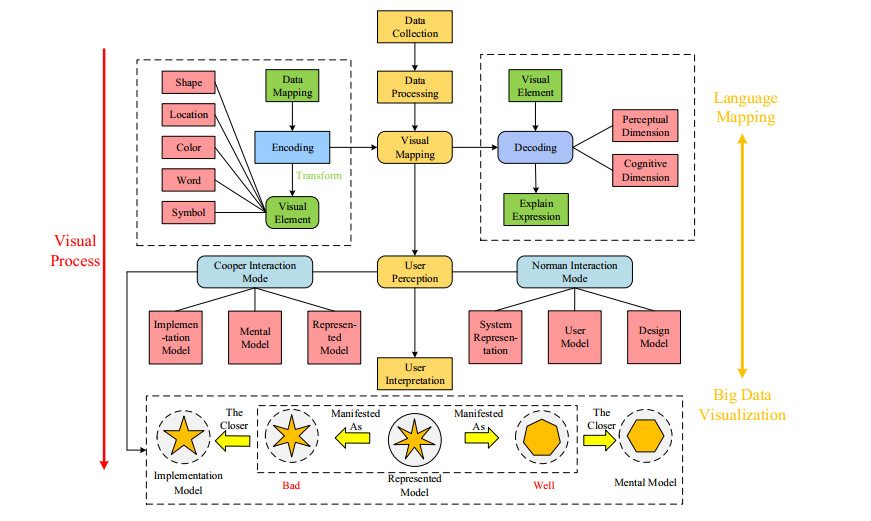
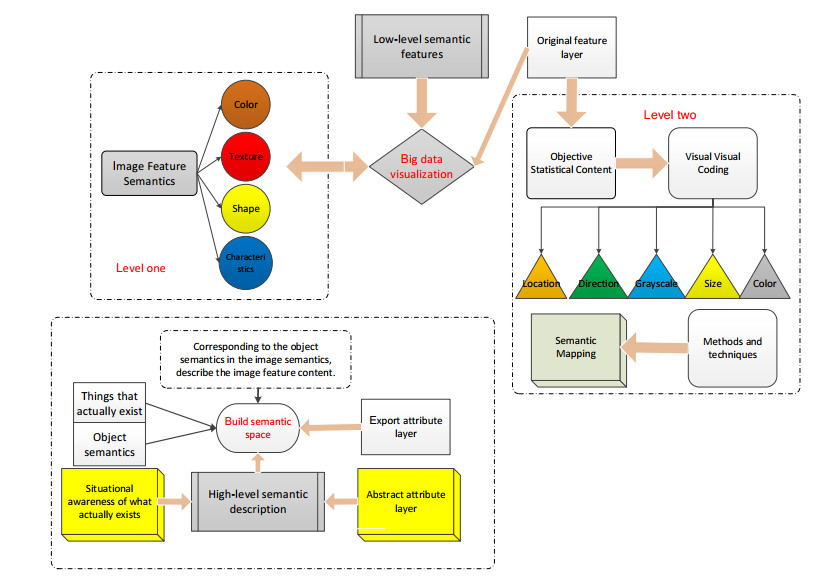
Nowadays, the convergence of intelligent computing technique and education has been a hot concern for both academia and industry, producing the conception of smart education. It is predictable that automatic planning and scheduling for course contents are the most practical important task for smart education. As online and offline educational activities are visual behaviors, it remains challenging to capture and extract principal features. To breakthrough current barriers, this paper combines the visual perception technology and data mining theory, and proposes a multimedia knowledge discovery-based optimal scheduling approach in smart education about painting. At first, the data visualization is carried out to analyze the adaptive design of visual morphologies. On this basis, it is supposed to formulate a multimedia knowledge discovery framework which can implement multimodal inference tasks, so as to calculate specific course contents for specific individuals. At last, some simulation works are also conducted to obtain analysis results, showing that the proposed optimal scheduling scheme can work well in contents planning of smart education scenarios.
Citation: Zhipeng Ding, Hongxia Yun, Enze Li. A multimedia knowledge discovery-based optimal scheduling approach considering visual behavior in smart education[J]. Mathematical Biosciences and Engineering, 2023, 20(3): 5901-5916. doi: 10.3934/mbe.2023254
Nowadays, the convergence of intelligent computing technique and education has been a hot concern for both academia and industry, producing the conception of smart education. It is predictable that automatic planning and scheduling for course contents are the most practical important task for smart education. As online and offline educational activities are visual behaviors, it remains challenging to capture and extract principal features. To breakthrough current barriers, this paper combines the visual perception technology and data mining theory, and proposes a multimedia knowledge discovery-based optimal scheduling approach in smart education about painting. At first, the data visualization is carried out to analyze the adaptive design of visual morphologies. On this basis, it is supposed to formulate a multimedia knowledge discovery framework which can implement multimodal inference tasks, so as to calculate specific course contents for specific individuals. At last, some simulation works are also conducted to obtain analysis results, showing that the proposed optimal scheduling scheme can work well in contents planning of smart education scenarios.

| [1] |
Z. Cai, X. Zheng, A private and efficient mechanism for data uploading in smart cyber-physical systems, IEEE Trans. Network Sci. Eng., 7 (2020), 766–775, https://doi.org/10.1109/TNSE.2018.2830307 doi: 10.1109/TNSE.2018.2830307

|
| [2] |
L. Zhao, Z. Bi, A. Hawbani, K. Yu, Y. Zhang, M. Guizani, ELITE: An intelligent digital twin-based hierarchical routing scheme for softwarized vehicular networks, IEEE Trans. Mob. Comput., 8 (2022), 1–9. https://doi.org/10.1109/TMC.2022.3179254 doi: 10.1109/TMC.2022.3179254
|
| [3] |
Y. Li, H. Ma, L. Wang, S. Mao, G. Wang, Optimized content caching and user association for edge computing in densely deployed heterogeneous networks, IEEE Trans. Mob. Comput., 21 (2022), 2130–2142. https://doi.org/10.1109/TMC.2020.3033563 doi: 10.1109/TMC.2020.3033563
|
| [4] |
Z. Zhou, Spatio-temporal feature encoding for traffic accident detection in VANET environment, IEEE Trans. Intell. Transp. Syst., 17 (2022), 1–10. https://doi.org/10.1109/TITS.2022.3147826 doi: 10.1109/TITS.2022.3147826
|
| [5] |
S. Xia, Z. Yao, Y. Li, S. Mao, Online distributed offloading and computing resource management with energy harvesting for heterogeneous MEC-enabled IoT, IEEE Trans. Wireless Commun., 20 (2021), 6743–6757, https://doi.org/10.1109/TWC.2021.3076201 doi: 10.1109/TWC.2021.3076201
|
| [6] |
L. Huang, Throughput guarantees for multi-cell wireless powered communication networks with non-orthogonal multiple access, IEEE Trans. Veh. Technol., 19 (2022), 1–11. https://doi.org/10.1109/TVT.2022.3189699 doi: 10.1109/TVT.2022.3189699
|
| [7] |
D. Peng, D. He, Y. Li, Z. Wang, Integrating terrestrial and satellite multibeam systems toward 6G: Techniques and challenges for interference mitigation, IEEE Wireless Commun., 29 (2022), 24–31. https://doi.org/10.1109/MWC.002.00293 doi: 10.1109/MWC.002.00293
|
| [8] |
Z. Guo, Deep Information fusion-driven POI scheduling for mobile social networks, IEEE Network, 36 (2022), 210–216, https://doi.org/10.1109/MNET.102.2100394 doi: 10.1109/MNET.102.2100394
|
| [9] |
F. Kong, Application of artificial intelligence in modern art teaching, Int. J. Emerging Technol. Learn., 15 (2020), 238–251. https://doi.org/10.3991/ijet.v15i13.15351 doi: 10.3991/ijet.v15i13.15351
|
| [10] |
G. Elia, G. Solazzo, G. Lorenzo, Assessing learners' satisfaction in collaborative online courses through a big data approach, Comput. Hum. Behav., 92 (2019), 589–599. https://doi.org/10.1016/j.chb.2018.04.033 doi: 10.1016/j.chb.2018.04.033
|
| [11] |
M. Cantabella, R. Martínez-España, B. Ayuso, Analysis of student behavior in learning management systems through a big data framework, Future Gener. Comput. Syst., 90 (2019), 262–272. https://doi.org/10.1016/j.future.2018.08.003 doi: 10.1016/j.future.2018.08.003
|
| [12] |
F. Amalina, I. A. T. Hashem, Z. H. Azizul, Blending big data analytics: Review on challenges and a recent study, IEEE Access, 8 (2019), 3629–3645, https://doi.org/10.1109/ACCESS.2019.2923270 doi: 10.1109/ACCESS.2019.2923270
|
| [13] |
A. Mohamed, M. K. Najafabadi, Y. B. Wah, The state of the art and taxonomy of big data analytics: View from new big data framework, Artif. Intell. Rev., 53 (2020), 989–1037. https://doi.org/10.1007/s10462-019-09685-9 doi: 10.1007/s10462-019-09685-9
|
| [14] |
M. K. Saggi, S. Jain, A survey towards an integration of big data analytics to big insights for value-creation, Inf. Process. Manage., 54 (2018), 758–790. https://doi.org/10.1016/j.ipm.2018.01.010 doi: 10.1016/j.ipm.2018.01.010
|
| [15] |
C. Lido, K. Reid, M. Osborne, Life wide learning in the city: Novel big data approaches to exploring learning with large-scale surveys, GPS, and social media, Oxford Rev. Educ., 45 (2019), 279–295. https://doi.org/10.1080/03054985.2018.1554531 doi: 10.1080/03054985.2018.1554531
|
| [16] |
M. S. Hossain, G. Muhammad, Emotion recognition using deep learning approach from audio-visual emotional big data, Inf. Fusion, 49 (2019), 69–78. https://doi.org/10.1016/j.inffus.2018.09.008 doi: 10.1016/j.inffus.2018.09.008
|
| [17] |
A. Greasley, J. S. Edwards, Enhancing discrete-event simulation with big data analytics: A review, J. Oper. Res. Soc., 72 (2021), 247–267, https://doi.org/10.1080/01605682.2019.1678406 doi: 10.1080/01605682.2019.1678406
|
| [18] |
D. Geng, C. Zhan, C. Xia, Big data-based improved data acquisition and storage system for designing industrial data platform, IEEE Access, 7 (2019), 44574–44582. https://doi.org/10.1109/ACCESS.2019.2909060 doi: 10.1109/ACCESS.2019.2909060
|
| [19] |
M. Shorfuzzaman, M. S. Hossain, A. Nazir, Harnessing the power of big data analytics in the cloud to support learning analytics in mobile learning environment, Comput. Hum. Behav., 92 (2019), 578–588. https://doi.org/10.1016/j.chb.2018.07.002 doi: 10.1016/j.chb.2018.07.002
|
| [20] |
K. Y. Chan, C. K. Kwong, P. Wongthongtham, Affective design using machine learning: A survey and its prospect of conjoining big data, Int. J. Comput. Integr. Manuf., 33 (2020), 645–669. https://doi.org/10.1080/0951192X.2018.1526412 doi: 10.1080/0951192X.2018.1526412
|
Figures(8) / Tables(1)

Zhipeng Ding, Hongxia Yun, Enze Li. A multimedia knowledge discovery-based optimal scheduling approach considering visual behavior in smart education[J]. Mathematical Biosciences and Engineering, 2023, 20(3): 5901-5916. doi: 10.3934/mbe.2023254


 DownLoad: