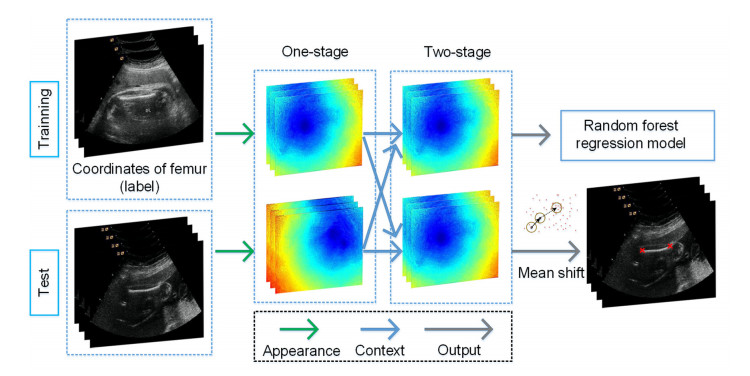
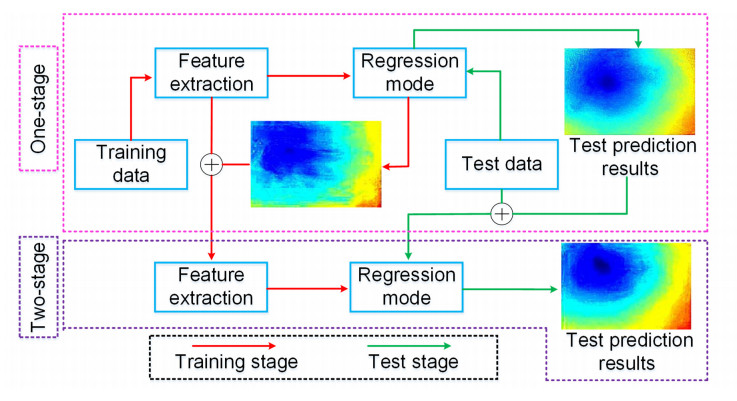
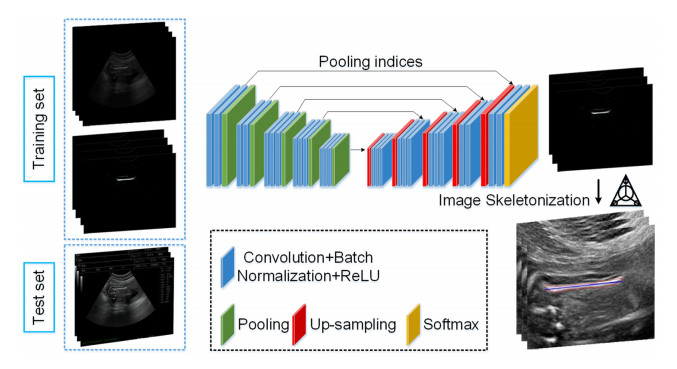
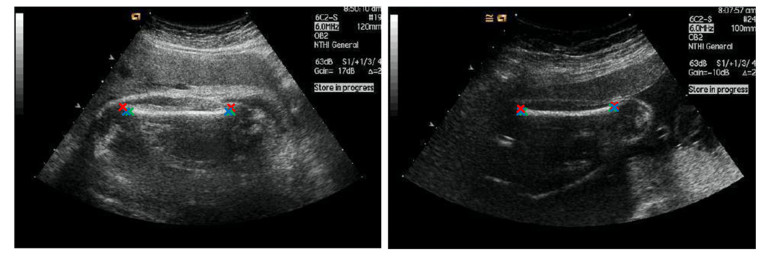
The aim of this work is the preliminary clinical validation and accuracy evaluation of our automatic algorithms in assessing progression fetal femur length (FL) in ultrasound images. To compare the random forest regression model with the SegNet model from the two aspects of accuracy and robustness. In this study, we proposed a traditional machine learning method to detect the endpoints of FL based on a random forest regression model. Deep learning methods based on SegNet were proposed for the automatic measurement method of FL, which utilized skeletonization processing and improvement of the full convolution network. Then the automatic measurement results of the two methods were evaluated quantitatively and qualitatively with the results marked by doctors. 436 ultrasonic fetal femur images were evaluated by the two methods above. Compared the results of the above three methods with doctor's manual annotations, the automatic measurement method of femur length based on the random forest regression model was 1.23 ± 4.66 mm and the method based on SegNet was 0.46 ± 2.82 mm. The indicator for evaluating distance was significantly lower than the previous literature. Measurement method based SegNet performed better in the case of femoral end adhesion, low contrast, and noise interference similar to the shape of the femur. The segNet-based method achieves promising performance compared with the random forest regression model, which can improve the examination accuracy and robustness of the measurement of fetal femur length in ultrasound images.
Citation: Fengcheng Zhu, Mengyuan Liu, Feifei Wang, Di Qiu, Ruiman Li, Chenyang Dai. Automatic measurement of fetal femur length in ultrasound images: a comparison of random forest regression model and SegNet[J]. Mathematical Biosciences and Engineering, 2021, 18(6): 7790-7805. doi: 10.3934/mbe.2021387
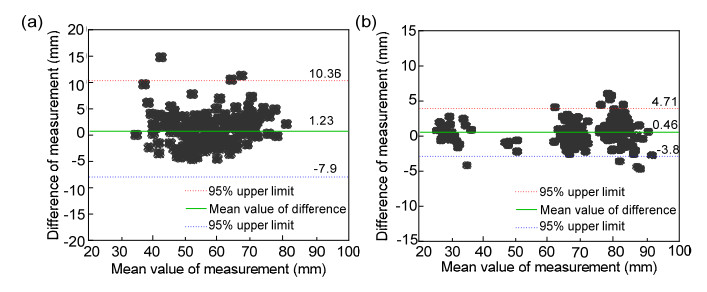
The aim of this work is the preliminary clinical validation and accuracy evaluation of our automatic algorithms in assessing progression fetal femur length (FL) in ultrasound images. To compare the random forest regression model with the SegNet model from the two aspects of accuracy and robustness. In this study, we proposed a traditional machine learning method to detect the endpoints of FL based on a random forest regression model. Deep learning methods based on SegNet were proposed for the automatic measurement method of FL, which utilized skeletonization processing and improvement of the full convolution network. Then the automatic measurement results of the two methods were evaluated quantitatively and qualitatively with the results marked by doctors. 436 ultrasonic fetal femur images were evaluated by the two methods above. Compared the results of the above three methods with doctor's manual annotations, the automatic measurement method of femur length based on the random forest regression model was 1.23 ± 4.66 mm and the method based on SegNet was 0.46 ± 2.82 mm. The indicator for evaluating distance was significantly lower than the previous literature. Measurement method based SegNet performed better in the case of femoral end adhesion, low contrast, and noise interference similar to the shape of the femur. The segNet-based method achieves promising performance compared with the random forest regression model, which can improve the examination accuracy and robustness of the measurement of fetal femur length in ultrasound images.

| [1] | W. J. Cong, J. Yang, D. N. Ai, H. Song, G. Chen, X. H. Liang, et al., Global patch matching (GPM) for freehand 3D ultrasound reconstruction, BioMed. Eng. OnLine, 16 (2017), 216-214. |
| [2] | D. T. Avalokita, T. Rismonita, A. Handayani, A. W. Setiawan, Automatic fetal head circumference measurement in 2D ultrasound images based on optimized fast ellipse fitting, in Tencon 2020-2020 IEEE Region 10 Conference (Tencon), IEEE, 2020. |
| [3] |
M. van Tulder, A. Malmivaara, B. Koes, Repetitive strain injury, Lancet, 369 (2007), 1815-1822. doi: 10.1016/S0140-6736(07)60820-4

|
| [4] |
R. Gaillard, E. A. P. Steegers, J. C. de Jongste, A. Hofman, V. W. V. Jaddoe, Tracking of fetal growth characteristics during different trimesters and the risks of adverse birth outcomes, Int. J. Epidemiol., 43 (2014), 1140-1153. doi: 10.1093/ije/dyu036
|
| [5] |
S. Lou, K. Carstensen, I. Vogel, L. Hvidman, C. P. Nielsen, M. Lanther, et al., Receiving a prenatal diagnosis of Down syndrome by phone: a qualitative study of the experiences of pregnant couples, BMJ Open, 9 (2019), e026825. doi: 10.1136/bmjopen-2018-026825
|
| [6] |
R. Qu, G. Xu, C. Ding, W. Jia, M. Sun, Standard plane identification in fetal brain ultrasound scans using a differential convolutional neural network, IEEE Access, 8 (2020), 83821-83830. doi: 10.1109/ACCESS.2020.2991845
|
| [7] | V. Sundaresan, C. P. Bridge, C. Ioannou, J. A. Noble, Automated characterization of the fetal heart in ultrasound images using fully convolutional neural networks, in 2017 IEEE 14th International Symposium on Biomedical Imaging, IEEE, 2020. |
| [8] | S. Andermatt, S. Pezold, P. Cattin, Multi-dimensional gated recurrent units for the segmentation of biomedical 3d-data, in Deep Learning and Data Labeling for Medical Applications, Springer, 2016. |
| [9] | R. P. K. Poudel, P. Lamata, G. Montana, Recurrent fully convolutional neural networks for multi-slice mri cardiac segmentation, in Reconstruction, Segmentation, and Analysis of Medical Images, Springer, Cham, (2016), 83-94. |
| [10] | C. Kroll, F. Milletari, N. Navab, S. A. Ahmadi, Coupling convolutional neural networks and hough voting for robust segmentation of ultrasound volumes, in German Conference on Pattern Recognition, Springer, Cham, (2016), 439-450. |
| [11] |
V. Badrinarayanan, A. Kendall, R. Cipolla, SegNet: a deep convolutional encoder-decoder architecture for scene segmentation, IEEE Trans. Pattern Anal., 39 (2017), 2481-2495. doi: 10.1109/TPAMI.2016.2644615
|
| [12] |
S. Dahdouh, E. D. Angelini, G. Grange, I. Bloch, Segmentation of embryonic and fetal 3D ultrasound images based on pixel intensity distributions and shape priors, Med. Image Anal., 24 (2015), 255-268. doi: 10.1016/j.media.2014.12.005
|
| [13] |
J. A. Noble, D. Boukerroui, Ultrasound image segmentation: A survey, IEEE Trans. Med. Imaging, 25 (2006), 987-1010. doi: 10.1109/TMI.2006.877092
|
| [14] | L. J. Salomon, Z. Alfirevic, V. Berghella, C. Bilardo, E. Hernandez-Andrade, S. L. Johnsen, et al., Practice guidelines for performance of the routine mid-trimester fetal ultrasound scan, Ultrasound Obst. Gyn., 37 (2017), 116-126. |
| [15] |
P. Hu, F. Wu, J. Peng, D. Kong, Automatic 3d liver segmentation based on deep learning and globally optimized surface evolution, Phys. Med. Biol., 61 (2016), 8676-8676. doi: 10.1088/1361-6560/61/24/8676
|
| [16] | T. K. Ho, Random decision forests, in Proceedings of 3rd international conference on document analysis and recognition, IEEE, (1995), 278-282. |
| [17] | J. Gall, V. Lempitsky, Class-specific Hough forests for object detection, in IEEE Conference on Computer Vision & Pattern Recognition, IEEE, 2009. |
| [18] | A. Biswas, S. Dasgupta, S. Das, A. Abraham, A synergy of differential evolution and bacterial foraging optimization for global optimization, Neural Netw. World, 17 (2007), 607-626. |
| [19] |
D. Comaniciu, P. Meer, Mean shift: a robust approach toward feature space analysis, IEEE Trans. Pattern Anal., 24 (2002), 603-619. doi: 10.1109/34.1000236
|
| [20] |
Z. W. Tu, X. G. Chen, A. L. Yuille, S. C. Zhu, Image parsing: unifying segmentation, detection, and recognition, Int. J. Comput. Vision, 63 (2005), 113-140. doi: 10.1007/s11263-005-6642-x
|
| [21] | Y. Gao, D. Shen, Context-aware anatomical landmark detection: application to deformable model initialization in prostate CT images, in Machine Learning in Medical Imaging, Springer, Cham, (2014), 165-173, |
| [22] |
Y. Lu, H. P. Chan, J. Wei, L. M. Hadjiiski, Selective-diffusion regularization for enhancement of microcalcifications in digital breast tomosynthesis reconstruction, Med. Phys., 37 (2010), 6003-6014. doi: 10.1118/1.3505851
|
| [23] |
K. Fukunaga, L. Hostetler, The estimation of the gradient of a density function, with applications in pattern recognition, IEEE Trans. Inf. Theory, 21 (1975), 32-40. doi: 10.1109/TIT.1975.1055330
|
| [24] | W. Liang, X. Xie, J. Wang, Y. Zhang, J. Hu, A SIFT-based mean shift algorithm for moving vehicle tracking, in 2014 IEEE Intelligent Vehicles Symposium Proceedings, IEEE, 2014. |
| [25] |
G. Crichton, S. Pyysalo, B. Chiu, A. Korhonen, A neural network multi-task learning approach to biomedical named entity recognition, BMC Bioinf., 18 (2017), 318-332. doi: 10.1186/s12859-017-1723-8
|
| [26] |
V. Badrinarayanan, A. Kendall, R. Cipolla, Segnet: a deep convolutional encoder-decoder architecture for image segmentation, IEEE Trans. Pattern Anal., 39 (2017), 2481-2495. doi: 10.1109/TPAMI.2016.2644615
|
| [27] |
S. Robert, Models for the perception of speech and visual form: Weiant Wathen-Dunn, J. Commun. Disord., 1 (1968), 342-343. doi: 10.1016/0021-9924(68)90015-4
|
| [28] | A. McKnight, D. Si, K. Al Nasr, A. Chernikov, N. Chrisochoides, J. He, Estimating loop length from CryoEM images at medium resolutions, BMC Struct. Biol., 13 (2013). |
| [29] | J. M. Bland, D. G. Altman, Statistical methods for assessing agreement between two methods of clinical measurement, Lancet, 1 (1986), 307-310. |
| [30] |
S. Rueda, S. Fathima, C. L. Knight, M. Yaqub, A. T. Papageorghiou, B. Rahmatullah, et al., Evaluation and comparison of current fetal ultrasound image segmentation methods for biometric measurements: a grand challenge, IEEE Trans. Med. Imaging, 33 (2014), 797-813. doi: 10.1109/TMI.2013.2276943
|
| [31] | C. W. Wang, Automatic entropy-based femur segmentation and fast length measurement for fetal ultrasound images, in 2014 International Conference on Advanced Robotics and Intelligent Systems, IEEE, 2014. |
| [32] | P. Mukherjee, G. Swamy, M. Gupta, U. Patil, K. B. Krishnan, Automatic detection and measurement of femur length from fetal ultrasonography, in SPIE: Medical Imaging 2010: Ultrasonic Imaging, Tomography, and Therapy, SPIE, 2010. |

Figures(6) / Tables(4)

Fengcheng Zhu, Mengyuan Liu, Feifei Wang, Di Qiu, Ruiman Li, Chenyang Dai. Automatic measurement of fetal femur length in ultrasound images: a comparison of random forest regression model and SegNet[J]. Mathematical Biosciences and Engineering, 2021, 18(6): 7790-7805. doi: 10.3934/mbe.2021387


 DownLoad: