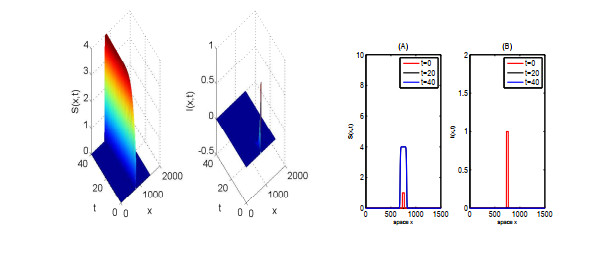
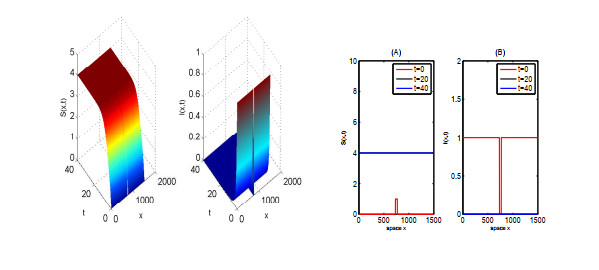
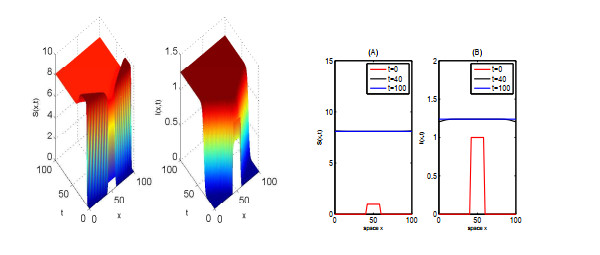
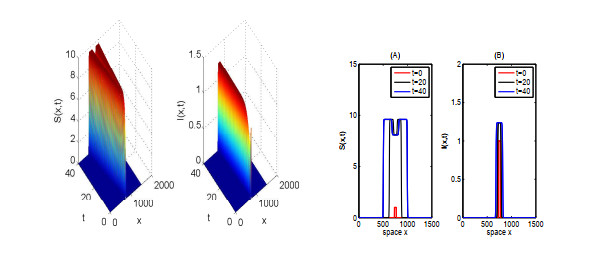
1.
Introduction
Mathematical modeling plays a crucial role in comprehending the transmission dynamics of infectious diseases, predicting the future trajectory of outbreaks, and assessing strategies for epidemic control [1]. Its significance has been underscored by successive epidemics of viral infections, such as HIV since the 1980s [2,3], the SARS epidemic in 2002–2003 [4,5], H5N1 influenza in 2005 [6,7], H1N1 in 2009 [8,9], Ebola in 2014 [10,11], and the recent COVID-19 pandemic [12,13].
Following the classical SIR (susceptible-infected-recovered) model developed by Kermack and McKendrick after the Spanish flu epidemic [14], several notable advancements have been made in epidemiological modeling. These advancements include the development of multi-compartment models [15,16,17,18,19], models incorporating either time-varying or non-linear disease transmission rates [20,21], multi-patch models [22,23], and multi-group models that consider the effect of disease and population heterogeneity [24]. Additionally, there are epidemic models that incorporate vaccinations and other control measures [25,26,27,28,29,30]. Moreover, spatio-temporal models have been employed to describe the random movement of individuals and the spatial distribution of infections [31,32]. In [33], the authors investigated a model that integrated asymptomatic and dead-infective subpopulations, along with vaccination, antiviral treatment controls, and impulsive culling actions. Reference [34] is devoted to multiple pathogen interactions in disease transmission with a susceptible-infected-susceptible (SIS) model for each pathogen. For a comprehensive review of the literature, monographs [35,36] and review articles in [37,38] are available.
Time delays related to infection latency, disease duration and immunity waning directly influence disease transmission dynamics, response strategies, and the overall control of infectious outbreaks [39,40,41,42]. Despite advancements, limited research has been conducted on the impact of time delays in recovery and death rates within epidemiological models. In [43], the authors introduced a compartmental epidemiological model that incorporated distributed recovery and death rates. Under certain assumptions, this model can be reduced to the conventional SIR model. However, in most cases, the dynamics of the epidemic progression in this new model exhibit notable distinctions. To determine the distributed recovery and death rates, the authors evaluated COVID-19 data. By validating the model with epidemiological data from various countries, it demonstrated an improved agreement with the data compared to the SIR model. Furthermore, the authors estimated the time-dependent disease transmission rate. In [44], the authors utilized the average disease duration as the delay parameter to introduce a time delay in the recovery and death rates. The distributed model was discussed, and a delay model was derived. Epidemic characterization of the delay model was obtained. A numerical comparison was conducted among the distributed model, delay model, and conventional SIR model. Additionally, a method to estimate the disease duration using real disease incidence data was presented. The authors validated the delay model using epidemiological data from the COVID-19 epidemic and discussed the main outcomes and epidemiological implications of the proposed model. Moreover, apart from [44], the model proposed in [45] incorporated the infectivity period and disease duration instead of the incubation period, and did not include mandatory quarantine. This model considered the presence of exposed individuals and incorporated two time delays, namely the infectivity and disease duration.
In this study, we investigate epidemic models of either two viruses or viral strains. In the first model, we consider the presence of two viral strains, assuming that individuals recovered from either strain developed immunity to both strains. In the second model, we explore the scenario where individuals who have recovered from the first strain can be infected by the second strain, and similarly, individuals who have recovered from the second strain can be infected by the first strain. Here, we use the aforementioned modeling approach, based on distributed and point-wise delays in recovery and death rates.
The paper is structured as follows. In the first part, we introduce the model with distributed recovery and death rates in the presence of cross-immunity. We thoroughly examine the positiveness of solutions. Next, we reduce the distributed model to a conventional ODE model. Subsequently, we derive the delay model from the distributed model. Additionally, we determine the characteristics of epidemic progression for the delay model. Moreover, this structure is followed for the model without cross-immunity. The main outcomes of the proposed models and their epidemiological implications are discussed in the concluding section.
2.
Model with cross-immunity
The recovery and death rates of infected individuals are influenced by the time elapsed since the onset of the disease. In this section, we will develop a model that takes the number of newly infected individuals and their time-dependent recovery and death rates into account [45]. We will examine various characteristics of this model and demonstrate that the conventional SIR model can be derived from the model under certain assumptions [43,44,45].
2.1. Model formulation
The following compartments of the total population N are considered:
● S(t) - susceptible individuals. They are not infected and can contract the disease.
● I1(t) - infected of the first viral strain. They are infectious and can transmit disease.
● I2(t) - infected of the second viral strain. They are infectious and can transmit disease.
● R1(t) - recovered from the first viral strain. They have recovered from the infection and are no longer infected. They are immune to both strains.
● R2(t) - recovered from the second viral strain. They have recovered from the infection and are no longer infected. They are immune to both strains.
● D1(t) - deceased from the first viral strain.
● D2(t) - deceased from the second viral strain.
We will use the following parameters and functions:
● The transmission rate of the first viral strain is denoted as β1, while the transmission rate of the second viral strain is denoted as β2.
● As a function of time since infection η, the recovery rate of individuals infected with the first viral strain is represented by r1(η). Similarly, as a function of time since infection η, the recovery rate of individuals infected with the second viral strain, is represented by r2(η).
● As a function of time since infection η, the mortality rate of the first viral strain is denoted as d1(η). Likewise, the mortality rate of the second viral strain is represented by d2(η).
● The number of newly infected individuals by the first viral strain and the second viral strain, denoted as J1(t) and J2(t), respectively, is determined by the relations J1(t)=(β1SI1)/N and J2(t)=(β2SI2)/N, respectively.
● The total number of individuals who have recovered from the first viral strain and the second viral strain at time t is represented by ∫t0r1(t−η)J1(η)dη and ∫t0r2(t−η)J2(η)dη, respectively.
● The total number of individuals who have died from the first viral strain and the second viral strain at time t is represented by ∫t0d1(t−η)J1(η)dη and ∫t0d2(t−η)J2(η)dη, respectively.
The two-strain model with distributed recovery and death rates has the following form:
The system is subject to the following initial condition:
where I1,0 and I2,0 are sufficiently small as compared to N. We suppose that the total population is constant :
2.2. Positiveness of solutions
We establish the positiveness of the solution to this problem on a time interval t∈[0,T), where T∈(0,+∞). We assume that the recovery and death rates satisfy the following inequalities:
for any η≥0 and t0>η. These assumptions dictate that the number of recoveries and deaths on a given time interval cannot exceed the whole population.
Lemma 1. If conditions (2.10) and (2.11) are satisfied, then any solution of systems (2.1)–(2.7) with the initial condition (2.8) satisfies the inequality 0≤X≤N, where
Proof. From Eq (2.1), we observe that if there exists a time t∗>0 such that S(t∗)=0, then dSdt|t=t∗=0. This implies that S(t)≥0 for t>0. By examining Eqs (2.4)–(2.7), we can deduce that R1(t), R2(t), D1(t), and D2(t) also remain positive for all values of t≥0. At t=0, we have J1(0)=β1S0I1,0/N>0 and J2(0)=β2S0I2,0/N>0. Let t0>0 be such that J1(t) and J2(t) remain non-negative for 0≤t<t0. Next, we have the following:
Integrating Eqs (2.4)–(2.7) with respect to t from 0 to t0, and taking into account the initial conditions given in (2.8), we obtain the following:
Changing the order of integration and taking the inequalities (2.10) and (2.11) into account, we discover the following:
It follows from inequalities (2.12) and (2.13) that I1(t0) and I2(t0) are non-negative. Consequently, J1(t0) and J2(t0) are also non-negative. This implies that I1(t), I2(t), J1(t), and J2(t) remain non-negative for all t≥0. Furthermore, we have the relation (2.9). Hence, any solution to the system lies within the range of 0 and N, there by ensuring the non-negativity of the solution.
2.3. Reduction to the ODE model
In this section, we show how models (2.1)–(2.7) can be reduced to the conventional ODE model. We consider the recovery and death rates in the following form:
The disease durations τ1 and τ2 and the parameters r1,0, r2,0, d1,0 and d2,0 are positive constants. By substituting these functions into Eqs (2.4)–(2.7), we obtain the following expressions:
By integrating Eq (2.16) from t−τ1 to t and Eq (2.17) from t−τ2 to t, we obtain the following:
Therefore,
We note that (R1(t)−R1(t−τ1)) and (D1(t)−D1(t−τ1)) correspond to the number of individuals who have recovered and died from the first viral strain during the time interval (t−τ1,t), respectively. Similarly, (R2(t)−R2(t−τ2)) and (D2(t)−D2(t−τ2)) represent the number of individuals who have recovered and died from the second viral strain during the time interval (t−τ2,t), respectively. From Eqs (2.18)–(2.21), we have the following:
Now, from (2.22)–(2.25),
Under the assumption that (r1,0+d1,0) and (r2,0+d2,0) are sufficiently small, we can disregard the terms involving (r1,0+d1,0)2 and (r2,0+d2,0)2. Consequently, we obtain the following:
In this case, the system represented by Eqs (2.1)–(2.7) is simplified to the following conventional ODE model:
Therefore, assuming that the recovery and death rates have uniform distributions as given in Eqs (2.14) and (2.15), and that they are sufficiently small, we can reduce models (2.1)–(2.7) to the ODE model. However, it is important to note that, in general, these assumptions may not hold, and we can consider different distributions for recovery and death rates.
3.
Delay model
3.1. Derivation of the delay model
Let us recall that the duration of the first disease is denoted by τ1, and the duration of the second disease by τ2. Additionally, suppose that individuals J1(t−τ1) and J2(t−τ2) infected at time t−τ1 and t−τ2, respectively, either recover or die at time t with certain probabilities. This assumption corresponds to the following choices for the functions r1(t−η), r2(t−η), d1(t−η), and d2(t−η):
where r1,0, r2,0, d1,0, d2,0 are constants, r1,0+d1,0=1 and r2,0+d2,0=1, and δ is the Dirac delta-function. Then,
Therefore, the systems (2.1)–(2.7) are reduced to the following delay model:
with J1(t)=J2(t)=0 for t<0.
3.2. Basic reproduction number
Let us consider Eq (3.2) for the infected compartments:
To determine the basic reproduction numbers R01 and R02. We set S(t)=S(t−τ1)=S(t−τ2)=S0 since the number of susceptible individuals is close to its initial condition in the beginning of the epidemic. Then, according to (3.5), we have
Substituting Ii(t)=I0ieλit, i=1,2, we have for i=1,2
Let
It is evident that Eq (3.6) have solutions (i.e., λ1=λ2=0) and a non-zero solution, the sign of which is determined by G′i(0). Denote
Let R01>1 and R02>1. This means that G′1(0)>1 and G′2(0)>1. We see that G1(λ1) and G2(λ2) are increasing functions of λ1 and λ2, respectively, with G1(λ1)→β1S0N as λ1→∞ and G2(λ2)→β2S0N as λ2→∞. This implies that Eq (3.6) has positive solutions, (i.e., there exist λ∗1>0 and λ∗2>0 such that Gi(λ∗i)=λ∗i, i=1,2).
If G′i(0)<1, then
for all λ1≥0 and λ2≥0. Hence, there is no positive solution to the equation Gi(λi)=λi, i=1,2. Consequently, the basic reproduction numbers can be expressed as follows:
3.3. Final size of the epidemic
Next, we aim to estimate the final size of the susceptible compartment S∞=limt→∞S(t). Integrating (3.2), we obtain the following:
From (3.1), we obtain the following:
Then, integrating from 0 to ∞, we obtain the following:
Changing the order of integration, we obtain the following:
Now, integrating (3.1) from 0 to ∞, we obtain the following:
Since J1(t)=0 for all t∈[−τ1,0] and J2(t)=0 for all t∈[−τ2,0], then
Thus, we obtain an upper bound for the final size:
In the same way, we obtain a lower bound for the final size:
Hence, we obtain a two-sided estimate for S∞:
Let us recall that in the case of a single strain, there is an equation for S∞ instead of the inequalities.
4.
Numerical simulation
For the delay models (3.1)–(3.4), we compare the maximum of infected by each virus. We chose the following values for the parameters: N=104, I1,0=I2,0=1, β2=0.2, r1,0=0.7, r2,0=0.6, d1,0=0.3, d2,0=0.4, τ1=15.7 and τ2=17.7.
Figure 1 shows the number of infected individuals in time for each strain. In the first case, when R01>R02, the maximum of infected individuals is higher for the first strain. In the other case, when R01<R02, we obtain the same result. Therefore, the domination of the strains is not uniquely determined by the basic reproduction numbers but rather by the individual parameters.
Next, we choose the following values for the parameters: N=104, I1,0=I2,0=1, r1,0=0.7, r2,0=0.6, d1,0=0.3, d2,0=0.4, τ1=15.7 and τ2=17.7, and vary the values of β1 and β2 in the interval [0.1,0.5]. Figures 2–4 display the dependence of the maximal number of infected I1m and I2m, the time to the maximal number of infected for the first and the second virus and the total number of infected of the two virus of the models (3.1)–(3.4) on β1, β2.
Figure 2(a) shows when the transmission rate, β2, is fixed and the evolution of the epidemic peak is examined in relation to variations in β1. As β1 increases, the epidemic peak corresponding to the first virus also increases; for the second virus, the epidemic peak gradually decreases, and the number of individuals infected by the second virus decreases.
In other words, when comparing the impact of the first and second virus by modifying the transmission rate of the first virus, while keeping the transmission rate of the second epidemic constant, we observe that the first virus becomes more prevalent and reaches a higher epidemic peak as the transmission rate increases. On the other hand, the second virus is gradually eliminated, and its epidemic peak decreases as the transmission rate of the first virus increases.
It is interesting to note that in Figure 2(b), when β1 is fixed and β2 varies, we observe the opposite phenomenon. As β2 increases, the epidemic peak corresponding to the second virus also increases; while for the first virus, the epidemic peak gradually decreases. The last two graphs (c) and (d) present the variation of the epidemic peak for both viruses in relation to β1 and β2. These observations underscore the importance of the transmission rate in the spread of epidemics and how different values of β1 and β2 can influence the evolution of different epidemics.
The relationship between the timing of the epidemic peak and β1 and β2 can be complex. For β1>β2, if the two viruses infect the same number of individuals, then the first strain reaches the maximum faster than the other. Additionally, if the difference between β1 and β2 is large, then we can expect that the difference between t1m and t2m is also large, though this is not the case here. If β1>β2, the first strain infects more individuals to reach the maximum though it is faster, and the second strain infects less individuals to reach the maximum, though it is slower. Therefore, if β1 is very large compared to β2, this does not imply that t1m will be very large compared to t2m. As a result, the difference between the transmission rates does not strongly influence the peak time. Thus, t1m is either equal or very close to t2m (see Figure 3).
In terms of the dependence on β1 and β2 for the number of individuals affected by the first and second viruses, we can observe a similar phenomenon as seen in the epidemic peak (see Figure 4). As β1 increases, the number of individuals affected by the first virus tends to increase. This indicates that a higher transmission rate for the first virus leads to a larger population being infected by it compared to a larger population affected by the first virus. On the other hand, as β1 increases, the number of individuals affected by the second virus gradually decreases. This suggests that the second virus experiences a decline in its transmission and a lower number of individuals become infected by it.
Similarly, when β2 is varied while keeping β1 constant, higher values of β2 can lead to an increase in the number of individuals affected by the second virus; alternatively, the number of individuals affected by the first virus may decrease.
Finally, we estimate the inequality terms of (3.7). Let
In Figure 5, we can see that the graph of Sm is very close to the graph of Su. This result suggests the following conjecture:
5.
Model without cross-immunity
In this section, we study a similar model assuming that individuals who have recovered from the first viral strain can be infected by the second viral strain, and individuals who have recovered from the second viral strain can be infected by the first viral strain.
5.1. Model formulation
Let J12(t)=(ϵ1β2I2R1)/N represent the number of individuals who have previously recovered from the first viral strain and are newly infected with the second viral strain. Similarly, J21(t)=(ϵ2β1I1R2)/N represents the number of individuals who have previously recovered from the second viral strain and are newly infected with the first viral strain, where ϵ1 and ϵ2 are constants that indicate the level of cross-immunity. For ϵ1=ϵ2=0, there is complete cross-immunity. For ϵ1= ϵ2=1, there is the absence of cross-immunity. In this modified system, we introduce additional variables to account for individuals who have recovered from one strain and are subsequently infected with the other strain. Let us define the following variables:
● I12(t) - infected with the first viral strain initially and later infected with the second viral strain.
● I21(t) - infected with the second viral strain initially and later infected with the first viral strain.
● R12(t) - recovered from the first viral strain initially and later infected with the second viral strain, becoming immune to both strains.
● R21(t) - recovered from the second viral strain initially and later infected with the first viral strain, becoming immune to both strains.
● D12(t) - recovered from the first viral strain initially and later die due to the second viral strain.
● D21(t) - recovered from the second viral strain initially and later die due to the first viral strain.
The individuals that are recovered and infected at time t−η with the first viral strain and the second viral strain are represented by J21(t−η) and J12(t−η), respectively. With these additional variables, the system can be expressed as follows, using the same notations as in the second section :
The system is subject to the following initial condition:
where I1,0 and I2,0 are sufficiently small as compared to N. We assume that the total population is constant :
5.2. Positiveness of solutions
We prove the positivity of the solution to this problem on a time interval [0,T) where T∈(0,+∞). We make the assumption that the recovery and death rates satisfy the inequalities (2.10) and (2.11).
Lemma 2. If conditions (2.10) and (2.11) are satisfied, then any solution of systems (5.1)–(5.13) with the initial condition (5.14) satisfies the inequality 0≤X≤N, where
Proof. From Eq (5.1), we can observe that if there exists a t∗>0 such that S(t∗)=0, then dSdt|t=t∗=0. This implies that S(t)≥0 for t>0. Furthermore, based on Eqs (5.4), (5.5), and (5.8)–(5.13), we can conclude that R1(t), R2(t), R12(t), R21(t), D1(t), D2(t), D12(t), and D21(t) also remain positive for all values of t. At t=0, we have J1(0)=β1S0I1,0/N>0, J2(0)=β2S0I2,0/N>0 and J12(0)=J21(0)=0. Suppose t0>0 be such that J1(t), J2(t), J12(t), J21(t) remain non-negative for 0≤t<t0. Next, we have the following:
By integrating (5.4), (5.5), (5.10) and (5.11) with respect to t from 0 to t0, and using the initial conditions given in (5.14), obtain the following:
Changing the order of integration and using the inequalities (2.10) and (2.11), we observe the following:
It follows from the inequalities (5.16) and (5.17) that I1(t0) and I2(t0) are both non-negative. Consequently, J1(t0), J2(t0), J12(t0) and J21(t0) are also non-negative. Thus, we have shown that I1(t), I2(t), J1(t), J2(t), J12(t) and J21(t) remain non-negative for all t≥0. On the other hand, we have the following:
By integrating (5.8), (5.9), (5.12) and (5.13) with respect to t from 0 to t0 and using the initial conditions (5.14), we obtain the following:
Changing the order of integration and using inequalities (2.10) and (2.11), we observe the following:
It follows from the inequalities (5.18) and (5.19) that I12(t0) and I21(t0) are both non-negative. Consequently, I12(t) and I21(t) remain non-negative for all t≥0. Furthermore, we have (5.15). Thus, any solution of system (5.1)–(5.13) lies between 0 and N, thereby ensuring the non-negativity of the solution. ◻
5.3. Reduction to the ODE model
In this section, we demonstrate that models (5.1)–(5.13) can be reduced to a conventional ODE model under certain assumptions. Let us assume that the recovery and death rates are given by the following functions :
The disease durations τ1,τ2>0 and the parameters r1,0, r2,0, d1,0 and d2,0 are positive constants. By substituting these functions in (5.4), (5.5) and (5.8)–(5.13), we obtain the following:
By integrating Eqs (5.22) and (5.25) from t−τ1 to t, and Eqs (5.23) and (5.24) from t−τ2 to t, we obtain the following:
Thus,
where (R1(t)−R1(t−τ1)) and (D1(t)−D1(t−τ1)) represent the number of individuals who have recovered and died from the first viral strain during the time interval (t−τ1,t), respectively. Similarly, (R2(t)−R2(t−τ2)) and (D2(t)−D2(t−τ2)) represent the number of individuals who have recovered and died from the second viral strain during the time interval (t−τ2,t), respectively. Moreover, the expressions (R21(t)−R21(t−τ1)), (R12(t)−R12(t−τ2)), (D21(t)−D21(t−τ1)), and (D12(t)−D12(t−τ2)) characterize the difference in the number of recovered and died individuals for two viral strains at different time intervals. Hence, from (5.26)–(5.33), we have the following:
Now, from (5.38)–(5.41),
Assuming that (r1,0+d1,0) and (r2,0+d2,0) are small enough, we neglect the terms involving (r1,0+d1,0)2 and (r2,0+d2,0)2. Hence, we obtain the following:
In this case, systems (5.1)–(5.13) is reduced to the following conventional ODE model:
Therefore, if we assume that the recovery and death rates described in Eqs (5.20) and (5.21) follow uniform distributions and are sufficiently small, we can reduce the model given by Eqs (5.1)–(5.13) to the ODE model. However, in general, these assumptions may not hold. Another approximation of recovery and death rate distributions is considered in the next section.
6.
Delay model
Let us recall that the duration of the first and the second disease are denoted by τ1 and τ2, respectively. Furthermore, suppose that individuals J1(t−τ1) and J21(t−τ1) infected at time t−τ1 and individuals J2(t−τ2) and J12(t−τ2) infected at time t−τ2, either recover or die at time t with certain probabilities. This assumption corresponds to the following choice of the functions r1(t−η), r2(t−η), d1(t−η) and d2(t−η):
where r1,0, r2,0, d1,0, d2,0 are constants, r1,0+d1,0=1 and r2,0+d2,0=1, and δ is the Dirac delta-function. Then
Therefore, systems (5.1)–(5.13) is reduced to the following delay model:
with J_1(t) = J_2(t) = J_{12}(t) = J_{21}(t) = 0 for t < 0 .
Using the arguments similar to those in Subsections 3.2 and 3.3, it can be demonstrated that the basic reproduction numbers can be expressed as follows:
Additionally, we obtain a two-sided estimate for S_\infty :
Using the Figure 5, we obtain the following:
7.
Numerical simulation
For the delay models (6.1)–(6.7), we compare the maximum number of infected individuals and the timing of this peak, as well as the total number of infected individuals caused by each virus. We choose the following values for the parameters: population size N = 10^4 , initial infections I_{1, 0} = I_{2, 0} = 1 , delays \tau_1 = 15.7 and \tau_2 = 17.7 , and transmission rates \beta_1 = 0.25 , \beta_2 = 0.2 and the constants r_{1, 0} = 0.7 , r_{2, 0} = 0.6 , d_{1, 0} = 0.3 , d_{2, 0} = 0.4 . Additionally, we set \epsilon_1 = 0.8 and \epsilon_2 = 1 .
In the first infection, where \beta_1 > \beta_2 , Figure 6 shows that the maximal number of infected individuals during the first strain is higher than the maximal number of infected individuals observed during the second strain. In the second infection, it is worth noting that the maximum value of I_{21} is lower than the maximum value of I_{12} where, in this case, the maximum depends on the parameters \beta_1 , \beta_2 , \epsilon_1 , \epsilon_2 , r_{1, 0} and r_{2, 0} .
The maximum number of infected individuals behaves similarly to a single strain scenario, where the maximum is determined by the strain with the larger transmission rate (i.e, (I_1+I_{21})_m > (I_2+I_{12})_m ). Furthermore, with regards to the timing of the maximum, the difference between the transmission rates does not strongly influence on the peak time. Thus, t_{1m} is very close to t_{2m} .
Next, let us consider another set of parameters - N = 10^4 , I_{1, 0} = I_{2, 0} = 1 , r_{1, 0} = 0.7 , r_{2, 0} = 0.6 , d_{1, 0} = 0.3 , d_{2, 0} = 0.4 , \tau_1 = 15.7 , \tau_2 = 17.7 - and vary the values of \beta_1 and \beta_2 within the range of [0.1, 0.5] . During the first infection with a fixed transmission rate \beta_2 ( \beta_2 < \beta_1 ), increasing the transmission rate \beta_1 causes the total number of individuals infected by the first strain ( R_{1f}+D_{1f} ) to approach the entire population N , while the total number of individuals infected by the second strain ( R_{2f}+D_{2f} ) diminishes significantly, nearly reaching zero. Conversely, with a fixed transmission rate \beta_1 ( \beta_1 < \beta_2 ), by increasing the transmission rate \beta_2 , the total number of individuals infected by the second strain ( R_{2f}+D_{2f} ) approaches the entire population N , while the total number of individuals infected by the first strain ( R_{1f}+D_{1f} ) decreases significantly, nearly reaching zero. Notably, 70% of those infected by the first strain and 60% of those infected by the second strain have recovered.
In the second infection, by increasing the transmission rate \beta_1 ( \beta_2 < \beta_1 ), the total number of individuals infected by the second strain ( R_{12f}+D_{12f} ) approaches 70% of the total population N , while the total number of individuals infected by the first strain ( R_{21f}+D_{21f} ) approaches a very small value close to zero. On the other hand, increasing the transmission rate \beta_2 ( \beta_1 < \beta_2 ) causes the total number of individuals infected by the first strain ( R_{21f}+D_{21f} ) to approach 60% of the total population N , while the total number of individuals infected by the second strain ( R_{12f}+D_{12f} ) approaches a very small value close to zero.
Consequently, if \beta_1 is increased, then the number of individuals affected by the first virus ( R_{1f}+D_{1f}+R_{21f}+D_{21f} ) also increases. This indicates that a higher transmission rate for the first virus leads to a larger proportion of the population being infected by it.
Conversely, with an increase in \beta_1 , the number of individuals affected by the second virus ( R_{2f}+D_{2f}+R_{12f}+D_{12f} ) gradually decreases. This suggests that the transmission of the second virus diminishes, thereby resulting in a lower number of individuals becoming infected by it.
Similarly, when \beta_2 is changed while keeping \beta_1 constant, increasing \beta_2 can lead to a higher number of individuals being affected by the second virus, while the number of individuals affected by the first virus may decrease. Note that the total number of infected individuals exceeds the total population because there are individuals who have been infected by both strain.
8.
Discussion
In this paper we introduced two epidemiological models, each of which described the dynamics of the dual viral strain SIRD model with distributed recovery and death rates to track the impact of multiple strains variants during an epidemic. In the first model, some individuals may be infected by the first strain and others by the second strain. Furthermore, individuals who have recovered from either strain develop immunity to both strains. In the second model, we explored the scenario where individuals who have recovered from the first strain can be infected by the second strain, and similarly, individuals who have recovered from the second strain can be infected by the first strain.
The proposed distributed delay models, represented by integro-differential equations, offer a more accurate description of epidemic dynamics. However, these models are relatively complex and require knowledge of distributed recovery and death rates, which may not be readily available in the literature. To compensate this disadvantage of the distributed models, we derived two simplified models from each model to address different limiting cases. In the first case, assuming that the recovery and death rates are uniformly distributed, we obtained a conventional compartmental ODE model. In the second case, considering the recovery and death rate distributions as delta-function, we obtained a novel delay model that has not been previously explored in the epidemiological literature. As mentioned in [43,44,45], since distributed recovery and death rates are commonly described by a Gamma-distribution, approximating them with a delta-function can provide a more accurate representation, especially in capturing the dynamics during the initial phase of infection. The point-wise delay models, based on the duration of the disease and known recovery and death rates, provide a simple and biologically meaningful representation of epidemics.
For these delay model we determined the reproduction numbers for each strain \mathcal{R}_{0j}, \ \ j = 1, 2 . We employed these delay models to perform a numerical comparison of the maximum number of infected individuals, the peak timing and the total number of infected cases by each virus. This analysis was conducted by utilizing the final size of the recovered and deceased individuals. The transmission rates of the diseases played a crucial role in determining these outcomes, as they significantly influenced the dynamics of the epidemics being studied.
We compared the two models with and without cross-immunity. The maximum number of infected individuals in the model without cross-immunity was higher than in the other model because there were individuals who had been infected with both viruses. The timing of the maximum was either equal or very close between the two models. In the model without cross-immunity, the total number of infected individuals surpassed the total population because some individuals could be infected by both strains simultaneously. As a consequence, the number of infected individuals would be higher compared to the total number of infected individuals in the other model (with cross-immunity). As result, cross-immunity between the two viruses can significantly reduce their global spread. Individuals already immunized against one of the viruses would decrease the total number of cases of diseases caused by these pathogens. If a large part of the population acquires this cross-immunity, it would limit the spread of viruses and minimize their impact on public health. In the absence of cross-immunity, the spread of both viruses would accelerate, potentially leading to serious co-infections and increasing the burden on healthcare systems. Therefore, it is crucial to understand and promote cross-immunity to better prevent and control these viral diseases.
Comparing our results with the data, we used the example of Omicron and Delta variants in COVID-19, where Omicron exhibited a higher transmission rate. In [46], the authors showed that the duration of encounters played a crucial role in modeling and significantly impacted disease progression and the competition between variants, where the faster spreading strain dominated over the slower strain. Reference [12] reports that Omicron rapidly spread across France and displayed higher fitness compared to Delta. Additionally, reference [13] estimated that the total number of individuals infected by Omicron exceeds the total number of those infected by Delta. All of these works confirm our result that the rate of transmission is crucial in which strain dominates the other. In general, the strain with a higher transmission rate (Omicron) tends to have a higher maximum number of infected individuals and a higher total number of infected individuals compared to the other strain (Delta).
Use of AI tools declaration
The authors declare they have not used Artificial Intelligence (AI) tools in the creation of this article.
Conflict of interest
The authors declare there is no conflict of interest.
Acknowledgements
The authors express their gratitude to the referees for careful reading and valuable comments which led to an important improvement of the original version of this work. This work has been supported by PHC (Partenariat Hubert Curien) FRANCE-MAGHREB project having the code number 22MAG22–47518WK. V.V was supported by the Ministry of Science and Higher Education of the Russian Federation (megagrant agreement No. 075-15-2022-1115).