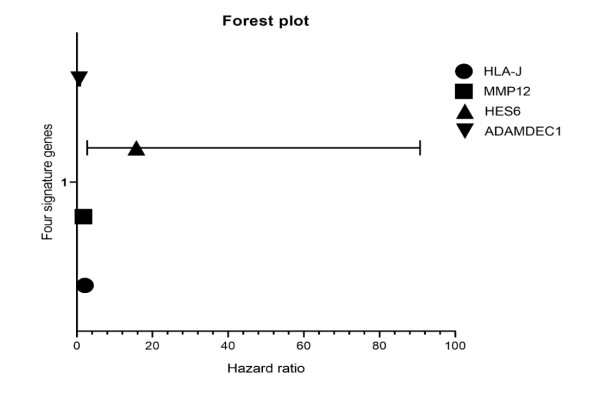
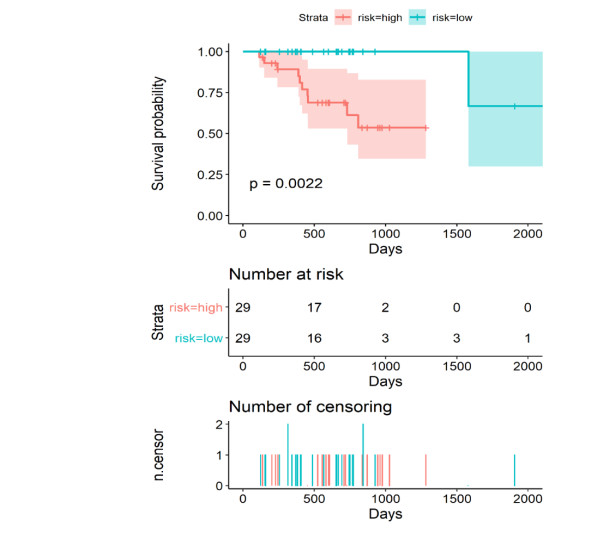
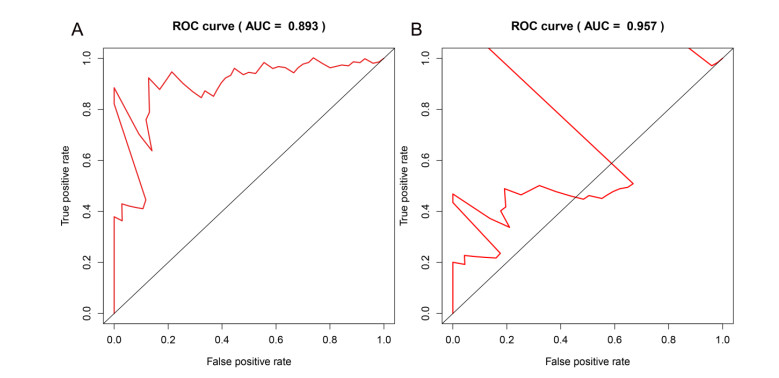
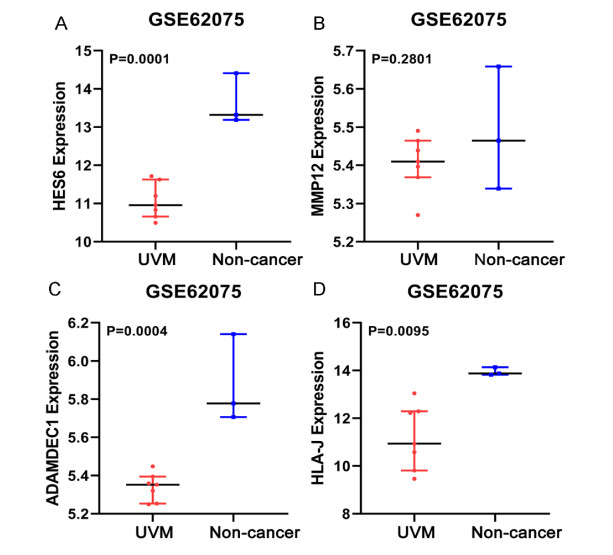
The detailed molecular function of tumor microenvironment (TEM) in uveal melanoma (UVM) remains unclear. This study generated the immune index and the stromal index scores by ESTIMATE algorithm based on RNA-sequencing data with 80 UVM patients. There was no correlation between the immune stromal index and clinical parameters. The differentially expressed genes related to the immune stromal index were calculated and were described by functional annotations and protein-protein interaction network diagrams. After univariate and multivariate Cox regression analyses, there were four genes (HLA-J, MMP12, HES6, and ADAMDEC1) with significant prognostic significance. The prognostic model was constructed using these four characteristic genes, and the KM curve and tROC curve were described to show that the model had a better ability to predict survival outcomes and prognosis. The verification results in GSE62075 showed that HLA-J and HES6 were expressed differently in the cancer group than in the non-cancer group. This study indicates that the risk signature based on the immune index can be used as an indicator to evaluate the prognosis of patients with UVM.
Citation: Li-Sha Pan, Zacharia Ackbarkha, Jing Zeng, Min-Li Huang, Zhen Yang, Hao Liang. Immune marker signature helps to predict survival in uveal melanoma[J]. Mathematical Biosciences and Engineering, 2021, 18(4): 4055-4070. doi: 10.3934/mbe.2021203
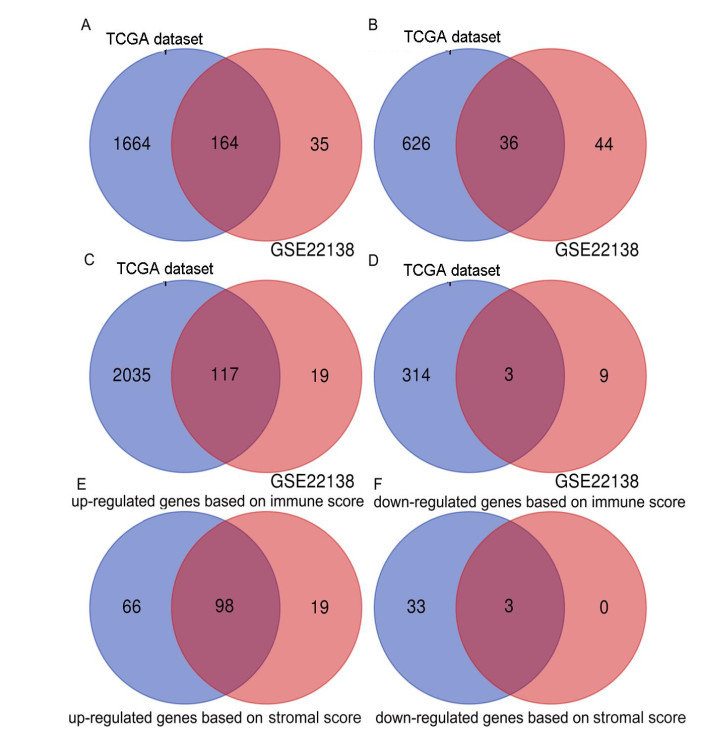
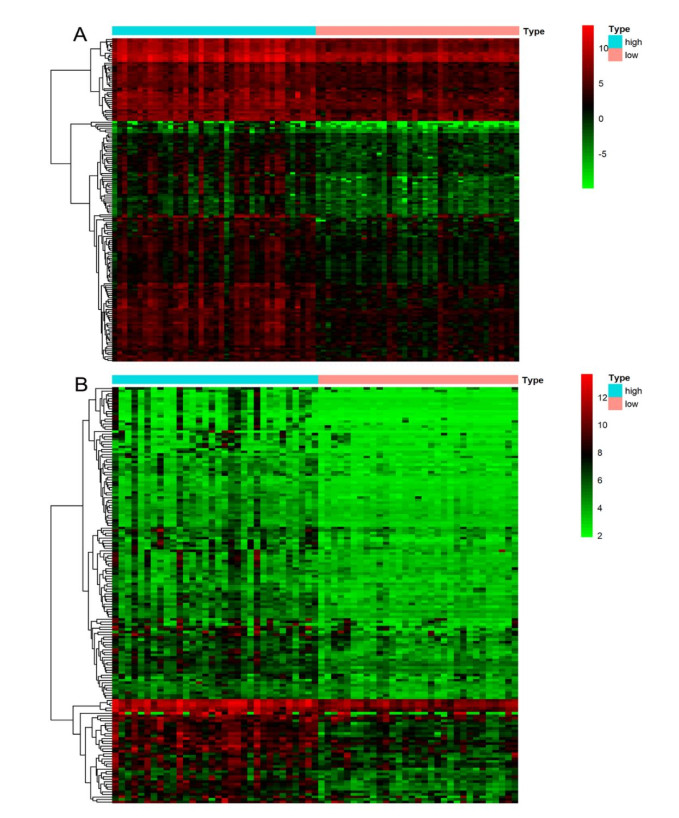
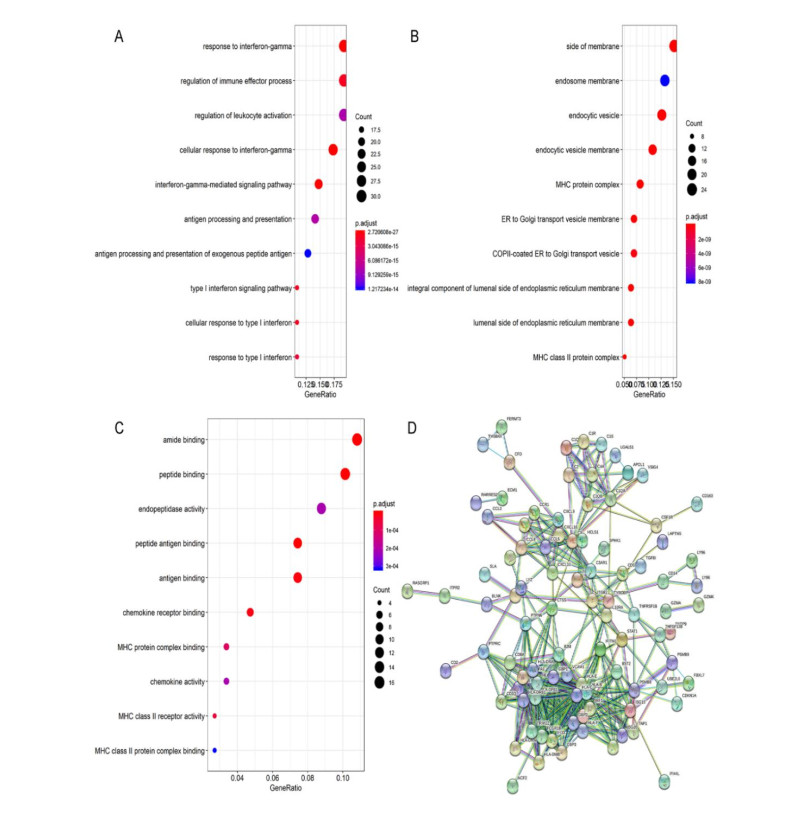
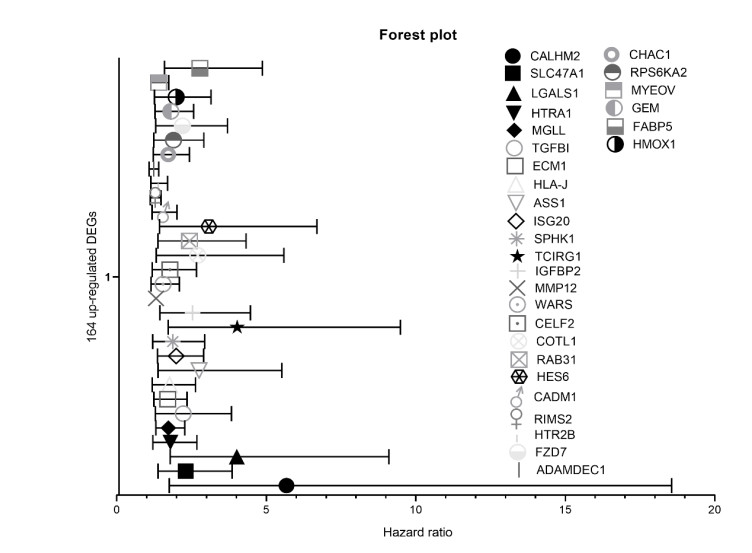
The detailed molecular function of tumor microenvironment (TEM) in uveal melanoma (UVM) remains unclear. This study generated the immune index and the stromal index scores by ESTIMATE algorithm based on RNA-sequencing data with 80 UVM patients. There was no correlation between the immune stromal index and clinical parameters. The differentially expressed genes related to the immune stromal index were calculated and were described by functional annotations and protein-protein interaction network diagrams. After univariate and multivariate Cox regression analyses, there were four genes (HLA-J, MMP12, HES6, and ADAMDEC1) with significant prognostic significance. The prognostic model was constructed using these four characteristic genes, and the KM curve and tROC curve were described to show that the model had a better ability to predict survival outcomes and prognosis. The verification results in GSE62075 showed that HLA-J and HES6 were expressed differently in the cancer group than in the non-cancer group. This study indicates that the risk signature based on the immune index can be used as an indicator to evaluate the prognosis of patients with UVM.

| [1] |
S. Kaštelan, A. G. Antunica, L. B. Oresković, G. Pelčić, E. Kasun, K. Hat, Immunotherapy for uveal melanoma-current knowledge and perspectives, Curr. Med. Chem., 27 (2020), 1350-1366. doi: 10.2174/0929867326666190704141444

|
| [2] |
A. L. Chew, K. Spilsbury, T. W. Isaacs, Survival from uveal melanoma in Western Australia 1981-2005, Clin. Experiment. Ophthalmol., 43 (2015), 422-428. doi: 10.1111/ceo.12490
|
| [3] | M. V. Fry, J. J. Augsburger, Z. M. Corrêa, Clinical features, metastasis, and survival in patients younger than 21 years with posterior uveal melanoma, JAMA Ophthalmol., 137 (2019), 75-81. |
| [4] |
D. Lorenzo, J. M. Piulats, M. Ochoa, L. Arias, C. Gutiérrez, J. Català, et al., Clinical predictors of survival in metastatic uveal melanoma, Jpn. J. Ophthalmol., 63 (2019), 197-209. doi: 10.1007/s10384-019-00656-9
|
| [5] |
T. E. Schank, J. C. Hassel, Immunotherapies for the treatment of uveal Melanoma-History and future, Cancers, 11 (2019), 1048. doi: 10.3390/cancers11081048
|
| [6] | B. Álvarez-Rodríguez, A. Latorre, C. Posch, Á. Somoza, Recent advances in uveal melanoma treatment, Med. Res. Rev., 37 (2017), 1350-1372. |
| [7] |
I. Cantón, P. C. Eves, M. Szabo, F. Vidal-Vanaclocha, K. Sisley, I. G. Rennie, et al., Tumor necrosis factor alpha increases and alpha-melanocyte-stimulating hormone reduces uveal melanoma invasion through fibronectin, J. Invest. Dermatol., 121 (2003), 557-563. doi: 10.1046/j.1523-1747.2003.12417.x
|
| [8] |
K. Lai, R. M. Conway, R. Crouch, M. J. Jager, M. C. Madigan, Expression and distribution of MMPs and TIMPs in human uveal melanoma, Exp. Eye Res., 86 (2008), 936-941. doi: 10.1016/j.exer.2008.03.010
|
| [9] |
L. V. Ly, A. Baghat, M. Versluis, E. S. Jordanova, G. P. Luyten, N. van Rooijen, et al., In aged mice, outgrowth of intraocular melanoma depends on proangiogenic M2-type macrophages, J. Immunol., 185 (2010), 3481-3488. doi: 10.4049/jimmunol.0903479
|
| [10] |
J. Shang, Q. Song, Z. Yang, X. Sun, M. Xue, W. Chen, et al., Analysis of PD-1 related immune transcriptional profile in different cancer types, Cancer Cell Int., 18 (2018), 218. doi: 10.1186/s12935-018-0712-y
|
| [11] |
Y. Krishna, C. McCarthy, H. Kalirai, S. E. Coupland, Inflammatory cell infiltrates in advanced metastatic uveal melanoma, Hum. Pathol., 66 (2017), 159-166. doi: 10.1016/j.humpath.2017.06.005
|
| [12] |
N. Babchia, S. Landreville, B. Clément, C. Coulouarn, F. Mouriaux, The bidirectional crosstalk between metastatic uveal melanoma cells and hepatic stellate cells engenders an inflammatory microenvironment, Exp. Eye Res., 181 (2019), 213-222. doi: 10.1016/j.exer.2019.02.012
|
| [13] |
M. J. de Lange, R. J. Nell, R. N. Lalai, M. Versluis, E. S. Jordanova, G. Luyten, et al., Digital PCR-based T-cell quantification-assisted deconvolution of the microenvironment reveals that activated macrophages drive tumor inflammation in uveal melanoma, Mol. Cancer Res., 16 (2018), 1902-1911. doi: 10.1158/1541-7786.MCR-18-0114
|
| [14] |
K. Yoshihara, M. Shahmoradgoli, E. Martínez, R. Vegesna, H. Kim, W. Torres-Garcia, et al., Inferring tumour purity and stromal and immune cell admixture from expression data, Nat. Commun., 4 (2013), 2612. doi: 10.1038/ncomms3612
|
| [15] | C. H. Chen, Y. S. Lu, A. L. Cheng, C. S. Huang, W. H. Kuo, M. Y. Wang, et al., Disparity in tumor immune microenvironment of breast cancer and prognostic impact: Asian versus Western populations, Oncologist, 25(2020), e16-e23. |
| [16] | W. Liu, H. Ye, Y. F. Liu, C. Q. Xu, Y. X. Zhong, T. Tian, et al., Transcriptome-derived stromal and immune scores infer clinical outcomes of patients with cancer, Oncol. Lett., 15 (2018), 4351-4357. |
| [17] | W. H. Xu, Y. Xu, J. Wang, F. N. Wan, H. K. Wang, D. L. Cao, et al., Prognostic value and immune infiltration of novel signatures in clear cell renal cell carcinoma microenvironment, Aging (Albany NY), 11 (2019), 6999-7020. |
| [18] | C. W. Law, Y. Chen, W. Shi, G. K. Smyth, voom: Precision weights unlock linear model analysis tools for RNA-seq read counts, Genome Biol., 15 (2014), R29. |
| [19] |
P. Lin, R. Q. He, F. C. Ma, L. Liang, Y. He, H. Yang, et al., Systematic analysis of survival-associated alternative splicing signatures in gastrointestinal pan-adenocarcinomas, EBioMedicine, 34 (2018), 46-60. doi: 10.1016/j.ebiom.2018.07.040
|
| [20] |
Z. C. Xie, H. Y. Wu, Y. W. Dang, G. Chen, Role of alternative splicing signatures in the prognosis of glioblastoma, Cancer Med., 8 (2019), 7623-7636. doi: 10.1002/cam4.2666
|
| [21] |
K. Hallermalm, K. Seki, A. De Geer, B. Motyka, R. C. Bleackley, M. J. Jager, et al., Modulation of the tumor cell phenotype by IFN-gamma results in resistance of uveal melanoma cells to granule-mediated lysis by cytotoxic lymphocytes, J. Immunol., 180 (2008), 3766-3774. doi: 10.4049/jimmunol.180.6.3766
|
| [22] |
J. A. Gollob, C. J. Sciambi, Decitabine up-regulates S100A2 expression and synergizes with IFN-gamma to kill uveal melanoma cells, Clin. Cancer Res., 13 (2007), 5219-5225. doi: 10.1158/1078-0432.CCR-07-0816
|
| [23] |
P. Rishi, V. V. Koundanya, C. L. Shields, Using risk factors for detection and prognostication of uveal melanoma, Indian J. Ophthalmol., 63 (2015), 110-116. doi: 10.4103/0301-4738.154373
|
| [24] |
X. Xin, Y. Zhang, F. Ling, L. Wang, X. Sheng, L. Qin, et al., Identification of a nine-miRNA signature for the prognosis of Uveal Melanoma, Exp. Eye Res., 180 (2019), 242-249. doi: 10.1016/j.exer.2019.01.004
|
| [25] | Q. Wan, X. Sang, L. Jin, Z. Wang, Alternative Splicing Events as Indicators for the Prognosis of Uveal Melanoma, Genes, 11 (2020). |
| [26] |
M. D. Onken, L. A. Worley, D. H. Char, J. J. Augsburger, Z. M. Correa, E. Nudleman, et al., Collaborative Ocular Oncology Group report number 1: prospective validation of a multi-gene prognostic assay in uveal melanoma, Ophthalmology, 119 (2012), 1596-1603. doi: 10.1016/j.ophtha.2012.02.017
|
| [27] |
V. M. Jacobsen, S. Li, A. Wang, D. Zhu, M. Liu, M. Thomassen, et al., Epigenetic association analysis of clinical sub-phenotypes in patients with polycystic ovary syndrome (PCOS), Gynecol. Endocrinol., 35 (2019), 691-694. doi: 10.1080/09513590.2019.1576617
|
| [28] |
P. Kotnik, E. Knapič, J. Kokošar, J. Kovač, R. Jerala, T. Battelino, et al., Identification of novel alleles associated with insulin resistance in childhood obesity using pooled-DNA genome-wide association study approach, Int. J. Obes., 42 (2018), 686-695. doi: 10.1038/ijo.2017.293
|
| [29] |
N. Dandachi, N. J. Kelly, J. P. Wood, C. L. Burton, J. E. Radder, A. S. Leme, et al., Macrophage elastase induces TRAIL-mediated tumor cell death through its carboxy-terminal domain, Am. J. Respir. Crit. Care Med., 196 (2017), 353-363. doi: 10.1164/rccm.201606-1150OC
|
| [30] |
H. Gao, X. Zhou, H. Li, F. Liu, H. Zhu, X. Song, et al., Role of matrix metallopeptidase 12 in the development of hepatocellular carcinoma, J. Invest. Surg., 34(2021), 366-372. doi: 10.1080/08941939.2019.1637975
|
| [31] |
F. Han, S. Zhang, L. Zhang, Q. Hao, The overexpression and predictive significance of MMP-12 in esophageal squamous cell carcinoma, Pathol. Res. Pract., 213 (2017), 1519-1522. doi: 10.1016/j.prp.2017.09.023
|
| [32] |
F. Klupp, L. Neumann, C. Kahlert, J. Diers, N. Halama, C. Franz, et al., Serum MMP7, MMP10 and MMP12 level as negative prognostic markers in colon cancer patients, BMC Cancer, 16 (2016), 494. doi: 10.1186/s12885-016-2515-7
|
| [33] |
F. Z. Lv, J. L. Wang, Y. Wu, H. F. Chen, X. Y. Shen, Knockdown of MMP12 inhibits the growth and invasion of lung adenocarcinoma cells, Int. J. Immunopathol. Pharmacol., 28 (2015), 77-84. doi: 10.1177/0394632015572557
|
| [34] |
F. L. Carvalho, L. Marchionni, A. Gupta, B. A. Kummangal, E. M. Schaeffer, A. E. Ross, et al., HES6 promotes prostate cancer aggressiveness independently of Notch signalling, J. Cell. Mol. Med., 19 (2015), 1624-1636. doi: 10.1111/jcmm.12537
|
| [35] | Y. Xu, X. Liu, H. Zhang, Z. Zhu, X. Wu, X. Wu, et al., Overexpression of HES6 has prognostic value and promotes metastasis via the Wnt/β-catenin signaling pathway in colorectal cancer, Oncol. Rep., 40 (2018), 1261-1274. |
| [36] |
Y. C. Xu, C. J. Liang, D. X. Zhang, G. Q. Li, X. Gao, J. Z. Fu, et al., LncSHRG promotes hepatocellular carcinoma progression by activating HES6, Oncotarget, 8 (2017), 70630-70641. doi: 10.18632/oncotarget.19906
|
 Supplementary File 1.xlsx Supplementary File 1.xlsx |
 |
| Supplementary File 2.xlsx |
|
| Supplementary File 3.pzfx |
|
| Supplementary Table 1.xlsx |
|
| Supplementary Table 2.xlsx |
|
Figures(8) / Tables(3)

Li-Sha Pan, Zacharia Ackbarkha, Jing Zeng, Min-Li Huang, Zhen Yang, Hao Liang. Immune marker signature helps to predict survival in uveal melanoma[J]. Mathematical Biosciences and Engineering, 2021, 18(4): 4055-4070. doi: 10.3934/mbe.2021203


 DownLoad: