Three-dimensional (3D) sparse reconstruction of landslide topography based on unmanned aerial vehicle (UAV) images has been widely used for landslide monitoring and geomorphological analysis. In order to solve the isolated island phenomenon caused by multi-scale image matching, which means that there is no connection between the images of different scales, we herein propose a method that selects UAV image pairs based on image retrieval. In this method, sparse reconstruction was obtained via the sequential structure-from-motion (SfM) pipeline. First, principal component analysis (PCA) was used to reduce high-dimensional features to low-dimensional features to improve the efficiency of retrieval vocabulary construction. Second, by calculating the query depth threshold and discarding the invalid image pairs, we improved the efficiency of image matching. Third, the connected network of the dataset was constructed based on the initial matching of image pairs. The lost multi-scale image pairs were identified and matched through the image query between the connection components, which further improved the integrity of image matching. Our experimental results show that, compared with the traditional image retrieval method, the efficiency of the proposed method is improved by 25.9%.
Citation: Chaofeng Ren, Xiaodong Zhi, Yuchi Pu, Fuqiang Zhang. A multi-scale UAV image matching method applied to large-scale landslide reconstruction[J]. Mathematical Biosciences and Engineering, 2021, 18(3): 2274-2287. doi: 10.3934/mbe.2021115
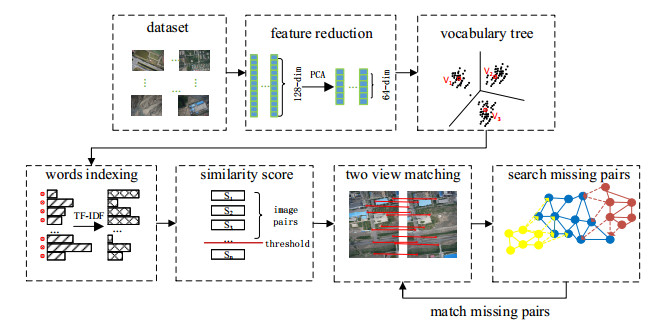
Three-dimensional (3D) sparse reconstruction of landslide topography based on unmanned aerial vehicle (UAV) images has been widely used for landslide monitoring and geomorphological analysis. In order to solve the isolated island phenomenon caused by multi-scale image matching, which means that there is no connection between the images of different scales, we herein propose a method that selects UAV image pairs based on image retrieval. In this method, sparse reconstruction was obtained via the sequential structure-from-motion (SfM) pipeline. First, principal component analysis (PCA) was used to reduce high-dimensional features to low-dimensional features to improve the efficiency of retrieval vocabulary construction. Second, by calculating the query depth threshold and discarding the invalid image pairs, we improved the efficiency of image matching. Third, the connected network of the dataset was constructed based on the initial matching of image pairs. The lost multi-scale image pairs were identified and matched through the image query between the connection components, which further improved the integrity of image matching. Our experimental results show that, compared with the traditional image retrieval method, the efficiency of the proposed method is improved by 25.9%.

| [1] | J. L. Schönberger, F. Fraundorfer, J. M. Frahm, Structure-from-motion for MAV image sequence analysis with photogrammetric applications, Int. Arch. Photogramm. Remote Sens. Spat. Inf. Sci., 40 (2014), 305. |
| [2] |
G. Rossi, L. Tanteri, V. Tofani, P. Vannocci, S. Moretti, N. Casagli, Multitemporal UAV surveys for landslide mapping and characterization, Landslides, 15 (2018), 1045-1052. doi: 10.1007/s10346-018-0978-0

|
| [3] | D. Meyer, E. Fraijo, E. Lo, D. Rissolo, F. Kuester, Optimizing UAV systems for rapid survey and reconstruction of large scale cultural heritage sites, 2015 Digital Heritage, 2015. |
| [4] |
P. Boccardo, F. Chiabrando, F. Dutto, F. G. Tonolo, A. Lingua, UAV deployment exercise for mapping purposes: evaluation of emergency response applications, Sensors, 15 (2015), 15717-15737. doi: 10.3390/s150715717
|
| [5] | J. A. Tenedório, R. Estanqueiro, A. Matos Lima, J. Marques, Remote sensing from unmanned aerial vehicles for 3D urban modelling: case study of Loulé, Portugal, International Conference Virtual City and Territory-11th Congress Virtual City and Territory, 2016. |
| [6] | C. Wu, Towards linear-time incremental structure from motion, 2013 International Conference on 3D Vision-3DV 2013, 2013. |
| [7] | J. L. Schonberger, J. M. Frahm, Structure-from-motion revisited, Proceedings of the IEEE conference on computer vision and pattern recognition, 2016. |
| [8] | S. Rothmund, U. Niethammer, J. P. Malet, M. Joswig, Landslide surface monitoring based on UAV- and ground-based images and terrestrial laser acanning: accuracy analysis and morphological interpretation, First Break, 31 (2013). |
| [9] |
N. Snavely, S. M. Seitz, R. Szeliski, Modeling the world from internet photo collections, Int. J. Comput. Vision, 80 (2008), 189-210. doi: 10.1007/s11263-007-0107-3
|
| [10] |
S. Fuhrmann, F. Langguth, N. Moehrle, M. Waechter, M. Goesele, MVE-An image-based reconstruction environment, Comput. Graphics, 53 (2015), 44-53. doi: 10.1016/j.cag.2015.09.003
|
| [11] |
J. P. Li, T. Jiang, D. Xiao, J. C. Wang, On diagram-based three-dimensional reconstruction of UAV image, Opt. Precis. Eng., 24 (2016), 1501-1509. doi: 10.3788/OPE.20162406.1501
|
| [12] |
S. Jiang, W. Jiang, Efficient structure from motion for oblique UAV images based on maximal spanning tree expansion, ISPRS J. Photogramm. Remote Sens., 132 (2017), 140-161. doi: 10.1016/j.isprsjprs.2017.09.004
|
| [13] |
D. Gálvez-López, J. D. Tardos, Bags of binary words for fast place recognition in Image sequences, IEEE Trans. Rob., 28 (2012), 1188-1197. doi: 10.1109/TRO.2012.2197158
|
| [14] | J. Sivic, A. Zisserman, Video google: a text retrieval approach to object matching in videos, Computer Vision IEEE International Conference on IEEE Computer Society, 2003. |
| [15] | D. Nister, H. Stewenius, Scalable recognition with a vocabulary tree, 2006 IEEE Computer Society Conference on Computer Vision and Pattern Recognition (CVPR'06), 2006. |
| [16] | H. Jegou, M. Douze, C. Schmid, Hamming embedding and weak geometric consistency for large scale image search, European conference on computer vision, 2008. |
| [17] | T. Shen, S. Zhu, T. Fang, R. Zhang, L. Quan, Graph-based consistent matching for structure-from-motion, European conference on computer vision, 2016. |
| [18] | P. Moulon, P. Monasse, R. Marlet, Global Fusion of Relative Motions for Robust, Proceedings of the IEEE International Conference on Computer Vision, 2013. |
| [19] | N. Snavely, S. M. Seitz, R. Szeliski, Photo Tourism: Exploring Photo Collections In 3D, in ACM siggraph 2006 papers, 2006. |
| [20] | P. Moulon, P. Monasse, R. Perrot, R. Marlet, OpenMVG: Open Multiple View Geometry, International Workshop on Reproducible Research in Pattern Recognition, 2016. |
| [21] | K. Ni, F. Dellaert, HyperSfM, Georgia Institute of Technology, 2012. |
| [22] |
S. Agarwal, Y. Furukawa, N. Snavely, I. Simon, B. Curless, S. M. Seitz, et al., Building Rome in a day, Commun. ACM, 54 (2011), 105-112. doi: 10.1145/2001269.2001293
|
| [23] | D. G. Lowe, Distinctive image features from scale-invariant keypoints, Int. J. Comput. Vision, 60 (2014), 91-110. |
| [24] | H. Bay, T. Tuytelaars, L. Van Gool, Surf: Speeded up robust features, European Conference on Computer Vision, 2006. |
| [25] | G. Yu, J. M. Morel, ASIFT: An Algorithm for Fully Affine Invariant Comparison, Image. Process. Line, 1 (2011), 11-38. |
| [26] | J. Heinly, E. Dunn, J. M. Frahm, Comparative evaluation of binary features, European Conference on Computer Vision, 2012. |
| [27] | H. Yimin, S. Wenxiu, S. Xiaoxue, SIFT feature dimension reduction method and its application in image retrieval, Chin. J. Lasers, 42 (2015), 216-221. |
| [28] | I. T. Joliffe, Principal component analysis, Springer-Verlag, (1986), 1061-1065. |
| [29] | Y. Ke, R. Sukthankar, PCA-SIFT: a more distinctive representation for local image descriptors, Proceedings of the 2004 IEEE Computer Society Conference on Computer Vision and Pattern Recognition, 2004. |
| [30] |
K. Mikolajczyk, C. Schmid, A performance evaluation of local descriptors, IEEE Trans. Pattern Anal. Mach. Intell., 27 (2005), 1615-1630. doi: 10.1109/TPAMI.2005.188
|
| [31] | H. Wang, L. Zhang, A. I. Haibin, A. N. Hong, Large scale aerial image retrieval method in 3D reconstruction, Sci. Surv. Mapp., 44 (2019), 136-144. |
| [32] |
N Otsu, A Threshold Selection Method from Gray-Level Histograms, IEEE Trans. Syst. Man Cybern., 9 (1979), 62-66. doi: 10.1109/TSMC.1979.4310076
|
| [33] | C. Wu, SiftGPU: A GPU Implementation of scale invariant feature transform, 2013. Available from: http://ccwu.me/vsfm/. |
| [34] |
M. A. Fischler, R. C. Bolles, Random sample consensus: a paradigm for model fitting with applications to image analysis and automated cartography, Commun. ACM, 24 (1981), 381-395. doi: 10.1145/358669.358692
|
| [35] |
B. Dezső, A. Jüttner, P. Kovács, LEMON-an Open Source C++ Graph Template Library, Elect. Notes Theor. Comput. Sci., 264 (2011), 23-45. doi: 10.1016/j.entcs.2011.06.003
|
| [36] | J. L. Schönberger, T. Price, T. Sattler, J. M. Frahm, M. Pollefeys, A vote-and-verify strategy for fast spatial verification in image retrieval, Asian Conference on Computer Vision, 2016. |
| [37] |
S. Jiang, W. Jiang, Efficient match pair selection for oblique UAV images based on adaptive vocabulary tree, ISPRS J. Photogramm. Remote Sens., 161 (2020), 61-75. doi: 10.1016/j.isprsjprs.2019.12.013
|
| [38] | G. Ioannakis, A. Koutsoudis, I. Pratikakis, C. Chamzas, RETRIEVAL-An Online Performance Evaluation Tool for Information Retrieval Methods, IEEE Trans. Multimedia, 20 (2017), 119-127. |


Figures(9) / Tables(2)

Chaofeng Ren, Xiaodong Zhi, Yuchi Pu, Fuqiang Zhang. A multi-scale UAV image matching method applied to large-scale landslide reconstruction[J]. Mathematical Biosciences and Engineering, 2021, 18(3): 2274-2287. doi: 10.3934/mbe.2021115


 DownLoad: