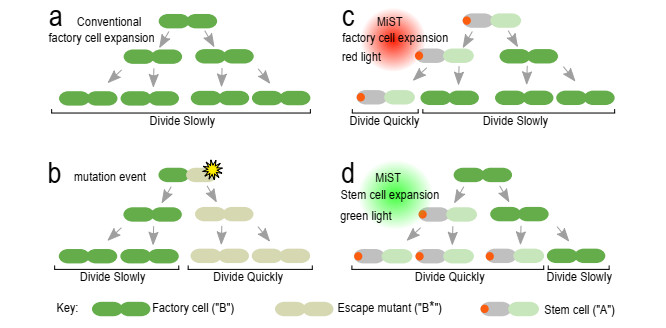
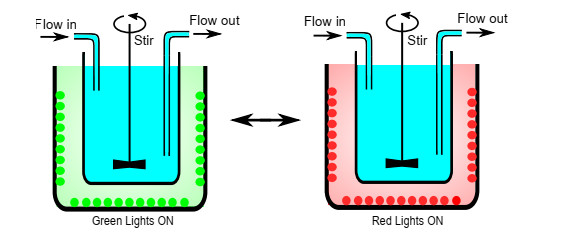
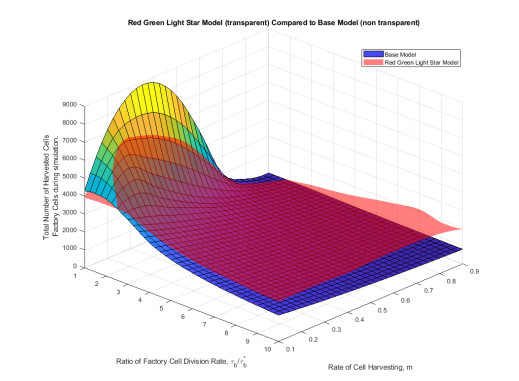
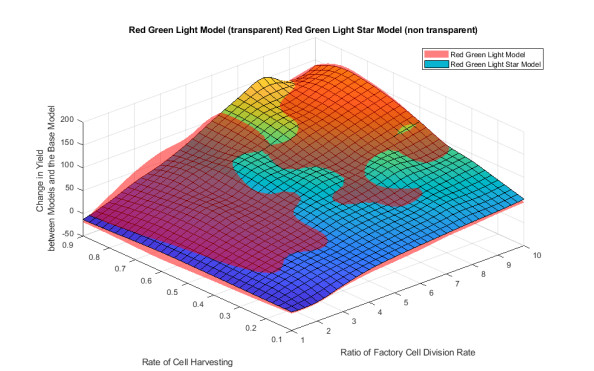
Industrial bioreactors use microbial organisms as living factories to produce a wide range of commercial products. For most applications, yields eventually become limited by the proliferation of "escape mutants" that acquire a growth advantage by losing the ability to make product. The goal of this work is to use mathematical models to determine whether this problem could be addressed in continuous flow bioreactors that include a "stem cell" population that multiplies rapidly and could be used to compete against the emergence of cheater mutants. In this system, external stimuli can be used to induce stem cell multiplication through symmetric cell division, or to limit stem cell multiplication and induce higher production through an asymmetric cell division that produces one stem cell and one new product-producing "factory cell". Our results show product yields from bioreactors with microbial stem cells can be increased by 18% to 127% over conventional methods, and sensitivity analysis shows that yields could be improved over a broad range of parameter space.
Citation: Dane Patey, Nikolai Mushnikov, Grant Bowman, Rongsong Liu. Mathematical modeling of population structure in bioreactors seeded with light-controllable microbial stem cells[J]. Mathematical Biosciences and Engineering, 2020, 17(6): 8182-8201. doi: 10.3934/mbe.2020415
Industrial bioreactors use microbial organisms as living factories to produce a wide range of commercial products. For most applications, yields eventually become limited by the proliferation of "escape mutants" that acquire a growth advantage by losing the ability to make product. The goal of this work is to use mathematical models to determine whether this problem could be addressed in continuous flow bioreactors that include a "stem cell" population that multiplies rapidly and could be used to compete against the emergence of cheater mutants. In this system, external stimuli can be used to induce stem cell multiplication through symmetric cell division, or to limit stem cell multiplication and induce higher production through an asymmetric cell division that produces one stem cell and one new product-producing "factory cell". Our results show product yields from bioreactors with microbial stem cells can be increased by 18% to 127% over conventional methods, and sensitivity analysis shows that yields could be improved over a broad range of parameter space.

| [1] |
L. Sanchez-Garcia, L. Martín, R. Mangues, N. Ferrer-Miralles, E. Vázquez, A. Villaverde, Recombinant pharmaceuticals from microbial cells: a 2015 update, Microb. Cell Fact., 15 (2016), 33. doi: 10.1186/s12934-016-0437-3

|
| [2] |
S.-F. Yuan, H. S. Alper, Metabolic engineering of microbial cell factories for production of nutraceuticals, Microb. Cell Fact., 18 (2019), 46. doi: 10.1186/s12934-019-1096-y
|
| [3] |
N. Mokashe, B. Chaudhari, U. Patil, Operative utility of salt-stable proteases of halophilic and halotolerant bacteria in the biotechnology sector, Int. J. Biol. Macromol., 117 (2018), 493-522. doi: 10.1016/j.ijbiomac.2018.05.217
|
| [4] | F. Hasan, A. A. Shah, S. Javed, A. Hameed, Enzymes used in detergents: Lipases, Afr. J. Biotechnol., 9 (2010), 4836-4844. |
| [5] |
W. Xu, X. Ma, Y. Wang, Production of squalene by microbes: an update, World J. Microb. Biot., 32 (2016), 195. doi: 10.1007/s11274-016-2155-8
|
| [6] |
C. Zhao, Y. Zhang, Y. Li, Production of fuels and chemicals from renewable resources using engineered escherichia coli, Biotechnol. Adv., 37 (2019), 107402. doi: 10.1016/j.biotechadv.2019.06.001
|
| [7] |
G.-Q. Chen, X.-R. Jiang, Engineering bacteria for enhanced polyhydroxyalkanoates (pha) biosynthesis, Synth. Syst. Biotechnol., 2 (2017), 192-197. doi: 10.1016/j.synbio.2017.09.001
|
| [8] |
O. Borkowski, F. Ceroni, G.-B. Stan, T. Ellis, Overloaded and stressed: whole-cell considerations for bacterial synthetic biology, Curr. Opin. Microbiol., 33 (2016), 123-130. doi: 10.1016/j.mib.2016.07.009
|
| [9] |
J. Nielsen, J. D. Keasling, Engineering cellular metabolism, Cell, 164 (2016), 1185-1197. doi: 10.1016/j.cell.2016.02.004
|
| [10] |
K. W. George, M. G. Thompson, J. Kim, E. E. K. Baidoo, G. Wang, V. T. Benites, et al., Integrated analysis of isopentenyl pyrophosphate (ipp) toxicity in isoprenoid-producing escherichia coli, Metab. Eng. Commun., 47 (2018), 60-72. doi: 10.1016/j.ymben.2018.03.004
|
| [11] |
H. Zeng, A. Yang, Quantification of proteomic and metabolic burdens predicts growth retardation and overflow metabolism in recombinant escherichia coli, Biotechnol. Bioeng., 116 (2019), 1484-1495. doi: 10.1002/bit.26943
|
| [12] |
A. Mukhopadhyay, Tolerance engineering in bacteria for the production of advanced biofuels and chemicals, Trends Microbiol., 23 (2015), 498-508. doi: 10.1016/j.tim.2015.04.008
|
| [13] |
P. Rugbjerg, N. M.-Petersen, A. Porse, K. S.-Lytzen, M. O. A. Sommer, Diverse genetic error modes constrain large-scale bio-based production, Nat. Commun., 9 (2018), 787. doi: 10.1038/s41467-018-03232-w
|
| [14] |
F. Moser, N. J. Broers, S. Hartmans, A. Tamsir, R. Kerkman, J. A. Roubos, et al., Genetic circuit performance under conditions relevant for industrial bioreactors, ACS Synth. Biol., 1 (2012), 555-564. doi: 10.1021/sb3000832
|
| [15] | H. R. Thieme, Mathematics in population biology, volume 12. Princeton University Press, 2018. |
| [16] | J. D. Murray, Mathematical biology: I. An introduction, volume 17. Springer Science & Business Media, 2007. |
| [17] | A. Hastings, Population biology: concepts and models, Springer Science & Business Media, 2013. |
| [18] |
N. Bellomo, M. Delitala, From the mathematical kinetic, and stochastic game theory to modelling mutations, onset, progression and immune competition of cancer cells, Phys. Life Rev., 5 (2008), 183-206. doi: 10.1016/j.plrev.2008.07.001
|
| [19] |
J. L. Bautista, C.-W. J. Lio, S. K. Lathrop, K. Forbush, Y. Liang, J. Luo, et al., Intraclonal competition limits the fate determination of regulatory t cells in the thymus, Nat. Immunol., 10 (2009), 610-617. doi: 10.1038/ni.1739
|
| [20] |
N. Bellomo, A. Bellouquid, M. Delitala, Mathematical topics on the modelling complex multicellular systems and tumor immune cells competition, Math. Models Methods Appl. Sci., 14 (2004), 1683-1733. doi: 10.1142/S0218202504003799
|
| [21] |
N. V. Mushnikov, A. Fomicheva, M. Gomelsky, G. R. Bowman, Inducible asymmetric cell division and cell differentiation in a bacterium, Nat. Chem. Biol., 15 (2019), 925-931. doi: 10.1038/s41589-019-0340-4
|
| [22] |
W. B. Schofield, H. C. Lim, C. Jacobs-Wagner, Cell cycle coordination and regulation of bacterial chromosome segregation dynamics by polarly localized proteins, EMBO J., 29 (2010), 3068-3081. doi: 10.1038/emboj.2010.207
|


Figures(16) / Tables(1)

Dane Patey, Nikolai Mushnikov, Grant Bowman, Rongsong Liu. Mathematical modeling of population structure in bioreactors seeded with light-controllable microbial stem cells[J]. Mathematical Biosciences and Engineering, 2020, 17(6): 8182-8201. doi: 10.3934/mbe.2020415


 DownLoad: