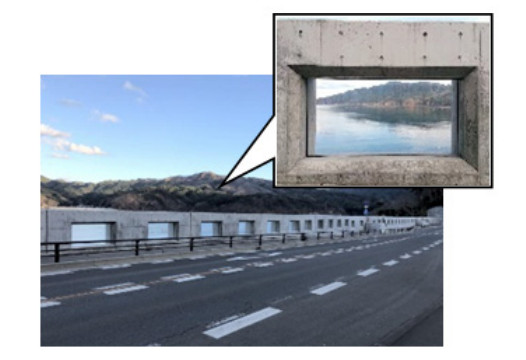
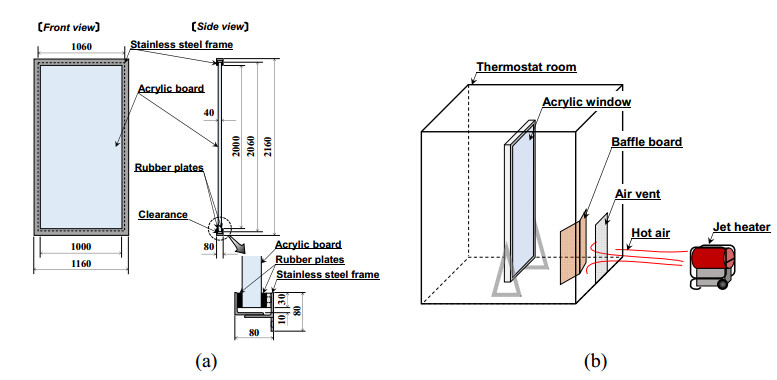
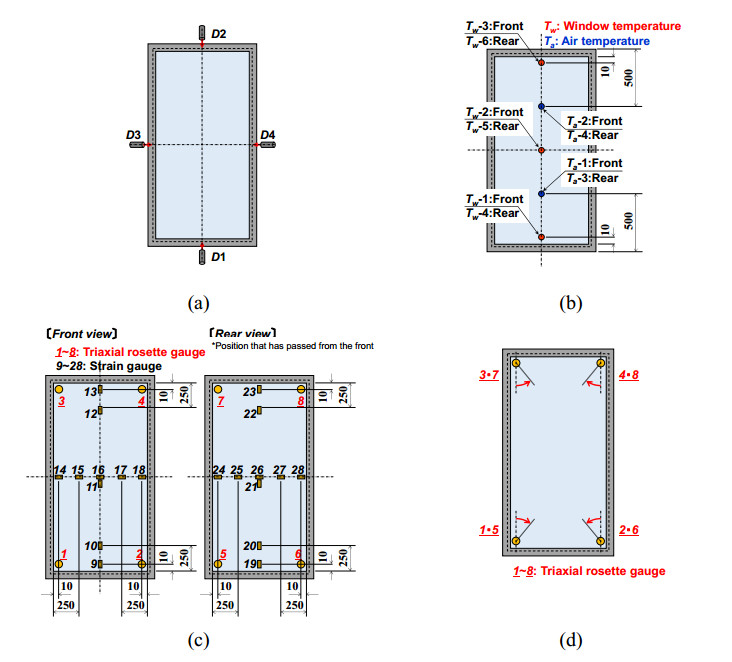
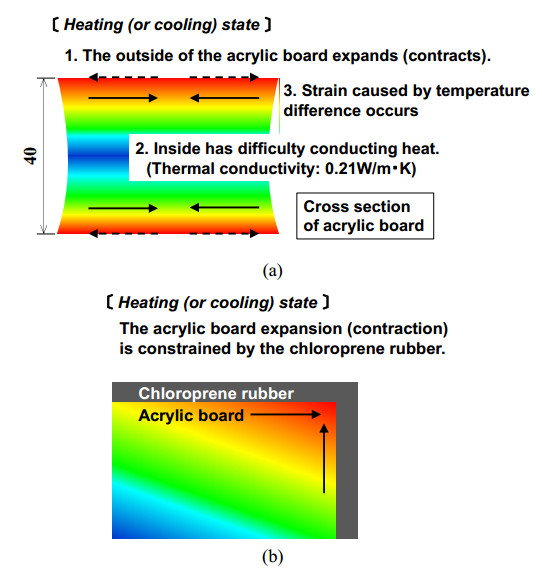
Tide-embankment walls protecting coastal roads frequently contain numerous windows so that pedestrians and drivers can view the scenery without experiencing reduced sunlight. Tide-embankment windows must withstand extreme climatic conditions. However, the effects of temperature extremes on acrylic boards have rarely been studied. This paper proposes a simple method for constructing a high-temperature environment and a method for measuring strain on an acrylic plate. The deformation and strain of a 40-mm-thick acrylic tide-embankment window were determined experimentally and numerically in this study in a high-temperature environment, obtaining similar results; additionally, the numerical method was subsequently used to simulate a low-temperature environment. Because thermal conductivity was low, the internal temperature of the thick acrylic board did not immediately change with the temperature of the surface, and thermal expansion and contraction of the board were restrained. Temperature-induced deformation effects were low across the entire range of temperatures and heating rates recorded in coastal Japan.
Citation: Kentaro Yasui, Akira Shiokawa, Masashi Watanabe, Hiroyuki Kinoshita, Chihiro Morita. Temperature deformation characteristics of acrylic windows used for tide embankments[J]. AIMS Materials Science, 2021, 8(6): 932-951. doi: 10.3934/matersci.2021057
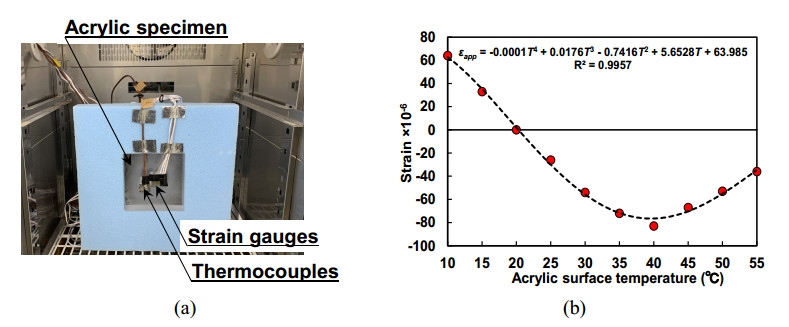
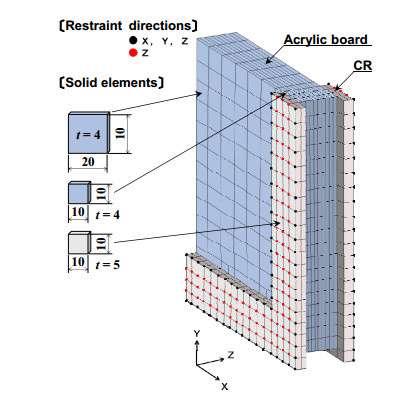
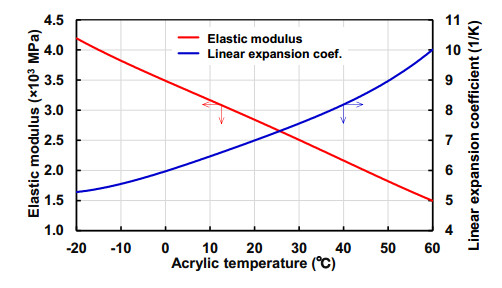
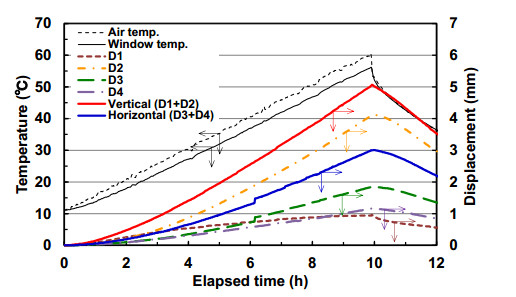
Tide-embankment walls protecting coastal roads frequently contain numerous windows so that pedestrians and drivers can view the scenery without experiencing reduced sunlight. Tide-embankment windows must withstand extreme climatic conditions. However, the effects of temperature extremes on acrylic boards have rarely been studied. This paper proposes a simple method for constructing a high-temperature environment and a method for measuring strain on an acrylic plate. The deformation and strain of a 40-mm-thick acrylic tide-embankment window were determined experimentally and numerically in this study in a high-temperature environment, obtaining similar results; additionally, the numerical method was subsequently used to simulate a low-temperature environment. Because thermal conductivity was low, the internal temperature of the thick acrylic board did not immediately change with the temperature of the surface, and thermal expansion and contraction of the board were restrained. Temperature-induced deformation effects were low across the entire range of temperatures and heating rates recorded in coastal Japan.

| [1] | Earthquakes and Tsunamis-Observation and Disaster Mitigation, Japan Meteorological Agency, 2021. Available from: https://www.jma.go.jp/jma/kishou/books/jishintsunami/en/jishintsunami_en.pdf. |
| [2] | Yamashita H (2010) Living together with seawalls: Risks and reflexive modernization in Japan. Environ Sociol 6: 161-181. |
| [3] |
Kimura S (2016) When a seawall is visible: Infrastructure and obstruction in post-tsunami reconstruction in Japan. Sci Cult 25: 23-43. doi: 10.1080/09505431.2015.1081501

|
| [4] | Pawar E (2016) A review article on acrylic PMMA. IOSR J Mech Civ Eng 13: 1-4. |
| [5] | Kishimoto Y (2010) Characteristic and processing method of acrylic resin. J Measur Subcomm 18: 24-28 (in Japanese). Available from: https://doi.org/10.18973/measurementjsrt.18.1_24. |
| [6] | Harper CA, Petrie EM (2003) Plastics Materials and Processes: A Concise Encyclopedia, 1 Ed., New York: John Wiley & Sons, 7-9. |
| [7] |
Kaddouri A, Serier B, Kaddouri K, et al. (2020) Experimental analysis of the physical degradation of polymers-The case of polymethyl methacrylate. Frat Integrità Strutt 14: 66-80. doi: 10.3221/IGF-ESIS.53.06
|
| [8] |
Abdel-Wahab AA, Ataya S, Silberschmidt VV (2017) Temperature-dependent mechanical behaviour of PMMA: Experimental analysis and modelling. Polym Test 58: 86-95. doi: 10.1016/j.polymertesting.2016.12.016
|
| [9] | Japan Petrochemical Industry Association Methacrylic Policy Committee Technical Working Group (2009) Design Handbook Using Acrylic Plate (in Japanese). |
| [10] | Shimbo M, Sugimori S, Miyano Y, et al. (1990) Residual stress and deformation of PMMA due to thermoviscoelastic behavior. Trans JSME 56: 971-977 (in Japanese). Available from: https://doi.org/10.1299/kikaia.56.971. |
| [11] | Siriteerakul S, Siriteerakul T (2017) Heat conduction analysis of wall materials, Proceedings of the International Conference on Engineering, Science, and Applications, Tokyo: Global Academic-Industrial Cooperation Society, 1: 63-74. |
| [12] | Kohsaka Y (2017) Transformable acrylic resin. Chem Edu 65: 236-237 (in Japanese). Available from: https://doi.org/10.20665/kakyoshi.65.5_236. |
| [13] | Iduka G (1956) Polymer materials for architecture. Polymers 5: 280-283 (in Japanese). Available from: https://doi.org/10.1295/kobunshi.5.6_280. |
| [14] | Japanese Industrial Standards (2015) Plastics-poly(methyl methacrylate) sheets-types, dimensions and characteristics-Part 1: Cast sheets. JIS K 6718-1 (in Japanese). |
| [15] | Japan Meteorological Agency, Past Weather Data, 2021 (in Japanese). Available from: https://www.data.jma.go.jp/obd/stats/etrn/view/rankall.php. |
| [16] | MSC Software Corporation, MARC Volume A Theory and User Information, 2017. Available from: http://www.mscsoftware.com/. |
| [17] | The Japan Society for Technology of Plasticity (1991) Molten and Solid State Molding of Plastics-From Fundamental Phenomena to Advanced Technologies, 1 Ed., Tokyo: Corona Publishing, 15: 216-217 (in Japanese). |
| [18] |
Zhou J, Heisserer U, Duke PW, et al. (2021) The sensitivity of the tensile properties of PMMA, Kevlar® and Dyneema® to temperature and strain rate. Polymer 225: 123781. doi: 10.1016/j.polymer.2021.123781
|


Figures(14) / Tables(3)

Kentaro Yasui, Akira Shiokawa, Masashi Watanabe, Hiroyuki Kinoshita, Chihiro Morita. Temperature deformation characteristics of acrylic windows used for tide embankments[J]. AIMS Materials Science, 2021, 8(6): 932-951. doi: 10.3934/matersci.2021057


 DownLoad: