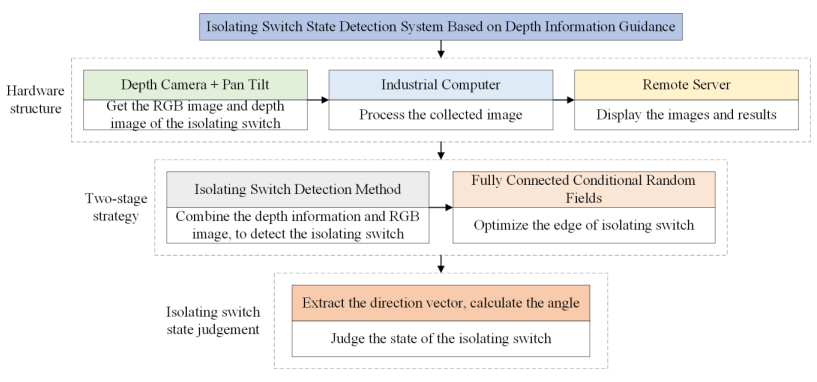
This study addressed the critical role of isolating switches in controlling circuit connections for the stable operation of the substation. Our research introduced an innovative state detection system that utilized depth information guidance, comprising a controllable pan-tilt mechanism, a depth camera, and an industrial computer. The software component employed a two-stage strategy for precise isolating switch detection. Initially, the red green blue with depth (RGB-D) saliency network identified the approximate area of the isolating switch target. Subsequently, a fully connected conditional random field was applied to extract accurate detection results. The real-time state of the isolating switch was determined based on the geometric relationship between its arms. This approach enhanced the accuracy of isolating switch detection, ensuring practical applicability in engineering scenarios. The significance of this research lies in its contribution to advancing isolating switch monitoring through depth information guidance, promoting a more robust and reliable power system. The key improvement is implementing a two-stage strategy, combining RGB-D saliency analysis and conditional random field processing, resulting in enhanced accuracy in isolating switch detection. As validated through extensive experiments, the proposed system's successful application in practical engineering underscores its effectiveness in meeting the accuracy requirements for isolating switch detection and state detection. This innovation holds promise for broader applications in power systems, showcasing its potential to elevate the reliability and efficiency of electrical networks. Code of the proposed system is available at: https://github.com/miaomiao0909/Isolating-Switch-Detection/tree/master.
Citation: Hui Xu, Xinyang Zhao, Qiyun Yin, Junting Dou, Ruopeng Liu, Wengang Wang. Isolating switch state detection system based on depth information guidance[J]. Electronic Research Archive, 2024, 32(2): 836-856. doi: 10.3934/era.2024040
This study addressed the critical role of isolating switches in controlling circuit connections for the stable operation of the substation. Our research introduced an innovative state detection system that utilized depth information guidance, comprising a controllable pan-tilt mechanism, a depth camera, and an industrial computer. The software component employed a two-stage strategy for precise isolating switch detection. Initially, the red green blue with depth (RGB-D) saliency network identified the approximate area of the isolating switch target. Subsequently, a fully connected conditional random field was applied to extract accurate detection results. The real-time state of the isolating switch was determined based on the geometric relationship between its arms. This approach enhanced the accuracy of isolating switch detection, ensuring practical applicability in engineering scenarios. The significance of this research lies in its contribution to advancing isolating switch monitoring through depth information guidance, promoting a more robust and reliable power system. The key improvement is implementing a two-stage strategy, combining RGB-D saliency analysis and conditional random field processing, resulting in enhanced accuracy in isolating switch detection. As validated through extensive experiments, the proposed system's successful application in practical engineering underscores its effectiveness in meeting the accuracy requirements for isolating switch detection and state detection. This innovation holds promise for broader applications in power systems, showcasing its potential to elevate the reliability and efficiency of electrical networks. Code of the proposed system is available at: https://github.com/miaomiao0909/Isolating-Switch-Detection/tree/master.

| [1] |
J. K. Pylvanainen, K. Nousiainen, P. Verho, Studies to utilize loading guides and ANN for oil-immersed distribution trans-former condition monitoring, IEEE Trans. Power Delivery, 22 (2006), 201–207. https://doi.org/10.1109/TPWRD.2006.877075 doi: 10.1109/TPWRD.2006.877075

|
| [2] | L. Maraaba, Z. Al-Hamouz, H. Al-Duwaish, Estimation of high voltage insulator contamination using a combined image processing and artificial neural networks, in IEEE 8th International Power Engineering and Optimization Conference, (2014), 214–219. http://doi/org/10.1109/PEOCO.2014.6814428 |
| [3] |
J. Xie, C. Liu, M. Sforna, M. Bilek, R. Hamza, On-line physical security monitoring of power substations, Int. Trans. Electr. Energy Syst., 26 (2016), 1148–1170. http://doi/org/10.1002/etep.2122 doi: 10.1002/etep.2122
|
| [4] | D. Pernebayeva, M. Bagheri, A. James, High voltage insulator surface evaluation using image processing, in 2017 International Symposium on Electrical Insulating Materials (ISEIM), 2 (2017), 520–523. http://doi/org/10.23919/ISEIM.2017.8166540 |
| [5] |
J. Sui, S. Liao, B. Li, H. Zhang, High sensitivity multitasking non-reciprocity sensor using the photonic spin Hall effect, Opt. Lett., 47 (2022), 6065–6068. https://doi.org/10.1364/OL.476048 doi: 10.1364/OL.476048
|
| [6] |
J. Sui, J. Zou, S. Liao, B. Li, H. Zhang, High sensitivity multiscale and multitasking terahertz Janus sensor based on photonic spin Hall effect, Appl. Phys. Lett., 23 (2023), 122. https://doi.org/10.1063/5.0153342 doi: 10.1063/5.0153342
|
| [7] |
B. Wan, Q. Wang, H. Peng, H. Ye, H. Zhang, A late-model optical biochemical sensor based on OTS for methane gas and glucose solution concentration detection, IEEE Sens. J., 21 (2021), 21465–21472. http://doi/org/10.1109/JSEN.2021.3103548 doi: 10.1109/JSEN.2021.3103548
|
| [8] |
J. Li, H. Liu, T. Bi, Tunnel magnetoresistance-based noncontact current sensing and measurement method, IEEE Trans. Instrum. Meas., 71 (2022), 1–9. http://doi/org/10.1109/TIM.2022.3152240 doi: 10.1109/TIM.2022.3152240
|
| [9] |
H. Yuan, Z. Sun, L. Wang, A. Yang, X. Wang, M. Rong, Fault Diagnosis of Disconnector Based on Attitude Sensing System, High Voltage Eng., 1 (2022), 47–57. http://doi/org/10.13336/j.1003-6520.hve.20210884 doi: 10.13336/j.1003-6520.hve.20210884
|
| [10] |
L. Jin, D. Zhang, Contamination grades recognition of ceramic insulators using fused features of infrared and ultraviolet images, Energies, 8 (2015), 837–858. http://doi/org/10.3390/en8020837 doi: 10.3390/en8020837
|
| [11] |
S. Liao, J. An, A robust insulator detection algorithm based on local features and spatial orders for aerial images, IEEE Geo-Sci. Remote Sens. Lett., 12 (2014), 963–967. http://doi/org/10.1109/LGRS.2014.2369525 doi: 10.1109/LGRS.2014.2369525
|
| [12] |
W. Liu, G. Dong, M. Zou, Satellite road extraction method based on RFDNet neural network, Electron. Res. Arch., 31 (2023), 4362–4377. http://doi/org/10.3934/era.2023223 doi: 10.3934/era.2023223
|
| [13] | M. Bacco, P. Cassarà, A. Gotta, M. Puddu, A simulation framework for QoE-aware real-time video streaming in multipath scenarios, in Ad-Hoc, Mobile, and Wireless Networks: 19th International Conference on Ad-Hoc Networks and Wireless, ADHOC-NOW 2020, Bari, Italy, October 19–21, 2020, Proceedings 19. Springer International Publishing, (2020), 114–121. |
| [14] |
Y. Dong, J. Liu, Y. Lan, A classification method for breast images based on an improved VGG16 network model, Electron. Res. Arch., 31 (2023), 2358–2373. http://doi/org/10.3934/era.2023120 doi: 10.3934/era.2023120
|
| [15] |
C. Chen, H. Kong, B. Wu, Edge detection of remote sensing image based on Grünwald-Letnikov fractional difference and Otsu threshold, Electron. Res. Arch., 31 (2023), 1287–1302. http://doi/org/10.3934/era.2023066 doi: 10.3934/era.2023066
|
| [16] | L. Romeo, R. Marani, A. Petitti, A. Milella, T. D'Orazio, G. Cicirelli, Image-based mobility assessment in elderly people from low-cost systems of cameras: A skeletal dataset for experimental evaluations, in Ad-Hoc, Mobile, and Wireless Networks: 19th International Conference on Ad-Hoc Networks and Wireless, ADHOC-NOW 2020, Bari, Italy, October 19–21, 2020, Proceedings 19. Springer International Publishing, (2020), 125–130. |
| [17] |
Y. Ma, Q. Li, L. Chu, Y. Zhou, C. Xu, Real-time detection and spatial localization of insulators for UAV inspection based on binocular stereo vision, Remote Sens., 13 (2021), 230. http://doi/org/10.3390/rs13020230 doi: 10.3390/rs13020230
|
| [18] | G. Zhang, D. Zhang, D. Li, L. Zhou, The automatic identification method of switch state, Int. J. Simul.: Syst., Sci. Technol., 17 (2016), 21.1–21.4. |
| [19] |
Y. Teng, T. Y. Tan, C. Lei, J. Yang, Y. Ma, K. Zhao, et al., A novel method to recognize the state of high-voltage isolating switch, IEEE Trans. Power Delivery, 34 (2019), 1350–1356. http://doi/org/10.1109/TPWRD.2019.2897132 doi: 10.1109/TPWRD.2019.2897132
|
| [20] | J. Wang, Q. Liu, K. Zhao, Y. Jiang, L. Cheng, Recognition of high voltage isolating switch's states based on object tracking, in 4th International Conference on Systems and Informatics (ICSAI), (2017), 474–478. http://doi/org/10.1109/ICSAI.2017.8248339 |
| [21] |
C. Yang, X. Wu, W. Gong, Q. Wang, L. Li, An intelligent identification algorithm for obtaining the state of power equipment in SIFT-based environments, Int. J. Performabil. Eng. 15 (2019), 2382. http://doi/org/10.23940/ijpe.19.09.p11.23822391 doi: 10.23940/ijpe.19.09.p11.23822391
|
| [22] | J. Lu, H. Lin, W. Zhang, X. Shi, A condition monitoring algorithm based on image geometric analysis for substation switch, in Proceedings of 2015 International Conference on Intelligent Computing and Internet of Things, (2015), 72–76. http://doi/org/10.1109/ICAIOT.2015.7111541 |
| [23] | Y. Bin, C. Hao, H. Wenguang, Study on the method of switch state detection based on image recognition in substation sequence control, in 2014 International Conference on Power System Technology, (2014), 2504–2510. http://doi/org/10.1109/POWERCON.2014.6993781 |
| [24] |
J. Xu, Q. Li, Y. Luo, Y. Zhou, J. Wang, State measurement of isolating switch using cost fusion and smoothness prior based stereo matching, Int. J. Adv. Rob. Syst., 17 (2020), 1729881420925299. http://doi/org/10.1177/1729881420925299 doi: 10.1177/1729881420925299
|
| [25] |
M. S. Jadin, S. Taib, Recent progress in diagnosing the reliability of electrical equipment by using infrared thermography, Infrared Phys. Technol., 55 (2012), 236–245. http://doi/org/10.1016/j.infrared.2012.03.002 doi: 10.1016/j.infrared.2012.03.002
|
| [26] |
I. Ullah, F. Yang, R. Khan, L. Liu, H. Yang, B. Gao, et al., Predictive maintenance of power substation equipment by infrared thermography using a machine-learning approach, Energies, 10 (2017), 1987. http://doi/org/10.3390/en10121987 doi: 10.3390/en10121987
|
| [27] |
I. Ullah, R. U. Khan, F. Yang, L. Wuttisittikulkij, Deep learning image-based defect detection in high voltage electrical equipment, Energies, 13 (2020), 392. http://doi/org/10.3390/en13020392 doi: 10.3390/en13020392
|
| [28] | T. Zhou, D. Fan, M. Cheng, J. Shen, L. Shao, RGB-D salient object detection: A survey, Comput. Visual Media, (2021), 37–69 |
| [29] | L. Junfeng, L. Min, W. Qinruo, A novel insulator detection method for aerial images, in Proceedings of the 9th International Conference on Computer and Automation Engineering, (2017), 141–144. |
| [30] |
D. Gong, Z. He, X. Ye, Z. Fang, Visual saliency detection for over-temperature regions in 3D space via dual-source images, Sensors, 20 (2020), 3414. http://doi/org/10.3390/s20123414 doi: 10.3390/s20123414
|
| [31] |
C. Rother, V. Kolmogorov, A. Blake, 'GrabCut' interactive foreground extraction using iterated graph cuts, ACM Trans. Graphics (TOG), 23 (2004), 309–314. http://doi/org/10.1145/1015706.1015720 doi: 10.1145/1015706.1015720
|
| [32] | P. Krä henbühl, V. Koltun, Efficient inference in fully connected crfs with gaussian edge potentials, Adv. Neural Inf. Process. Syst., (2011), 24. |
| [33] | P. Krä henbühl, V. Koltun, Parameter learning and convergent inference for dense random fields, in International Conference on Machine Learning (PMLR), (2013), 213–521. |
| [34] |
Y. Chen, W. Zhou, Hybrid-attention network for RGB-D salient object detection, Appl. Sci., 10 (2020), 5806. http://doi/org/10.3390/app10175806 doi: 10.3390/app10175806
|
| [35] |
Z. Wu, G. Allibert, F. Meriaudeau, C. Ma, C. Demonceaux, Hidanet: Rgb-d salient object detection via hierarchical depth awareness, IEEE Trans. Image Process., 32 (2023), 2160–2173. http://doi/org/10.1109/TIP.2023.3263111 doi: 10.1109/TIP.2023.3263111
|
| [36] | S. Liu, D. Huang, Receptive field block net for accurate and fast object detection, in Proceedings of the European Conference on Computer Vision (ECCV), (2018), 385–400. |
| [37] | D. P. Fan, M. M. Cheng, Y. Liu, T. Li, A. Borji, Structure-measure: A new way to evaluate foreground maps, in Proceedings of the IEEE International Conference on Computer Vision, (2017), 4548–4557. http://doi/org/10.1109/TPAMI.2022.3145877 |
| [38] | K. Min, G. H. Lee, S. W. Lee, Acnet: Mask-aware attention with dynamic context enhancement for robust acne detection, in IEEE International Conference on Systems, Man, and Cybernetics (SMC), (2021), 2724–2729. http://doi/org/10.1109/SMC52423.2021.9659243 |
| [39] | M. N. Mahmud, M. H. Azim, M. Hisham, M. K. Osman, A. P. Ismail, F. Ahmad, et al., Altitude analysis of road segmentation from UAV images with DeepLab V3+, in IEEE 12th International Conference on Control System, Computing and Engineering (ICCSCE), (2022), 219–223. http://doi/org/10.1109/ICCSCE54767.2022.9935649 |
| [40] | D. Seichter, M. Kö hler, B. Lewandowski, T. Wengefeld, H. M. Gross, Efficient rgb-d semantic segmentation for indoor scene analysis, in IEEE International Conference on Robotics and Automation (ICRA), (2021), 13525–13531. http://doi/org/10.1109/ICRA48506.2021.9561675 |
| [41] | H. Zhao, Y. Zhang, S. Liu, J. Shi, C. C. Loy, D. Lin, et al., Psanet: Point-wise spatial attention network for scene parsing, in Proceedings of the European Conference on Computer Vision (ECCV), (2018), 267–283. |
| [42] | P. Ravikiran, M. Chakkaravarthy, Improved efficiency of semantic segmentation using pyramid scene parsing deep learning network method, in Intelligent Systems and Sustainable Computing: Proceedings of ICISSC 2021. Singapore: Springer Nature Singapore, (2022), 175–181. |
| [43] | J. Kim, H. Park, Reduced CNN model for face image detection with GAN oversampling, in Innovative Mobile and Internet Services in Ubiquitous Computing: Proceedings of the 15th International Conference on Innovative Mobile and Internet Services in Ubiquitous Computing (IMIS-2021). Springer International Publishing, (2022), 232–241. |
| [44] |
H. Zhou, H. Chen, Y. Zhang, M. Wei, H. Xie, J. Wang, et al., Refine-net: Normal refinement neural network for noisy point clouds, IEEE Trans. Pattern Anal. Mach. Intell., 45(2022), 946–963. http://doi/org/10.1109/TPAMI.2022.3145877 doi: 10.1109/TPAMI.2022.3145877
|
| [45] | J. Zhang, D. P. Fan, Y. Dai, S. Anwar, F. S. Saleh, T. Zhang, et al., UC-Net: Uncertainty inspired RGB-D saliency detection via conditional variational autoencoders, in Proceedings of the IEEE/CVF Conference on Computer Vision and Pattern Recognition, (2020), 8582–8591. |
| [46] |
X. Zhou, W. Cao, H. Gao, Z. Ming, J. Zhang, STI-Net: Spatiotemporal integration network for video saliency detection, Inf. Sci., 628 (2023), 134–147. https://doi.org/10.1016/j.ins.2023.01.106 doi: 10.1016/j.ins.2023.01.106
|
| [47] |
Q. Chang, S. Zhu, Human vision attention mechanism-inspired temporal-spatial feature pyramid for video saliency detection, Cognit. Comput., (2023), 1–13. http://doi/org/10.1007/s12559-023-10114-x doi: 10.1007/s12559-023-10114-x
|
| [48] |
M. Jian, X. Lu, X. Yu, Y. Ju, H. Yu, K. M. Lam, Flow-Edge-Net: Video saliency detection based on optical flow and edge-weighted balance loss, IEEE Trans. Comput. Social Syst., 2023. http://doi/org/10.1109/TCSS.2023.3270164 doi: 10.1109/TCSS.2023.3270164
|
| [49] |
Y. Teng, T. Tan, C. Lei, J. Yang, Y. Ma, K. Zhao, et al., A novel method to recognize the state of high-voltage isolating switch, IEEE Trans. Power Delivery, 34 (2019), 1350–1356. http://doi/org/10.1109/TPWRD.2019.2897132 doi: 10.1109/TPWRD.2019.2897132
|
| [50] |
X. Lu, W. Quan, S. Gao, G. Zhang, K. Feng, G. Lin, et al., A segmentation-based multitask learning approach for isolating switch state recognition in high-speed railway traction substation, IEEE Trans. Intell. Transp. Syst., 23 (2022), 15922–15939. http://doi/org/10.1109/TITS.2022.3146338 doi: 10.1109/TITS.2022.3146338
|


Figures(11) / Tables(3)
Hui Xu, Xinyang Zhao, Qiyun Yin, Junting Dou, Ruopeng Liu, Wengang Wang. Isolating switch state detection system based on depth information guidance[J]. Electronic Research Archive, 2024, 32(2): 836-856. doi: 10.3934/era.2024040


 DownLoad: