Imaging genetics mainly finds the correlation between multiple datasets, such as imaging and genomics. Sparse canonical correlation analysis (SCCA) is regarded as a useful method that can find connections between specific genes, SNPs, and diseased brain regions. Fused pairwise group lasso-SCCA (FGL-SCCA) can discover the chain relationship of genetic variables within the same modality or the graphical relationship between images. However, it can only handle genetic and imaging data from a single modality. As Alzheimer's disease is a kind of complex and comprehensive disease, a single clinical indicator cannot accurately reflect the physiological process of the disease. It is urgent to find biomarkers that can reflect AD and more synthetically reflect the physiological function of disease development. In this study, we proposed a multimodal sparse canonical correlation analysis model FGL-JSCCAGNR combined FGL-SCCA and Joint SCCA (JSCCA) method which can process multimodal data. Based on the JSCCA algorithm, it imposes a GraphNet regularization penalty term and introduces a fusion pairwise group lasso (FGL), and a graph-guided pairwise group lasso (GGL) penalty term, the algorithm in this paper can combine data between different modalities, Finally, the Annual Depression Level Total Score (GDSCALE), Clinical Dementia Rating Scale (GLOBAL CDR), Functional Activity Questionnaire (FAQ) and Neuropsychiatric Symptom Questionnaire (NPI-Q), these four clinical data are embedded in the model by linear regression as compensation information. Both simulation data and real data analysis show that when FGI-JSCCAGNR is applied to the imaging genetics study of Alzheimer's patients, the model presented here can detect more significant genetic variants and diseased brain regions. It provides a more robust theoretical basis for clinical researchers.
Citation: Shuaiqun Wang, Huiqiu Chen, Wei Kong, Xinqi Wu, Yafei Qian, Kai Wei. A modified FGL sparse canonical correlation analysis for the identification of Alzheimer's disease biomarkers[J]. Electronic Research Archive, 2023, 31(2): 882-903. doi: 10.3934/era.2023044
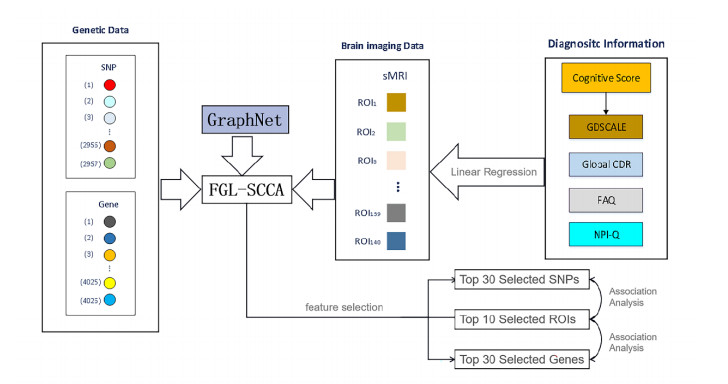
Imaging genetics mainly finds the correlation between multiple datasets, such as imaging and genomics. Sparse canonical correlation analysis (SCCA) is regarded as a useful method that can find connections between specific genes, SNPs, and diseased brain regions. Fused pairwise group lasso-SCCA (FGL-SCCA) can discover the chain relationship of genetic variables within the same modality or the graphical relationship between images. However, it can only handle genetic and imaging data from a single modality. As Alzheimer's disease is a kind of complex and comprehensive disease, a single clinical indicator cannot accurately reflect the physiological process of the disease. It is urgent to find biomarkers that can reflect AD and more synthetically reflect the physiological function of disease development. In this study, we proposed a multimodal sparse canonical correlation analysis model FGL-JSCCAGNR combined FGL-SCCA and Joint SCCA (JSCCA) method which can process multimodal data. Based on the JSCCA algorithm, it imposes a GraphNet regularization penalty term and introduces a fusion pairwise group lasso (FGL), and a graph-guided pairwise group lasso (GGL) penalty term, the algorithm in this paper can combine data between different modalities, Finally, the Annual Depression Level Total Score (GDSCALE), Clinical Dementia Rating Scale (GLOBAL CDR), Functional Activity Questionnaire (FAQ) and Neuropsychiatric Symptom Questionnaire (NPI-Q), these four clinical data are embedded in the model by linear regression as compensation information. Both simulation data and real data analysis show that when FGI-JSCCAGNR is applied to the imaging genetics study of Alzheimer's patients, the model presented here can detect more significant genetic variants and diseased brain regions. It provides a more robust theoretical basis for clinical researchers.

| [1] |
N. Villain, B. Dubois, Alzheimer's disease including focal presentations, Semin. Neurol., 39 (2019), 213–226. https://doi.org/10.1055/s-0039-1681041 doi: 10.1055/s-0039-1681041

|
| [2] |
M. Tanveer, B. Richhariya, R. Khan, A. Rashid, P. Khanna, M. Prasad, et al., Machine learning techniques for the diagnosis of Alzheimer's disease: A review, ACM Trans., 16 (2020), 1–35. https://doi.org/10.1145/3344998 doi: 10.1145/3344998
|
| [3] |
P. Khan, M. F. Kader, S. Islam, Machine learning and deep learning approaches for brain disease diagnosis: Principles and recent advances, IEEE Access, 9 (2021), 37622–37655. https://doi.org/10.1109/ACCESS.2021.3062484 doi: 10.1109/ACCESS.2021.3062484
|
| [4] |
E. Parkhomenko, D. Tritchler, J. Beyene, Sparse canonical correlation analysis with application to genomic data integration, Stat. Appl. Genet. Mol. Biol., 8 (2009). https://doi.org/10.2202/1544-6115.1406 doi: 10.2202/1544-6115.1406
|
| [5] |
A. R. Mohammadinejad, G. A. HosseinZadeh, H. SoltanianZadeh, Structured and sparse canonical correlation analysis as a brain-wide multi-modal data fusion approach, IEEE Trans. Med. Imaging, 36 (2017), 1438–1448. https://doi.org/10.1109/TMI.2017.2681966 doi: 10.1109/TMI.2017.2681966
|
| [6] | L. Du, H. Huang, J. Yan, S. Kim, S. Risacher, M. Inlow, et al., Structured sparse CCA for brain imaging genetics via graph OSCAR, BMC Syst. Biol., 10 (2016), Supplement 3, 68. https://doi.org/10.1186/s12918-016-0312-1 |
| [7] |
L. Du, F. Liu, K. Liu, X. Yao, S. L. Risacher, J. Han, et al., Associating multi-modal brain Imaging phenotypes and genetic risk factors via a dirty multi-task learning method, IEEE Trans. Med. Imaging, 39 (2020), 3416–3428. https://doi.org/10.1109/TMI.2020.2995510 doi: 10.1109/TMI.2020.2995510
|
| [8] | L. Du, J. Yan, S. Kim, S. L. Risacher, H. Huang, M. Inlow, et al., GN-SCCA: GraphNet based sparse canonical correlation analysis for brain imaging genetics, in International Conference on Brain Informatics and Health, 9250 (2015), 275–284. https://doi.org/10.1007/978-3-319-23344-4_27 |
| [9] |
S. Wang, Y. Qian, K. Wei, W. Kong, Identifying biomarkers of Alzheimer's disease via a novel structured sparse canonical correlation analysis approach, J. Mol. Neurosci., 72 (2022), 323–335. https://doi.org/10.1007/s12031-021-01915-6 doi: 10.1007/s12031-021-01915-6
|
| [10] | W. Hu, D. Lin, V. D. Calhoun, Y. P. Wang, Integration of SNPs-FMRI-methylation data with sparse multi-CCA for schizophrenia study, in 2016 38th Annual International Conference of the IEEE Engineering in Medicine and Biology Society (EMBC), 2016 (2016), 3310–3313. https://doi.org/10.1109/EMBC.2016.7591436 |
| [11] |
S. Wang, X. Wu, K. Wei, W. Kong, An improved fusion paired group lasso structured sparse canonical correlation analysis based on brain imaging genetics to identify biomarkers of Alzheimer's disease, Front. Aging Neurosci., 13 (2022), 817520. https://doi.org/10.3389/fnagi.2021.817520 doi: 10.3389/fnagi.2021.817520
|
| [12] |
M. Kim, J. H. Won, J. Youn, H. Park, Joint-connectivity-based sparse canonical correlation analysis of imaging genetics for detecting biomarkers of Parkinson's disease, IEEE Trans. Med. Imaging, 39 (2020), 23–34. https://doi.org/10.1109/TMI.2019.2918839 doi: 10.1109/TMI.2019.2918839
|
| [13] |
L. Du, K. Liu, X. Yao, S. L. Risacher, J. Han, A. J. Saykin, et al., Detecting genetic associations with brain imaging phenotypes in Alzheimer's disease via a novel structured SCCA approach, Med. Image Anal., 61 (2020), 101656. https://doi.org/10.1016/j.media.2020.101656 doi: 10.1016/j.media.2020.101656
|
| [14] |
L. Grosenick, B. Klingenberg, K. Katovich, B. Knutson, J. E. Taylor, Interpretable whole-brain prediction analysis with GraphNet, NeuroImage, 72 (2013), 304–321. https://doi.org/10.1016/j.neuroimage.2012.12.062 doi: 10.1016/j.neuroimage.2012.12.062
|
| [15] |
M. W. Weiner, D. P. Veitch, Introduction to special issue: Overview of Alzheimer's disease neuroimaging initiative, Alzheimer's Dementia, 11 (2015), 730–733. https://doi.org/10.1016/j.jalz.2015.05.007 doi: 10.1016/j.jalz.2015.05.007
|
| [16] |
K. Wei, W. Kong, S. Wang, An improved multi-task sparse canonical correlation analysis of imaging genetics for detecting biomarkers of Alzheimer's disease, IEEE Access, 99 (2021), 30528–30538. https://doi.org/10.1109/ACCESS.2021.3059520 doi: 10.1109/ACCESS.2021.3059520
|
| [17] |
J. Gorski, F. Pfeuffer, K. Klamroth, Biconvex sets and optimization with biconvex functions: a survey and extensions, Math. Methods Oper. Res., 66 (2007), 373–407. https://doi.org/10.1007/s00186-007-0161-1 doi: 10.1007/s00186-007-0161-1
|
| [18] |
A. J. Saykin, L. Shen, T. M. Foroud, S. G. Potkin, S. Swaminathan, S. Kim, et al., Alzheimer's disease neuroimaging initiative, Alzheimer's disease neuroimaging initiative biomarkers as quantitative phenotypes: Genetics core aims, progress, and plans, Alzheimer's Dementia, 6 (2010), 265–273. https://doi.org/10.1016/j.jalz.2010.03.013 doi: 10.1016/j.jalz.2010.03.013
|
| [19] |
Y. Jung, J. Hu, A K-fold averaging cross-validation procedure, J. Nonparam. Stat., 27 (2015), 167–179. https://doi.org/10.1080/10485252.2015.1010532 doi: 10.1080/10485252.2015.1010532
|
| [20] |
X. Chen, H. Liu, An effiffifficient optimization algorithm for structured sparse CCA, with applications to eQTL mapping, Stat. Biosci., 4 (2011), 3–26. https://doi.org/10.1007/s12561-011-9048-z doi: 10.1007/s12561-011-9048-z
|
| [21] |
X. Hao, C. Li, L. Du, X. Yao, J. Yan, S. L. Risacher, et al., Mining outcome-relevant brain imaging genetic associations via three-way sparse canonical correlation analysis in Alzheimer's disease, Sci. Rep., 7 (2017), 44272. https://doi.org/10.1038/srep44272 doi: 10.1038/srep44272
|
| [22] |
T. Kuhn, S. Becerra, J. Duncan, N. Spivak, B. H. Dang, B. Habelhah, et al., Translating state-of-the-art brain magnetic resonance imaging (MRI) techniques into clinical practice: multimodal MRI differentiates dementia subtypes in a traditional clinical setting, Quant. Imaging Med. Surg., 11 (2021), 4056–4073. https://doi.org/10.21037/qims-20-1355 doi: 10.21037/qims-20-1355
|
| [23] |
Q. Y. Dong, T. R. Li, X. Y. Jiang, X. N. Wang, Y. Han, J. H. Jiang, Glucose metabolism in the right middle temporal gyrus could be a potential biomarker for subjective cognitive decline: a study of a Han population, Alzheimer's Res. Ther., 13 (2021), 74. https://doi.org/10.1186/s13195-021-00811-w doi: 10.1186/s13195-021-00811-w
|
| [24] |
F. Blanc, V. Noblet, N. Philippi, B. Cretin, J. Foucher, J. P. Armspach, et al., Right anterior insula: core region of hallucinations in cognitive neurodegenerative diseases, PLoS One, 9 (2014), e114774. https://doi.org/10.1371/journal.pone.0114774 doi: 10.1371/journal.pone.0114774
|
| [25] |
K. Trimmel, A. L. van Graan, L. Caciagli, A. Haag, M. J. Koepp, P. J. Thompson, et al., Left temporal lobe language network connectivity in temporal lobe epilepsy, Brain, 141 (2018), 2406–2418. https://doi.org/10.1093/brain/awy164 doi: 10.1093/brain/awy164
|
| [26] |
T. Onitsuka, M. E. Shenton, D. F. Salisbury, C. C. Dickey, K. Kasai, S. K. Toner, et al., Middle and inferior temporal gyrus gray matter volume abnormalities in chronic schizophrenia: an MRI study, Am. J. Psychiatry, 161 (2004), 1603–1611. https://doi.org/10.1176/appi.ajp.161.9.1603 doi: 10.1176/appi.ajp.161.9.1603
|
| [27] |
I. Leshchyns'ka, V. Sytnyk, Synaptic cell adhesion molecules in Alzheimer's disease, Neural Plast., 2016 (2016), 6427537. https://doi.org/10.1155/2016/6427537 doi: 10.1155/2016/6427537
|
| [28] |
A. Iatrou, E. M. Clark, Y. Wang, Nuclear dynamics and stress responses in Alzheimer's disease, Mol. Neurodegener., 16 (2021), 65. https://doi.org/10.1186/s13024-021-00489-6 doi: 10.1186/s13024-021-00489-6
|
| [29] |
H. Läubli, L. Borsig, Altered cell adhesion and glycosylation promote cancer immune suppression and metastasis, Front. Immunol., 10 (2019), 2120. https://doi.org/10.3389/fimmu.2019.02120 doi: 10.3389/fimmu.2019.02120
|
| [30] |
M. Tournissac, M. Leclerc, J. Valentin-Escalera, M. Vandal, C. R. Bosoi, E. Planel, et al., Metabolic determinants of Alzheimer's disease: A focus on thermoregulation, Ageing Res. Rev., 72 (2021), 101462. https://doi.org/10.1016/j.arr.2021.101462 doi: 10.1016/j.arr.2021.101462
|
| [31] |
W. Reith, Neurodegenerative diseases, Radiologist, 58 (2018), 241–258. https://doi.org/10.1007/s00117-018-0363-y doi: 10.1007/s00117-018-0363-y
|
| [32] |
J. Nettiksimmons, G. Tranah, D. S. Evans, J. S. Yokoyama, K. Yaffe, Gene-based aggregate SNP associations between candidate AD genes and cognitive decline, AGE, 38 (2016), 41. https://doi.org/10.1007/s11357-016-9885-2 doi: 10.1007/s11357-016-9885-2
|
| [33] |
Y. Fu, J. H. Hsiao, G. Paxinos, G. M. Halliday, W. S. Kim, ABCA7 mediates phagocytic clearance of amyloid-β in the brain, J. Alzheimer's Dis., 54 (2016), 569–84. https://doi.org/10.3233/JAD-160456 doi: 10.3233/JAD-160456
|
| [34] |
X. Z. Yuan, S. Sun, C. C. Tan, J. T. Yu, L. Tan, The role of ADAM10 in Alzheimer's disease, J. Alzheimer's Dis., 58 (2017), 303–322. https://doi.org/10.3233/JAD-170061 doi: 10.3233/JAD-170061
|
| [35] |
W. Xu, F. Fang, J. Ding, C. Wu, Dysregulation of Rab5-mediated endocytic pathways in Alzheimer's disease, Traffic, 19 (2018), 253–262. https://doi.org/10.1111/tra.12547 doi: 10.1111/tra.12547
|
| [36] |
J. H. Kim, Genetics of Alzheimer's disease, Dementia Neurocognitive Disord., 17 (2018), 131–136. https://doi.org/10.12779/dnd.2018.17.4.131 doi: 10.12779/dnd.2018.17.4.131
|


Figures(9) / Tables(8)
Shuaiqun Wang, Huiqiu Chen, Wei Kong, Xinqi Wu, Yafei Qian, Kai Wei. A modified FGL sparse canonical correlation analysis for the identification of Alzheimer's disease biomarkers[J]. Electronic Research Archive, 2023, 31(2): 882-903. doi: 10.3934/era.2023044


 DownLoad: