Thin-walled structures have been widely used in various parts of vehicle subsystems because of their high-efficiency impact energy absorption and lightweight characteristics. However, the impact deformation mode of conventional thin-walled structures is unstable and the energy absorption efficiency is low. Therefore, a series of novel bionic conch structures (BCS) are proposed to find a more excellent crashworthiness design in this study. First, the finite element simulation model of BCS verified by experiments is established. Then, the energy absorption characteristics of bionic conch structures, and conventional single-cell and multi-cell tubes under axial loading are compared by employing finite element simulation. The results show that the thin-walled structures inspired by conchs have a higher energy absorption efficiency than the other two structures with the same mass. In addition, the influence of main design parameters (wall thickness, inner and outer ring diameter, and the number of inner and outer panels) on the crashworthiness of BCS is studied through parameter design and factor significance analysis. Finally, the optimal geometric configuration is found by combining the approximation model and multi-objective particle swarm optimization, and the crashworthiness of BCS is further optimized. The bionic crashworthiness design and optimization framework proposed in this study can also provide a reference for other engineering protective structures.
Citation: Xiaoyan Song, Lianfeng Lai, Shungen Xiao, Yaohong Tang, Mengmeng Song, Jie Zhang, Yong Zhang. Bionic design and multi-objective optimization of thin-walled structures inspired by conchs[J]. Electronic Research Archive, 2023, 31(2): 575-598. doi: 10.3934/era.2023028
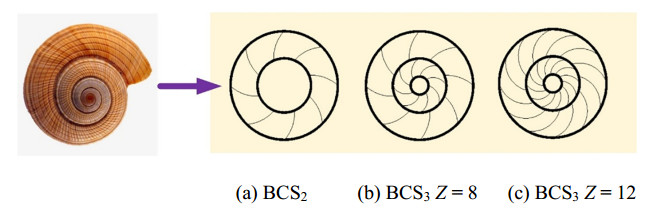
Thin-walled structures have been widely used in various parts of vehicle subsystems because of their high-efficiency impact energy absorption and lightweight characteristics. However, the impact deformation mode of conventional thin-walled structures is unstable and the energy absorption efficiency is low. Therefore, a series of novel bionic conch structures (BCS) are proposed to find a more excellent crashworthiness design in this study. First, the finite element simulation model of BCS verified by experiments is established. Then, the energy absorption characteristics of bionic conch structures, and conventional single-cell and multi-cell tubes under axial loading are compared by employing finite element simulation. The results show that the thin-walled structures inspired by conchs have a higher energy absorption efficiency than the other two structures with the same mass. In addition, the influence of main design parameters (wall thickness, inner and outer ring diameter, and the number of inner and outer panels) on the crashworthiness of BCS is studied through parameter design and factor significance analysis. Finally, the optimal geometric configuration is found by combining the approximation model and multi-objective particle swarm optimization, and the crashworthiness of BCS is further optimized. The bionic crashworthiness design and optimization framework proposed in this study can also provide a reference for other engineering protective structures.

| [1] |
T. Wierzbicki, W. Abramowicz, On the crushing mechanics of Thin-Walled structures, J. Appl. Mech., 50 (1983), 727–734. DOI: 10.1115/1.3167137 doi: 10.1115/1.3167137

|
| [2] |
M. Krolak, K. Kowal-Michalska, R. Mania, J. Swiniarski, Experimental tests of stability and load carrying capacity of compressed thin-walled multi-cell columns of triangular cross-section, Thin-Walled Struct., 45 (2007), 883–887. DOI: 10.1016/j.tws.2007.08.041 doi: 10.1016/j.tws.2007.08.041
|
| [3] |
M. Langseth, O. S. Hopperstad, A. G. Hanssen, Crash behaviour of thin-walled aluminium members, Thin-Walled Struct., 32 (1998), 127–150. DOI: 10.1016/S0263-8231(98)00030-5 doi: 10.1016/S0263-8231(98)00030-5
|
| [4] |
Y. Xiang, Q. Wang, Z. Fan, H. Fang, Optimal crashworthiness design of a spot-welded thin-walled hat section, Finite Elem. Anal. Des., 42 (2006), 846–855. DOI: 10.1016/j.finel.2006.01.001 doi: 10.1016/j.finel.2006.01.001
|
| [5] |
D. Kenyon, Y. Shu, X. Fan, S. Reddy, G. Dong, A. J. Lew, Parametric design of multi-cell thin-walled structures for improved crashworthiness with stable progressive buckling mode, Thin-Walled Struct., 131 (2018), 76–87. DOI: 10.1016/j.tws.2018.06.031 doi: 10.1016/j.tws.2018.06.031
|
| [6] |
A. A. Nia, J. H. Hamedani, Comparative analysis of energy absorption and deformations of thin-walled tubes with various section geometries, Thin-Walled Struct., 48 (2010), 946–954. DOI: 10.1016/j.tws.2010.07.003 doi: 10.1016/j.tws.2010.07.003
|
| [7] |
Z. Tang, S. Liu, Z. Zhang, Analysis of energy absorption characteristics of cylindrical multi-cell columns, Thin-Walled Struct., 62 (2013), 75–84. DOI: 10.1016/j.tws.2012.05.019 doi: 10.1016/j.tws.2012.05.019
|
| [8] |
B. Jafarian, M. J. Rezvani, An experimental investigation on energy absorption of thin-walled bitubal structures by inversion and axial collapse, Int. J. Mech. Sci., 126 (2017), 270–280. DOI: 10.1016/j.ijmecsci.2017.03.005 doi: 10.1016/j.ijmecsci.2017.03.005
|
| [9] |
H. Chen, Y. Zhang, J. Lin, F. Zhang, Y. Wang, X. Yan, Crushing responses and optimization of novel sandwich columns, Compos. Struct., 263 (2021), 113682. DOI: 10.1016/j.compstruct.2021.113682 doi: 10.1016/j.compstruct.2021.113682
|
| [10] |
Y. Hou, Y. Zhang, X. Yan, X. Lai, J. Lin, Crushing behaviors of the thin-walled sandwich column under axial load, Thin-Walled Struct., 159 (2021), 107229. DOI: 10.1016/j.tws.2020.107229 doi: 10.1016/j.tws.2020.107229
|
| [11] |
J. Li, Y. Zhang, Y. Kang, F. Zhang, Characterization of energy absorption for side hierarchical structures under axial and oblique loading conditions, Thin-Walled Struct., 165 (2021), 107999. DOI: 10.1016/j.tws.2021.107999 doi: 10.1016/j.tws.2021.107999
|
| [12] |
N. Qiu, Y. Gao, J. Fang, Z. Feng, G. Sun, Q. Li, Crashworthiness analysis and design of multi-cell hexagonal columns under multiple loading cases, Finite Elem. Anal. Des., 104 (2015), 89–101. DOI: 10.1016/j.finel.2015.06.004 doi: 10.1016/j.finel.2015.06.004
|
| [13] |
Y. Zhang, N. He, X. Song, T. Chen, H. Chen, On impacting mechanical behaviors of side fractal structures, Thin-Walled Struct., 146 (2020), 106490. DOI: 10.1016/j.tws.2019.106490 doi: 10.1016/j.tws.2019.106490
|
| [14] |
S. Wang, Y. Peng, T. Wang, Q. Che, P. Xu, Collision performance and multi-objective robust optimization of a combined multi-cell thin-walled structure for high speed train, Thin-Walled Struct., 135 (2019), 341–355. DOI: 10.1016/j.tws.2018.10.044 doi: 10.1016/j.tws.2018.10.044
|
| [15] |
N. Qiu, Y. Gao, J. Fang, Z. Feng, G. Sun, Q. Li, Theoretical prediction and optimization of multi-cell hexagonal tubes under axial crashing, Thin-Walled Struct., 102 (2016), 111–121. DOI: 10.1016/j.tws.2016.01.023 doi: 10.1016/j.tws.2016.01.023
|
| [16] |
X. Zhang, G. Cheng, H. Zhang, Theoretical prediction and numerical simulation of multi-cell square thin-walled structures, Thin-Walled Struct., 44 (2006), 1185–1191. DOI: 10.1016/j.tws.2006.09.002 doi: 10.1016/j.tws.2006.09.002
|
| [17] |
A. Jusuf, T. Dirgantara, L. Gunawan, I. S. Putra, Crashworthiness analysis of multi-cell prismatic structures, Int. J. Impact Eng., 78 (2015), 34–50. DOI: 10.1016/j.ijimpeng.2014.11.011 doi: 10.1016/j.ijimpeng.2014.11.011
|
| [18] |
W. Chen, T. Wierzbicki, Relative merits of single-cell, multi-cell and foam-filled thin-walled structures in energy absorption, Thin-Walled Struct., 39 (2001), 287–306. DOI: 10.1016/S0263-8231(01)00006-4 doi: 10.1016/S0263-8231(01)00006-4
|
| [19] |
A. A. Nia, M. Parsapour, An investigation on the energy absorption characteristics of multi-cell square tubes, Thin-Walled Struct., 68 (2013), 26–34. DOI: 10.1016/j.tws.2013.01.010 doi: 10.1016/j.tws.2013.01.010
|
| [20] |
B. C. Chen, M. Zou, G. M. Liu, J. F. Song, H. X. Wang, Experimental study on energy absorption of bionic tubes inspired by bamboo structures under axial crushing, Int. J. Impact Eng., 115 (2018), 48–57. DOI: 10.1016/j.ijimpeng.2018.01.005 doi: 10.1016/j.ijimpeng.2018.01.005
|
| [21] |
M. Zou, S. Xu, C. Wei, H. Wang, Z. Liu, A bionic method for the crashworthiness design of thin-walled structures inspired by bamboo, Thin-Walled Struct., 101 (2016), 222–230. DOI: 10.1016/j.tws.2015.12.023 doi: 10.1016/j.tws.2015.12.023
|
| [22] |
J. F. Song, S. C. Xu, H. X. Wang, X. Q. Wu, M. Zou, Bionic design and multi-objective optimization for variable wall thickness tube inspired bamboo structures, Thin-Walled Struct., 125 (2018), 76–88. DOI: 10.1016/j.tws.2018.01.010 doi: 10.1016/j.tws.2018.01.010
|
| [23] |
J. Fu, Q. Liu, K. Liufu, Y. Deng, J. Fang, Q. Li, Design of bionic-bamboo thin-walled structures for energy absorption, Thin-Walled Struct., 135 (2019), 400–413. DOI: 10.1016/j.tws.2018.10.003 doi: 10.1016/j.tws.2018.10.003
|
| [24] |
P. N. Panirani, J. Ghanbari, Design and optimization of bio-inspired thin-walled structures for energy absorption applications, Int. J. Crashworthiness, 2022 (2022), 1–12. DOI: 10.1080/13588265.2022.2038944 doi: 10.1080/13588265.2022.2038944
|
| [25] |
M. Zou, J. Song, S. Xu, S. Liu, Z. Chang, J. Merodio, Bionic design of the bumper beam inspired by the bending and energy absorption characteristics of bamboo, Appl. Bionics Biomech., 2018 (2018), 8062321. DOI: 10.1155/2018/8062321 doi: 10.1155/2018/8062321
|
| [26] |
J. Xiang, J. Du, D. Li, F. Scarpa, Numerical analysis of the impact resistance in aluminum alloy bi-tubular thin-walled structures designs inspired by beetle elytra, J. Mater. Sci., 52 (2017), 13247–13260. DOI: 10.1007/s10853-017-1420-z doi: 10.1007/s10853-017-1420-z
|
| [27] |
X. Yu, L. Pan, J. Chen, X. Zhang, P. Wei, Experimental and numerical study on the energy absorption abilities of trabecular–honeycomb biomimetic structures inspired by beetle elytra, J. Mater. Sci., 54 (2019), 2193–2204. DOI: 10.1007/s10853-018-2958-0 doi: 10.1007/s10853-018-2958-0
|
| [28] |
X. Deng, L. Cao, Crushing analysis and crashworthiness optimisation for a novel bioinspired multicell filled tubular structure, Int. J. Crashworthiness, 27 (2022), 414–429. DOI: 10.1080/13588265.2020.1807688 doi: 10.1080/13588265.2020.1807688
|
| [29] |
K. L. Johnson, M. W. Trim, D. K. Francis, W. R. Whittington, J. A. Miller, C. E. Bennett, et al., Moisture, anisotropy, stress state, and strain rate effects on bighorn sheep horn keratin mechanical properties, Acta Biomater., 48 (2017), 300–308. DOI: 10.1016/j.actbio.2016.10.033 doi: 10.1016/j.actbio.2016.10.033
|
| [30] |
W. Huang, A. Zaheri, J. Jung, H. D. Espinosa, J. Mckittrick, Hierarchical structure and compressive deformation mechanisms of bighorn sheep (Ovis canadensis) horn, Acta Biomater., 64 (2017), 1–14. DOI: 10.1016/j.actbio.2017.09.043 doi: 10.1016/j.actbio.2017.09.043
|
| [31] |
S. Liu, S. Xu, J. Song, J. Zhou, L. Xu, X. Li, et al., Mechanical properties and failure deformation mechanisms of yak horn under quasi-static compression and dynamic impact, J. Mech. Behav. Biomed. Mater., 107 (2020), 103753. DOI: 10.1016/j.jmbbm.2020.103753 doi: 10.1016/j.jmbbm.2020.103753
|
| [32] |
Z. Wang, J. Zhang, Z. Li, C. Shi, On the crashworthiness of bio-inspired hexagonal prismatic tubes under axial compression, Int. J. Mech. Sci., 186 (2020), 105893. DOI: 10.1016/j.ijmecsci.2020.105893 doi: 10.1016/j.ijmecsci.2020.105893
|
| [33] |
B. Jiang, W. Tan, X. Bu, L. Zhang, C. Zhou, C. C. Chou, et al., Numerical, theoretical, and experimental studies on the energy absorption of the thin-walled structures with bio-inspired constituent element, Int. J. Mech. Sci., 164 (2019), 105173. DOI: 10.1016/j.ijmecsci.2019.105173 doi: 10.1016/j.ijmecsci.2019.105173
|
| [34] |
Y. Zhang, J. Wang, C. Wang, Y. Zeng, T. Chen, Crashworthiness of bionic fractal hierarchical structures, Mater. Des., 158 (2018), 147–159. DOI: 10.1016/j.matdes.2018.08.028 doi: 10.1016/j.matdes.2018.08.028
|
| [35] |
L. Zhang, Z. Bai, F. Bai, Crashworthiness design for bio-inspired multi-cell tubes with quadrilateral, hexagonal and octagonal sections, Thin-Walled Struct., 122 (2018), 42–51. DOI: 10.1016/j.tws.2017.10.010 doi: 10.1016/j.tws.2017.10.010
|
| [36] |
J. Wang, Y. Zhang, N. He, C. H. Wang, Crashworthiness behavior of Koch fractal structures, Mater. Des., 144 (2018), 229–244. DOI: 10.1016/j.matdes.2018.02.035 doi: 10.1016/j.matdes.2018.02.035
|
| [37] |
Y. Zhang, X. Xu, J. Fang, W. Huang, J. Wang, Load characteristics of triangular honeycomb structures with self-similar hierarchical features, Eng. Struct., 257 (2022), 114114. DOI: 10.1016/j.engstruct.2022.114114 doi: 10.1016/j.engstruct.2022.114114
|
| [38] |
X. Xu, Y. Zhang, X. Wang, J. Fang, J. Chen, J. Li, Searching superior crashworthiness performance by constructing variable thickness honeycombs with biomimetic cells, Int. J. Mech. Sci., 235 (2022), 107718. DOI: 10.1016/j.ijmecsci.2022.107718 doi: 10.1016/j.ijmecsci.2022.107718
|
| [39] |
M. Mudassir, F. Tarlochan, M. A. Mansour, Nature-Inspired cellular structure design for electric vehicle battery compartment: application to crashworthiness, Appl. Sci., 10 (2020), 4532. DOI: 10.3390/app10134532 doi: 10.3390/app10134532
|
| [40] |
X. Xu, Y. Zhang, J. Wang, F. Jiang, C. H. Wang, Crashworthiness design of novel hierarchical hexagonal columns, Compos. Struct., 194 (2018), 36–48. DOI: 10.1016/j.compstruct.2018.03.099 doi: 10.1016/j.compstruct.2018.03.099
|
| [41] |
Y. Zhang, X. Xu, J. Wang, T. Chen, C. H. Wang, Crushing analysis for novel bio-inspired hierarchical circular structures subjected to axial load, Int. J. Mech. Sci., 140 (2018), 407–431. DOI: 10.1016/j.ijmecsci.2018.03.015 doi: 10.1016/j.ijmecsci.2018.03.015
|
| [42] |
H. Yin, X. Wang, G. Wen, C. Zhang, W. Zhang, Crashworthiness optimization of bio-inspired hierarchical honeycomb under axial loading, Int. J. Crashworthiness, 26 (2021), 26–37. DOI: 10.1080/13588265.2019.1650695 doi: 10.1080/13588265.2019.1650695
|
| [43] |
Z. Wang, Z. Li, C. Shi, W. Zhou, Mechanical performance of vertex-based hierarchical vs square thin-walled multi-cell structure, Thin-Walled Struct., 134 (2019), 102–110. DOI: 10.1016/j.tws.2018.09.017 doi: 10.1016/j.tws.2018.09.017
|
| [44] |
D. Zhang, Q. Fei, D. Jiang, Y. Li, Numerical and analytical investigation on crushing of fractal-like honeycombs with self-similar hierarchy, Compos. Struct., 192 (2018), 289–299. DOI: 10.1016/j.compstruct.2018.02.082 doi: 10.1016/j.compstruct.2018.02.082
|
| [45] |
G. Zheng, S. Wu, G. Sun, G. Li, Q. Li, Crushing analysis of foam-filled single and bitubal polygonal thin-walled tubes, Int. J. Mech. Sci., 87 (2014), 226–240. DOI: 10.1016/j.ijmecsci.2014.06.002 doi: 10.1016/j.ijmecsci.2014.06.002
|
| [46] |
T. Chen, Y. Zhang, J. Lin, Y. Lu, Theoretical analysis and crashworthiness optimization of hybrid multi-cell structures, Thin-Walled Struct., 142 (2019), 116–131. DOI: 10.1016/j.tws.2019.05.002 doi: 10.1016/j.tws.2019.05.002
|
| [47] |
S. Xie, W. Yang, N. Wang, H. Li, Crashworthiness analysis of multi-cell square tubes under axial loads, Int. J. Mech. Sci., 121 (2017), 106–118. DOI: 10.1016/j.ijmecsci.2016.12.005 doi: 10.1016/j.ijmecsci.2016.12.005
|
| [48] |
H. Fang, M. Rais-Rohani, Z. Liu, M. F. Horstemeyer, A comparative study of metamodeling methods for multiobjective crashworthiness optimization, Comput. Struct., 83 (2005), 2121–2136. DOI: 10.1016/j.compstruc.2005.02.025 doi: 10.1016/j.compstruc.2005.02.025
|
| [49] |
J. Fang, Y. Gao, G. Sun, C. Xu, Y. Zhang, Q. Li, Optimization of Spot-Welded joints combined artificial bee colony algorithm with sequential kriging optimization, Adv. Mech. Eng., 6 (2014), 573694. DOI: 10.1155/2014/573694 doi: 10.1155/2014/573694
|


Figures(18) / Tables(12)
Xiaoyan Song, Lianfeng Lai, Shungen Xiao, Yaohong Tang, Mengmeng Song, Jie Zhang, Yong Zhang. Bionic design and multi-objective optimization of thin-walled structures inspired by conchs[J]. Electronic Research Archive, 2023, 31(2): 575-598. doi: 10.3934/era.2023028


 DownLoad: