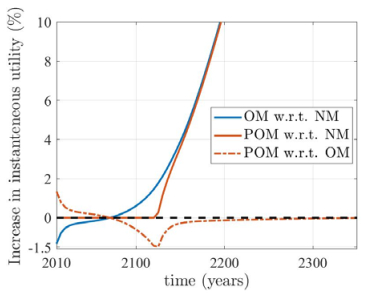
Short-term reductions in social welfare, expected to be caused by a currently imposed carbon tax, are among the obstacles to a rapid transition to a low-carbon economy. Using an extended DICE model, we studied the potential of green bonds to both accelerate this transition and smoothen welfare losses and gains in a socially optimal way. We showed that green bonds can indeed accelerate the transition to a low-carbon economy and that lower interest rates on bonds speed up this acceleration. Moreover, bonds can reduce short-term welfare losses; however, to eliminate welfare losses, additional compensation mechanisms are needed. For example, bonds at a 3% interest rate can decrease the peak atmospheric carbon concentrations by about 20% and shorten the initial time, during which society is worse off from 75 to 45 years. Retaining at least the same consumption level as in the no-mitigation scenario, without using bonds, is possible only through a decrease in abatement efforts. Green bonds of sufficiently low interest rates allow improving intertemporal welfare as well as achieving a more pronounced climate change mitigation with respect to both mitigation and no-mitigation scenarios without bonds.
Citation: Sergey Orlov, Elena Rovenskaya, Julia Puaschunder, Willi Semmler. Green bonds, transition to a low-carbon economy, and intertemporal welfare allocation: Evidence from an extended DICE model[J]. AIMS Environmental Science, 2024, 11(4): 628-648. doi: 10.3934/environsci.2024031
Short-term reductions in social welfare, expected to be caused by a currently imposed carbon tax, are among the obstacles to a rapid transition to a low-carbon economy. Using an extended DICE model, we studied the potential of green bonds to both accelerate this transition and smoothen welfare losses and gains in a socially optimal way. We showed that green bonds can indeed accelerate the transition to a low-carbon economy and that lower interest rates on bonds speed up this acceleration. Moreover, bonds can reduce short-term welfare losses; however, to eliminate welfare losses, additional compensation mechanisms are needed. For example, bonds at a 3% interest rate can decrease the peak atmospheric carbon concentrations by about 20% and shorten the initial time, during which society is worse off from 75 to 45 years. Retaining at least the same consumption level as in the no-mitigation scenario, without using bonds, is possible only through a decrease in abatement efforts. Green bonds of sufficiently low interest rates allow improving intertemporal welfare as well as achieving a more pronounced climate change mitigation with respect to both mitigation and no-mitigation scenarios without bonds.

| [1] | High-Level Commission on Carbon Prices (2017) Report of the High-Level Commission on Carbon Prices, Washington, DC: World Bank. |
| [2] |
Stern N (2008) The Economics of Climate Change. Am Econ Rev 98: 1–37. https://doi.org/10.1257/aer.98.2.1 doi: 10.1257/aer.98.2.1

|
| [3] |
Baranzini A, Goldemberg J, Speck S (2000) A future for carbon taxes. Ecol Econ 32: 395–412. https://doi.org/10.1016/S0921-8009(99)00122-6 doi: 10.1016/S0921-8009(99)00122-6
|
| [4] | Poterba JM (1991) Tax Policy to Combat Global Warming: On Designing a Carbon Tax, National Bureau of Economic Research. https://doi.org/10.3386/w3649 |
| [5] |
Tiezzi S (2005) The welfare effects and the distributive impact of carbon taxation on Italian households. Energ Policy 33: 1597–1612. https://doi.org/10.1016/j.enpol.2004.01.016 doi: 10.1016/j.enpol.2004.01.016
|
| [6] |
Khastar M, Aslani A, Nejati M (2020) How does carbon tax affect social welfare and emission reduction in Finland? Energy Rep 6: 736–744. https://doi.org/10.1016/j.egyr.2020.03.001 doi: 10.1016/j.egyr.2020.03.001
|
| [7] | Mengden A (2023) Tax Foundation, Carbon Taxes in Europe, 2023. Available from: https://taxfoundation.org/data/all/eu/carbon-taxes-in-europe-2023/. |
| [8] | Kumar M (2024) India plans to protest EU's carbon tax at WTO meeting - sources. Reuters. |
| [9] | Semmler W, Braga JP, Lichtenberger A, et al. (2021) Fiscal Policies for a Low-Carbon Economy. World Bank Report. https://doi.org/10.1596/35795 |
| [10] | Kimble JJ (2006) Mobilizing the Home Front: War Bonds and Domestic Propaganda, Texas A & M University Press. |
| [11] | OECD (2017) Mobilising Bond Markets for a Low-Carbon Transition. |
| [12] | Climate Awareness Bonds (CAB) EIB.org. Available from: https://www.eib.org/en/investor-relations/cab/index.htm. |
| [13] | Climate bonds market data Climate Bonds Initiative. Available from: https://www.climatebonds.net/market/data. |
| [14] | Heine D, Semmler W, Mazzucato M, et al. (2019) Financing Low-Carbon Transitions through Carbon Pricing and Green Bonds, The World Bank. https://doi.org/10.1596/1813-9450-8991 |
| [15] | Financing Climate Futures (2018) OECD, 2018. Available from: https://www.oecd.org/en/publications/2018/11/financing-climate-futures_g1g99369.html. |
| [16] |
Deschryver P, de Mariz F (2020) What Future for the Green Bond Market? How Can Policymakers, Companies, and Investors Unlock the Potential of the Green Bond Market? J Risk Financ Manag 13: 61. https://doi.org/10.3390/jrfm13030061 doi: 10.3390/jrfm13030061
|
| [17] | Nordhaus W (2008) A Question of Balance: Weighing the Options on Global Warming Policies, Yale University Press. https://doi.org/10.2307/j.ctt1npzkh |
| [18] |
Nordhaus WD (2017) Revisiting the social cost of carbon. Proc Natl Acad Sci U S A 114: 1518–1523. https://doi.org/10.1073/pnas.1609244114 doi: 10.1073/pnas.1609244114
|
| [19] | Nordhaus WD (2017) Evolution of Assessments of the Economics of Global Warming: Changes in the DICE model, 1992 – 2017, National Bureau of Economic Research. https://doi.org/10.3386/w23319 |
| [20] | Nordhaus W, Sztorc P (2013) DICE 2013R: Introduction and User's Manual, New Haven, CT, Cowles Found. |
| [21] | Government Accountability Office (2014) Regulatory Impact Analysis: Development of Social Cost of Carbon Estimates, DC, GAO. |
| [22] | Metcalf G, Stock J (2015) The Role of Integrated Assessment Models in Climate Policy: A User's Guide and Assessment. Harvard Project on Climate Agreements, Belfer Center. |
| [23] |
Nordhaus W (2014) Estimates of the Social Cost of Carbon: Concepts and Results from the DICE-2013R Model and Alternative Approaches. J Assoc Environ Reso 1: 273–312. https://doi.org/10.1086/676035 doi: 10.1086/676035
|
| [24] |
Braun P, Faulwasser T, Grüne L, et al. (2024) On the social cost of carbon and discounting in the DICE model. AIMSES 11: 471–495. https://doi.org/10.3934/environsci.2024024 doi: 10.3934/environsci.2024024
|
| [25] |
Jin G, Shi X, Zhang L, et al. (2020) Measuring the SCCs of different Chinese regions under future scenarios. Renew Sust Energ Rev 130: 109949. https://doi.org/10.1016/j.rser.2020.109949 doi: 10.1016/j.rser.2020.109949
|
| [26] |
Rezai A (2010) Recast the DICE and its policy recommendations. Macroecon Dyn 14: 275–289. https://doi.org/10.1017/S1365100510000428 doi: 10.1017/S1365100510000428
|
| [27] |
Howarth RB (1998) An Overlapping Generations Model of Climate-Economy Interactions. Scand J Econ 100: 575–591. https://doi.org/10.1111/1467-9442.00123 doi: 10.1111/1467-9442.00123
|
| [28] | Howarth RB (2001) Climate rights and economic modeling, In: C. Hall D, B. Horwarth R (Eds.), The Long-Term Economics of Climate Change: Beyond a Doubling of Greenhouse Gas Concentrations, Emerald Group Publishing Limited, 315–336. https://doi.org/10.1016/S1569-3740(01)03025-5 |
| [29] |
Bovenberg AL, Heijdra BJ (1998) Environmental tax policy and intergenerational distribution. J Public Econ 67: 1–24. https://doi.org/10.1016/S0047-2727(97)00064-9 doi: 10.1016/S0047-2727(97)00064-9
|
| [30] | Sachs JD (2015) Climate Change and Intergenerational Well-Being, In: Bernard L, Semmler W (Eds.), The Oxford Handbook of the Macroeconomics of Global Warming, Oxford University Press. |
| [31] | Andersen TM, Bhattacharya J, Liu P (2020) Resolving intergenerational conflict over the environment under the Pareto criterion. J Environ Econ Manag 100. https://doi.org/10.1016/j.jeem.2019.102290 |
| [32] |
Kotlikoff L, Kubler F, Polbin A, et al. (2021) Making Carbon Taxation a Generational Win Win. Int Econ Rev 62: 3–46. https://doi.org/10.1111/iere.12483 doi: 10.1111/iere.12483
|
| [33] | Green Taxation - European Commission Available from: https://taxation-customs.ec.europa.eu/green-taxation-0_en. |
| [34] | Blanchard OJ, Fischer S (1989) Lectures on Macroeconomics, MIT Press. |
| [35] |
Nishimura K, Nourry C, Seegmuller T, et al. (2015) On the (de)stabilizing effect of public debt in a Ramsey model with heterogeneous agents. Int Jnl of Econ Theory 11: 7–24. https://doi.org/10.1111/ijet.12049 doi: 10.1111/ijet.12049
|
| [36] |
Bohn H (1998) The Behavior of U. S. Public Debt and Deficits. Q J Econ 113: 949–963. https://doi.org/10.1162/003355398555793 doi: 10.1162/003355398555793
|
| [37] |
Pitafi BA, Roumasset JA (2009) Pareto-Improving Water Management over Space and Time: The Honolulu Case. Am J Agr Econ 91: 138–153. https://doi.org/10.1111/j.1467-8276.2008.01186.x doi: 10.1111/j.1467-8276.2008.01186.x
|
| [38] |
Kellett CM, Weller SR, Faulwasser T, et al. (2019) Feedback, dynamics, and optimal control in climate economics. Annu Rev Control 47: 7–20. https://doi.org/10.1016/j.arcontrol.2019.04.003 doi: 10.1016/j.arcontrol.2019.04.003
|
| [39] | Apple raises €2bn in green bonds Available from: https://www.ft.com/content/918c648c-01ae-11ea-b7bc-f3fa4e77dd47. |
| [40] | Graves L (2017) The National, NBAD green-bond issuance puts environment at forefront, 2017. Available from: https://www.thenationalnews.com/business/markets/nbad-green-bond-issuance-puts-environment-at-forefront-1.9984. |
| [41] | DICE2013R_110513_vanilla GitHub. Available from: https://github.com/psztorc/DICE/blob/master/models/gams/DICE2013R_110513_vanilla.gms. |
| [42] | Orlov SM (2024) Extended DICE model scenarios GitHub. Available from: https://github.com/Orlov-SM/Extended-DICE-model-scenarios |
| [43] | Alchian AA (1953) The Meaning of Utility Measurement. Am Econ Rev 43: 26–50. |
| [44] | Werner RA (2009) Central Banking and the Governance of Credit Creation. |
| [45] |
Hourcade JC, Perrissin Fabert B, Rozenberg J (2012) Venturing into uncharted financial waters: an essay on climate-friendly finance. Int Environ Agreem 12: 165–186. https://doi.org/10.1007/s10784-012-9169-y doi: 10.1007/s10784-012-9169-y
|
| [46] |
Aglietta M, Hourcade J-C, Jaeger C, et al. (2015) Financing transition in an adverse context: climate finance beyond carbon finance. Int Environ Agreem 15: 403–420. https://doi.org/10.1007/s10784-015-9298-1 doi: 10.1007/s10784-015-9298-1
|
| [47] | Quantitative easing Available from: https://www.bankofengland.co.uk/monetary-policy/quantitative-easing. |
| [48] | We print money to bail out banks. Why can't we do it to solve climate change? (2016) The Guardian. |
| [49] | King E (2015) Climate Home News, Print money for climate finance, central banks told, 2015. Available from: https://www.climatechangenews.com/2015/04/24/print-money-for-climate-finance-central-banks-told/. |
| [50] | Murphy R (2015) Why we should print money to fund green investments. The Guardian. |
| [51] | Braga JP, Chen P, Semmler W (2024) Central Banks, Climate Risks, and Energy Transition – A Dynamic Macro Model and Econometric Evidence, Rochester, NY, Social Science Research Network (forthcoming). |
| [52] | Inflation Reduction Act (2024) U.S. Department of the Treasury, 2024. Available from: https://home.treasury.gov/policy-issues/inflation-reduction-act. |
| [53] | Sachs JD (2021) Fixing climate finance, 2021. Available from: https://www.socialeurope.eu/fixing-climate-finance. |
| [54] | Harford T, Klein M (2005) Grants or Loans? Development Finance and Incentive Effects, Viewpoint, World Bank, Washington, DC. |
| [55] | Green Climate Fund is 'considering issuing green bonds' Environmental Finance (2016). Available from: https://www.environmental-finance.com/content/news/green-climate-fund-is-considering-issuing-green-bonds.html. |
| [56] | Flaherty M, Gevorkyan A, Radpour S, et al. (2016) Financing climate policies through climate bonds – A three stage model and empirics. Res Int Bus Financ. https://doi.org/10.2139/ssrn.2881718 |
| [57] | Bonen A, Loungani P, Semmler W, et al. (2016) Investing to Mitigate and Adapt to Climate Change; A Framework Model, International Monetary Fund. https://doi.org/10.2139/ssrn.2882601 |
| [58] | Kellett CM, Faulwasser T, Weller SR (2016) DICE2013R-mc: A Matlab / CasADi Implementation of Vanilla DICE 2013R. arXiv: 160804294[math]. |
| [59] | DICE/RICE Models Available from: https://williamnordhaus.com/dicerice-models. |
| [60] |
Wouter Botzen WJ, van den Bergh JCJM (2012) How sensitive is Nordhaus to Weitzman? Climate policy in DICE with an alternative damage function. Econ Lett 117: 372–374. https://doi.org/10.1016/j.econlet.2012.05.032 doi: 10.1016/j.econlet.2012.05.032
|
| [61] | Chiarella C, Semmler W, Hsiao C-Y, et al. (2016) Sustainable Asset Accumulation and Dynamic Portfolio Decisions, Springer-Verlag Berlin Heidelberg. https://doi.org/10.1007/978-3-662-49229-1 |
 Environ-11-04-031-s1.pdf Environ-11-04-031-s1.pdf |
 |


Figures(8)

Sergey Orlov, Elena Rovenskaya, Julia Puaschunder, Willi Semmler. Green bonds, transition to a low-carbon economy, and intertemporal welfare allocation: Evidence from an extended DICE model[J]. AIMS Environmental Science, 2024, 11(4): 628-648. doi: 10.3934/environsci.2024031


 DownLoad: