
Citation: Vanessa Duarte Pinto, Catarina Martins, José Rodrigues, Manuela Pires Rosa. Improving access to greenspaces in the Mediterranean city of Faro[J]. AIMS Environmental Science, 2020, 7(3): 226-246. doi: 10.3934/environsci.2020014
[1] | Alessio Russo, Francisco J Escobedo, Stefan Zerbe . Quantifying the local-scale ecosystem services provided by urban treed streetscapes in Bolzano, Italy. AIMS Environmental Science, 2016, 3(1): 58-76. doi: 10.3934/environsci.2016.1.58 |
[2] | Finu Shrestha, Kabir Uddin, Sudan Bikash Maharjan, Samjwal Ratna Bajracharya . Application of remote sensing and GIS in environmental monitoring in the Hindu Kush Himalayan region. AIMS Environmental Science, 2016, 3(4): 646-662. doi: 10.3934/environsci.2016.4.646 |
[3] | Mary Thornbush . Urban agriculture in the transition to low carbon cities through urban greening. AIMS Environmental Science, 2015, 2(3): 852-867. doi: 10.3934/environsci.2015.3.852 |
[4] | Guy M. Robinson, Zhiling Liu . Greening and “un”greening Adelaide, South Australia. AIMS Environmental Science, 2015, 2(3): 511-532. doi: 10.3934/environsci.2015.3.511 |
[5] | Dominic Bowd, Campbell McKay, Wendy S. Shaw . Urban greening: environmentalism or marketable aesthetics. AIMS Environmental Science, 2015, 2(4): 935-949. doi: 10.3934/environsci.2015.4.935 |
[6] | Filippo Sgroi . Landscape management and economic evaluation of the ecosystem services of the vineyards. AIMS Environmental Science, 2021, 8(4): 393-402. doi: 10.3934/environsci.2021025 |
[7] | Huixuan Li, Cuizhen Wang, Yuqin Jiang, Andrew Hug, Yingru Li . Spatial assessment of sewage discharge with urbanization in 2004–2014, Beijing, China. AIMS Environmental Science, 2016, 3(4): 842-857. doi: 10.3934/environsci.2016.4.842 |
[8] | Africa de la Hera, Emilio Custodio Gimena, Àngel García Cortés . Evaluating ecosystem services and drivers of change in Spanish groundwater-related wetlands included in the Ramsar Convention. AIMS Environmental Science, 2017, 4(2): 232-250. doi: 10.3934/environsci.2017.2.232 |
[9] | Jon Knight, Pat Dale, Patrick Dwyer, Sam Marx . A conceptual approach to integrate management of ecosystem service and disservice in coastal wetlands. AIMS Environmental Science, 2017, 4(3): 431-442. doi: 10.3934/environsci.2017.3.431 |
[10] | Lin Ma, Jun Zhang, Lixing Chen, Shuling Xiao, Yingzi Zhang . A field research on the impact of underlying surface configuration on street thermal environment in Lhasa. AIMS Environmental Science, 2019, 6(6): 483-503. doi: 10.3934/environsci.2019.6.483 |
Urban green infrastructure has received increasing attention in the field of planning and urban design in a sustainable and resilience context.
The 2030 Agenda for Sustainable Development, adopted by United Nations Member States in 2015, addresses relevant issues to ensure a sustainable development and to reduce disparities among people and countries. One of the new sustainable development goals is to “make cities and human settlements inclusive, safe, resilient and sustainable” and there is a specific target on “public space” [1] that promotes the importance of having an urban green infrastructure. Also, the World Health Organization (2016) [2] has underlined how green and open spaces contribute to improvements in public health; therefore, it is essential that all people have adequate access to greenspaces. The European Common Indicators suggest a minimum of 15 minutes walking distance from home as an indicator of accessibility to greenspaces [3]. The Urban Agenda for the European Union, launched in 2016, stimulates growth, liveability and innovation in European cities and promotes green and resilient cities since environmental sustainability is fundamental to ensure the prosperity and well-being of all people within planetary boundaries. In Portugal, the Sustainable Cities 2020 strategy considers sustainable urban development for the period 2014–2020 and promotes the accessibility of urban outdoor spaces [4]. Moreover, researchers have also been promoting the importance of green infrastructure in urban development, considering its ecosystem services and its contribution to the access of food, to reduce poverty and to promote human well-being.
Greenspaces can provide ecosystem services or goods, such as food, water, biomass fuels, biodiversity, as well as, recycling and renewal of nutrients and wastes, mitigation of soil erosion, floods and droughts and air and water purification. Moreover, they are a source of aesthetic, recreational and spiritual benefits [5]. In this manner, ecosystems contribute with provisions, regulation, support and cultural services [6]. A few practical examples of how greenspaces provide ecosystem services are: they enhance net carbon sequestration and reduce the amount of CO2 [7]; contribute to temperature regulation in cities, counteracting the effects of the heat island that is created in this environment [8]; improve energy conservation in terms of energy used for warming or cooling in buildings [9].
Simply explained “greenspace” means a natural green area in an urban context [10]. This considers various types of habitats such as grasslands, woodlands, playing fields, gardens, parks, known as greenspaces and, also includes blue spaces, such as wetlands, corridors along riverbanks, streams, lakes, ponds, among others [11]. In this context, green and blue infrastructures are the green and water environments that offer quality to human lives. It also provides a link between ecosystems and human well-being [12]. For instance, being physically active in a natural environment is linked to the reduction of fatigue and negative emotions and the increase of general satisfaction [13,14]; increase of self-reported health, from a physical and mental point of view [15,16]; improvement of cardiovascular health and reduced obesity [17]; enhanced immune system [18,19] and reduced exposure to air pollution [20], which in turn, can reduce asthma attacks and respiratory diseases [21,22]. Additionally, studies have shown that greenspaces can improve social interactions, promote a sense of community by facilitating social networking and social inclusion [23,24] and can mitigate health disparities related with socioeconomic deprivation [25,26]. Reviews of these themes have highlighted the diverse positive relation between greenspaces and human health [27,28,29].
In the present study, we give emphasis to access to urban greenspaces, that are directly enjoyed or used to yield human well-being. So, in addition to large green parks, we consider the concept of pocket gardens, which have around 400 m2 [30], and the potential of new green roofs.
One could say that sustainable cities could use green roofs as a form of compensating the loss of greenspaces, ecosystem services and biodiversity in urban areas. Green roofs consist of implementing vegetation, growth medium and infrastructures, such as barriers and impermeable surfaces, on the roof’s buildings [31]. There are two types of green roofs. The intensive type, where the thickness of the soil layer is above 200 mm, the diversity of plants is high and can be viewed as a recreational zone. However, they require maintenance and reinforced infrastructures. On the other hand, with the extensive type, the thickness of the soil layer is below 200 mm, the diversity of plants used is low and is autonomous in relation to maintenance [32].
Green roofs can improve shading, insulation, evapotranspiration and thermal mass [33] so, they allow buildings to be more sustainable in terms of energy efficiency [34]. Rooftops become very hot in the summer, for this reason, the National Research Council of Canada showed that an extensive green roof with grass reduced the heat flow through the roof by over 75% in the spring and summer in Ottawa [33]. Also, green roofs can reflect up to 30% of solar radiation and absorb 60% due to plants’ photosynthesis [35]. Additionally, other benefits include air quality, provided from plants’ photosynthesis and reduction of water runoff, due to water absorption by the soil [36]. Moreover, they can improve biodiversity due to animal colonization of this new habitat [37,38,39] and urban ecological networks, acting as a bridge between fragmented green zones and enhancing species dispersal within urban areas [40,41,42]. Green roofs can also be used to improve urban agriculture. Recently, a variety of products have been cultivated, namely, tomatoes, carrots, beans, peppers, berries, mushrooms, among others [43]. In the context of a sustainable and resilient city region, an urban food system increases access to food, where urban residents have access to sufficient, nutritious, safe and affordable food, and there is a sense of identity [44]. The practice of urban agriculture has been associated with the wellbeing of the inhabitants, by contributing to their mental and physical health.
The present case study is developed for the city of Faro, located in the south of Portugal. It is intended to study the existing greenspaces, and their pedestrian accessibility, and to formulate a proposal of a network of green roofs to improve access to greenspaces and other multifunctional purposes.
The assessment is developed through the construction of urban indicators in two phases. In the first phase six indicators are developed: (a) the percentage of citizens living in the surroundings of large green areas; (b) the percentage of residential buildings that exist in the surroundings of large green areas; (c) the percentage of citizens living close to pocket parks; (d) the percentage of residential buildings that exist close to pocket parks; (e) the percentage of citizens living close to pocket parks and large green areas; (f) the percentage of residential buildings that exist close to pocket parks and large green areas. In the second phase, to increase greenspaces, two possible solutions are presented. These are focused on proposed green residential buildings, or blocks of residential buildings, located beyond the catchment areas studied before. These private buildings have rooftops with the potential for vegetation installations. Four indicators are developed: (g) the percentage of potential green buildings with private green roofs; (h) the percentage of residents living in potential green residential buildings with private green roofs; (i) the percentage of potential green blocks of buildings with private green roofs; (j) the percentage of residents living in potential green blocks of residential buildings with private green roofs.
For the first phase, a methodology was developed, in order to measure the accessibility to urban greenspaces. For the analysis of the proximity of residents and dwellings to the green infrastructure, the functionalities of the geographic information systems (GIS) are considered, in particular the calculation of distances within the pedestrian network. The spatial analysis methodology has been implemented by using ESRI ArcGIS Desktop 10.5 software (2016), including its Network Analyst extension and the ArcPy library for Python language.
There are three factors to measure distribution: accessibility, provision and population pressure [45]. In the present study we use accessibility that refers to the ability to reach desired goods, services, activities, destinations and opportunities, i.e., accessibility refers to the physical dimension and the distance to greenspaces. Mobility, as physical movement, is one of the factors that affect accessibility [46] and in the present research we focused on walking as a means of transport.
Land use proximity is one of the factors that can affect pedestrian accessibility and is related to urban density and mixed uses, and, therefore, short distances between activities [47]. Usually, it is considered that short distances between origins and destinations will increase walking. So, in the scope of the present study, the indicator “physical proximity” is determinant to promote pedestrian accessibility to greenspaces and to improve direct access to ecosystem services.
Travel distance is a current measure of proximity between origins and destinations. The analysis of spatial accessibility can become an important tool for urban planners in the evaluation of greenspaces provision and social justice. Barton et al. (1995) [48] have promoted an ecological perspective on settlements. According to them, designing cities for accessibility implies that the location of facilities must be as convenient as possible for residents. The starting point is the spatial relationship between the residences and the location of facilities and services. It is desirable that 80% of homes should achieve those distances, minimizing travel lengths, making it easier to travel on foot or by bicycle, thereby increasing sustainable mobility.
Walkability and physical activity can help the transition towards a healthier and more sustainable lifestyle. Rioux et al. (2016) [49] have explored the link between walkability and restorative environments, by showing how the presence of greenspaces can increase walkability.
In another way, the concept of “equity”, connected with social sustainability, is associated with the equality of opportunities of access to goods and services and to the right of participation of different groups in urban co-management processes; so it is linked to values of fairness and justice. This topic is important since urban greenspace distribution can be associated with disparities in terms of accessibility. Studies have shown that poor areas have worse greenspace accessibility and provision [50,51,52,53]. In this sense, city developers and planners should take into consideration better equity among the distribution, access and quality of urban greenspaces. In so doing, more equitable access to ecological services through greenspaces can improve the equity among the population.
Regarding accessibility, the concept of ideal walking distance has changed over time. Calthorpe (1994) [54] considered 2000 feet (approximately 600 m) as the maximum recommended walking distance. More recently, the European Communities (EC) (2000) [3] presented “The European Common Indicators” where one of the core indicators is related to the “availability of local public green areas and local services” for citizens. In the European Union, a 300 m standard is widely applied for access to local facilities/services as well as for green areas. The European Environment Agency, DG Regional Policy and Italian Instituto Nazionale di Statistica, use the concept “within 15 minutes walk” to define accessibility [3]. It is assumed that this corresponds to around 500 m on foot for an elderly person, which in turn, may be equivalent to 300 m “as the crow flies distance” [55]. The EC consider the percentage of people living within 300 m of a public open area. To allow a complete data analysis, they recommend that the indicator must be calculated twice, firstly relating to areas greater than 5000 m2, and secondly, for all areas used by the public for leisure and open-air activities, regardless of their size. Van Herzele and Wiedemann (2003) [56] calculated the accessibility of green areas in four Belgian cities by mapping the sizes and distances of green areas. Distance or walking time from home, appears to be the single most important precondition for the use of greenspaces. The authors considered that the acceptable distance for access to urban greenspace proximity is 300 m from housing, thus corresponding to 5 minutes’ walk.
European cities, such as Stockholm and Hamburg, have a large and varied ecological structure, and around 90% of the population live within 300 m of a green area. In England, the Accessible Natural Greenspace Standards, developed by English Nature, is a guideline that relates to accessibility (on foot) and size of areas that have been naturally colonized by plants and animals. It states, that “No person should live more than 300 m from their nearest area of natural greenspace of at least 2 ha in size”; “There should be at least one accessible 20 ha site within 2 km from the home”; “There should be one accessible 100 ha site within 5 km” and “There should be one accessible 500 ha site within 10 km” [57]. According to Barbosa et al. (2007) [58] only 36.5% of urban households in Sheffield meet English Nature’s recommendation that each person should have a greenspace no further than 300 m or 5 minutes walk from their home.
As in many highly urbanized cities, there is a lack of green areas, so, the concept of pocket gardens, small parks around 400 m2 [30], is considered in this study. This kind of greenspace usually has benches and urban furniture and is used by many people. Van Herzele and Wiedemann (2003) [55] observed that small greenspaces located in consolidated urban centers may have a strong connection with the local lifestyle and, thus, hold one component of social action.
There are some GIS-based methods to estimate urban green space accessibility. A traditional approach is to calculate the amount of greenspace within a city. Another approach is to measure access to greenspaces by using Euclidean distance or the distance along a road network. Higgs et al. (2012) [59] conclude that alternative approaches result in differences in distance calculations. Studies developed by Comber et al. (2008) [60] used the network distances to analyze greenspace accessibility for different ethnic and religious groups in a United Kingdom city and produced thematic maps of social and environmental justice, which showed inequality of provision and access to greenspaces. Other studies of spatial accessibility consider different means of transportation. For example, Li et al. (2019) [61] explore the influence of the metric of travel distance on spatial accessibility, considering the case of Shenzhen, major city in Guangdong Province, China. Four types of travel distance (Euclidean distance, walking distance, bicycling distance and driving distance) between communities and urban parks were requested by online AutoNavi Maps service. They conclude that 18% of communities have high population density and high park accessibility, while less than 17% of communities are low-density areas with low park accessibility, that is, over half of the communities have an accessibility level inappropriate for their population density. According to Herman et al. (2018) [62] prioritizing accessible location and identifying connections to the urban fabric is one of the strategies to create a successful sustainable urban green space through low-budget methods.
The study area is the city of Faro which is in the south of Portugal (Figure 1). It has great administrative importance, as it is the capital of the Algarve region. The municipality of Faro has a total area of 210 km2. It has a resident population of 65,019 inhabitants, according to the 2011 Census [63], 40% living in the countryside or small towns and 60% in the city of Faro. The study area covers the traditional Mediterranean city of Faro, with a total area of 5.62 km2, and a resident population of 39,194 inhabitants. This area is covered by 464 statistical subsections in the spatial database of the 2011 Census [63].
To develop the present work we used a database with varied information, collected and compiled in the research project InLUT–Integration of Land Use and Transport in Medium-Sized Cities [65]. The database is organized by thematic layers and contains spatial information on buildings, public transport network, road and pedestrian networks, urban land uses (including greenspaces) and demographic data from the 2011 census, provided by the National Institute of Statistics [63].
The “demographic census” is a polygon geometry layer with the location of the census blocks (subsections) and statistic data about the number of residents, buildings, accommodations and families in each block. The dataset presents 464 census blocks, with a total of 39,483 inhabitants. The maximum number of inhabitants per block is 510, the average number of inhabitants per block is about 86 with a standard deviation of 98. About 108 blocks presents less than 10 inhabitants and 6 blocks more than 400.
The dataset of buildings integrates the polygon localization of building footprints and data about the number of floors in each building, above and below the level of the entrance floor, the number of units with housing functions, and other activities, that were collected in the project InLUT [65]. The footprints were collected from a vector digital topographic survey delivered by the municipality of Faro. Footprints of recent buildings were digitized from aerial orthophotos. The non-spatial data was collected in the project InLUT [for more details of the method see 65, 66]. The number of residents in each building was estimated overlaying spatial data, census blocks and buildings footprints. For each building inside its census block, the estimated number of inhabitants in the building was assigned using the equation (1), where NRE means the number of residents per building, NIR means the number of residents in the statistical subsection where the building is located, NFFH means the number of homes per building and NFFHS means the number of homes per statistical subsection. This value is proportional to the number of dwellings in the building.
NRE=NIR×NFFHNFFHS | (1) |
Data analysis shows that the average population density of the study area is 11,590 inhabitants/km2 (115.9 inhab/ha). There are 22,525 homes with a housing function, spread over 6307 buildings. The average number of dwellings per building is 3.6 and the average number of residents per home is 1.4. The highest densities are found in areas of urban expansion, developed in the last two decades of the twentieth century. In the city there is a consensual distribution between the number of dwellings per building and the population density.
The street network of the study area has an extension of 120.6 km, where 16.2 km are exclusively for pedestrians and the remaining 104.4 km are streets used by motorized and pedestrian modes. The network dataset adopted to model the street network includes arcs and nodes or junctions. Arcs are the centerlines of streets and nodes are intersection points of three or more arcs. Line features were obtained from digital multifunctional cartography that where processed with ArcGIS Network Analyst to produce the topological network model. The cost function to calculate distances along the network was built from the length of the arcs.
In the study area, forty public greenspaces were considered. All of them with characteristics of having green elements and urban furniture. The polygon features of the greenspaces dataset was compiled from the digital topographic survey of the municipality and from aerial orthophotos of Faro. To avoid errors of identification and classification of greenspaces, all features were observed and confirmed in situ.
According to Alves et al. (2015) [65] the city of Faro has a small urban green infrastructure with 8.8 m2/inhabitant. Agreeing, Berte and Panagopoulos (2014) [67] demonstrated that Faro’s green structure has high fragmentation discontinuity, where the majority of streets, buildings and open areas do not benefit from green areas. They consider that there is a lack of free space in the compact urban fabric and only a few parking areas, streets and squares take advantage of trees and permeable soils with limited results. The city of Faro has a proposal for a Fundamental Ecological Structure and an Urban Ecological Structure, which was developed within the scope of Faro Green Plan in 2008. This proposal defines urban cohesion units, that is, sets of urban spaces, which by their characteristics are interconnected, establishing physical and symbolic/morphological continuities that should be subject to joint intervention [68]. Some new parks such as Marchil Farm, Vale de Amoreira Urban Park, Stº. António do Alto Urban Park, Moinho da Palmeira Farm and Bivar Cúmano Farm were proposed on the edge of the city within a reasonable walking/biking distance to the surrounding neighborhoods.
In Faro city, traditionally, there are horizontal rooftops (Figure 2) as was common in Mediterranean architecture. They were used by people in their daily life, but this habit has been almost abandoned in the last decades. In the modern construction of concrete buildings, the use of flat roofs has prevailed. A network of green roofs on the top of some of these buildings throughout the city could improve greenspace infrastructure. As a main criterion in this study, the area of these green roofs should be at least 400 m2, the same condition adopted for greenspaces. Adjoining (touching) buildings (Figure 3) are likely to offer area availability for larger green roofs, so this possibility will also be analyzed.
This urban solution is also proposed, due to environmental issues related to the search for technical solutions to increase the energy efficiency of buildings.
In Portugal, nearly 80% of the buildings were built before the publication of the first thermal regulation (in 1990), hence the performance of thermal and moisture insulations is inadequate in the majority of cases [69]. As shown above, rooftops can become very hot in the summer, so it is important to find alternative technologies to mitigate this problem. Therefore, rehabilitation measures in view of energy retrofitting must be common practice and sustainable construction must give emphasis to the benefits of green roofs. Extensive green roofs are appropriate for large sized rooftops and their construction process is technically simple. Regarding this subject, it is paramount to verify if the buildings have the structural capacity to accommodate the weight of a green roof over time. Since the Algarve is a seismic zone, low-weight green roofs on buildings are a fundamental prerequisite. In addition to the environmental benefits, the green roofs also have social benefits. For example, enjoying a beautiful view from a flat rooftop can contribute to a sense of well-being by people who live in a tall building (Figure 4). Urban vegetable gardens can contribute to an active life and are becoming a place to meet and share common activities (Figure 5). On the other hand, food system policy and planning should be one of the main focuses of sustainable and resilient cities [44]. Since the city of Faro has a hot and dry climate and, consequently, experiences water scarcity in the summer, perennial vegetable varieties should be considered, and attention should be given to the water consumption of vegetables. It is necessary to apply technologies that consider the sustainable use of water, such as drip irrigation and the use of small stock infrastructures, that can catch and store rainfall water for the irrigation of green roofs. An example of this is already being applied. A new concept of urban food gardens uses small water reservoirs under the grow boxes, that can be filled with water and in addition catch rainfall, filling the water reservoir. This process is efficient in water usage and allows self-sufficient irrigation for about three weeks [70].
Recently, the municipality of Faro promoted horizontal roofs (açoteias) by organizing the 1st European Meeting of Rooftops in January 2019 and the Açoteia-Faro Rooftop Festival in June 2019. In this context, on 19th of June, an urban agricultural space, located on the roof of the municipal market, was inaugurated (Figure 6). This first rooftop vegetable garden will guarantee food access for people and will serve as a training area. It promotes social inclusion and active training of people who are outside of the vocational education and training system.
Geographic Information Systems (GIS) are suitable tools for accessibility studies on different scales (urban, regional and national) and from different perspectives [71,72]. At the urban level, the walking infrastructure is often represented by a pedestrian network by using street center line data and by measuring spatial separation between origins and destinations or between nodes. We used the network distance [73]. The distance between two points is defined as the length of the shortest path on the network that connects those points, one taken as the origin and the other as destination; its value can be computed by a GIS software such as ArcGIS Desktop with Network Analyst extension. In the case where one (or both) of the points does not lie over the network, the network is dynamically extended by adding an arc connecting this point to the closest arc of the network. One of the available tools of this GIS software, allows to compute the origin-destination matrix (O-D Matrix), where rows represent the set of origin points, columns the set of destination points and elements of the matrix the distance between each pair of points.
Contour measures allow to compute the catchment areas around a node or a point that enables counting the number of specific types of opportunities within each contour [74]. This measurement is implemented in the Service Area tool of the Network Analyst extension. Given a set of points (services), a network and a distance, this tool identifies the part of the network within distance of at least one of the services and generates a polygon. The type of the polygon generated (catchment area) is not, however, suitable for an urban scale [75], thus it should not be used to overlay other layers and to count opportunities. Instead of overlaying, the O-D matrix can be used to identify and/or count all the origin points (opportunities) within a given distance of a specific destination (service).
In the present study, the physical proximity indicator between buildings and greenspaces, plays a central role in promoting pedestrian accessibility to greenspaces. It is computed from the O-D matrices and expresses the walking distance from the building to the nearest access point of the closest greenspace. The calculation of these matrices used the Network Analyst extension, the centroids of the buildings (origins), sets of vertices at points of accessibility to the green area (destinations) and the pedestrian network.
This estimate and the distance between homes and greenspaces, provided by O-D matrices, enable us to evaluate the total population within a distance of 300 m from the greenspaces. The distances from buildings to greenspaces obtained were grouped in three classes, less than 300 m, between 300 m and 600 m and greater than 600 m. These classes, up to the reference distance (300 m) and up to twice this distance, enable the understanding of how the number of buildings (and inhabitants) grows with de distance to the closest green area.
In the study area, forty public greenspaces were considered. The average area of all these spaces is 6100 m2, the smallest space being an area of 416 m2 and the largest an area of 81,696 m2.
In Figures 7 and 8, the location and distribution of the greenspaces can be seen. In the first they are equal to or greater than 5000 m2, and in the second, they are equal to or greater than 400 m2 and, additionally, show the potential green buildings. The served area, served within the standard distance, is the catchment area, and it is represented by a green tone (distance up to 300 m), which represents closer proximity to a greenspace. These figures show the area served by the greenspaces up to the standard distance of 300 m. In it, we can see the pedestrian network, the public greenspaces, and the buildings with green tones, when the network distance to the nearest greenspace is up to 300 m, otherwise, the shades are grey.
It was found that, as a result of the analysis of the accessibility to greenspaces in the study area, 34.1% of buildings and 29.1% of residents have a large greenspace, bearing in mind the standard distance (300 m) and 75.6% of buildings and 68.3% of residents have a greenspace near there homes, taking into account areas equal to or greater than 400 m2.
So, the numbers increase when the existence of pocket gardens is considered. These gardens are very important for the daily life of people. Pedestrian access rises appreciably if greater distances are considered. Figure 9 shows that 94.5% of residents live up to 600 m from the closest pocket park (area of about 400 m2).
However, the present study advocates close proximity as an equity attribute of green areas’ access, so, an alternative greenspace network is proposed, that is focalized on private green roofs. As horizontal rooftops are a cultural architecture element in the south of Portugal, to increase the access to greenspaces, the present study proposes the implementation of a greater collection of green roofs located in the city of Faro, where there are no relevant green parks.
It was observed that, in the case of public greenspaces, taking into account their distribution, the standard distance and the distribution of the population (and the residential buildings) in the study area, some of these with a high population density, are identified as not being covered by these facilities. Can the planning of green roofs make the difference and contribute to access to usable greenspaces in a compact city?
Faro city includes 6307 buildings, 5107 of these are residential (houses and condominiums) with 22,525 dwelling units and 1200 are not used for residential purposes. The area of implantation of the majority of the buildings is less than 400 m2. Only 183 buildings with 3 or more floors (above the entrance-level floor) have areas greater than 400 m2. This number reduces to 129 buildings with five or more floors and to 80 with seven or more floors.
Thirteen buildings, with area greater than 400 m2, 7 or more floors and dwelling functions, exist in areas of poor public greenspace provision (>300m). In these thirteen “proposed” green buildings there are 521 inhabitants (1.3% of the total residents). So, the construction of low-weight green roofs on buildings would contribute to a 1.3% increase in residents with direct access to greenspaces.
The number of residents with direct access to green roofs on their home would increase if, instead of single buildings, we consider groups of adjacent (touching) buildings with roofs at the same level. Groups of buildings with these conditions, which we named “blocks”, were analyzed. Figure 10 presents the blocks of grouped buildings of five or more floors with the sum of rooftop areas greater than 400 m2; while Table 1 show the number of blocks, buildings and residents considering three classes, defined according to the number of floors of the buildings. The set of 541 buildings (which give rise to 221 blocks of buildings) have a total area of 190,110 m2. The calculations indicate 120,000 m2 of proposed green area on the rooftops (an area five times greater than “Jardim da Alameda”, a central garden that has 22,350 m2).
Potential green areas in rooftops | Number blocks | Number of residential buildings | Number of residents in proposed green block buildings |
Blocks of buildings with 3 or more floors | 388 | 1041 | 21221 |
Blocks of buildings with 5 or more floors | 221 | 541 | 16167 |
Blocks of buildings with 7 or more floors | 108 | 239 | 9488 |
If these blocks of buildings in areas of poor public greenspaces are considered, then 4390 residents could live close to their private greenspace (11.2%). With this kind of proposal, access to greenspaces could be 80% (Figure 10 and Table 2).
Greenspaces | Standard distance (m) | Residential buildings close to greenspaces (%) | Inhabitants in buildings close to public greenspaces (%) | Residents in private green buildings (%) |
Public greenspaces greater then 5000 m2 | 300 | 34.1 | 29.1 | - |
Public greenspaces greater then 400 m2 and smaller then 5000 m2 | 300 | 41.5 | 39.2 | - |
Public greenspaces greater then 400 m2 | 300 | 75.6 | 68.3 | - |
Proposed green roofs in potential green buildings located in poor greenspaces provision | - | 0.2 | - | 1.3 |
Proposed green roofs in potential blocks of buildings located in poor greenspaces provision | - | 2.8 | - | 11.2 |
Total (sustainable strategy proposal) | - | 78.4 | 79.5 |
The main goal of this study was to emphasize accessibility to greenspaces in Faro, including typical parks with large dimensions and pocket parks. In addition, it took into consideration the possibility of green roofs as a form of increasing greenspace in an urban context and so, improve citizens’ access to these facilities.
The analysis of the close accessibility to greenspaces in the city of Faro concludes that only 34.1% of buildings and 29.1% of inhabitants exist and live, respectively, close to large green areas (greater than 5000 m2). These percentages can increase to 75.6% of buildings and 68.3% of inhabitants, if the concept of pocket gardens is considered. So, this kind of greenspace is very important for daily life, since people have direct access to them and can feel well, as greenspaces contribute to their mental and physical health. These percentages can be increased to 70% of inhabitants, if private green roofs are planned on potential green buildings located inside the area of poor public greenspace provision. However, Barton el al. (1995) [48] suggest that 80% of homes should achieve that standard, so more greenspaces must be implemented, including green roofs considering blocks of buildings with the same level.
Green public spaces were initially created as places of social interaction, however nowadays the perception of the existence of “ecosystem services” are demanding new paradigms in urban planning and management that should consider a connected green infrastructure. In a context of sustainability and resilience, it is necessary to increase close accessibility to greenspaces, since they have a positive impact on the health and well-being of citizens, resulting from the ecosystem services they provide. Moreover, sustainable cities could use green roofs as a form of compensating the loss of greenspaces, biodiversity and ecosystem services. In high density urban areas green roofs can offer provisioning services (e.g., food), regulating services, (e.g., air quality), supporting services (e.g., oxygen) and cultural services, such as recreational and other nonmaterial benefits, also, as usable spaces, they can create a sense of security. In this way, green roofs can be seen as private domestic gardens, which studies have shown are considered an important quality of dwellings and beneficial for residents. Bhatti and Church (2004) [76] observed that, in general, people associate private gardens with privacy, sociability and connection to nature. Coolen and Meesters (2012) [77] observed that people want a private garden since it is a place that is peaceful, quiet and private and allows being outside; plus, it considered the garden as a way of enjoying life and as a sense of freedom; whilst public parks were associated with a sense of nature and livability of a neighborhood. In accordance, Boumeester et al. (2009) [78] noted that people want both private and public greenspaces in their home and neighborhood environment. Hence, these two types of greenspaces are not substitutes for each other since the play different roles for citizens [79] and both are important for people’s daily life. Furthermore, considering the recent worldwide pandemic event, the majority of the population was in social isolation and, those who had the possibility, resorted to private gardens and building roofs for access to “nature” or fresh air and views over the city, respectively. In this sad situation, dwelling roofs were perceived as usable spaces and associated with security and well-being.
As horizontal rooftops are a cultural architecture element in the south of Portugal, to increase the access to greenspaces, the present study proposes the implementation of a greater collection of green roofs located in the city of Faro. Greenspaces created through low-budget strategies can be seen by the experts and active users as equally successful and valuable as the resource-heavy and expensive designs [62]. The implementation of a collection of green roofs requires bottom-up development schemes. The selection of appropriate species of plants, that are well suited to Faro’s dry weather, and taking into consideration water reservoir catchments and the appropriate technology, is critical in order to achieve the sustainable maintenance of these spaces, plus, ideally, it should be managed by residents. These implementations will improve buildings’ thermal performance and enhance resident’s well-being. Additionally, they can add real estate value to the buildings where they exist. Moreover, nowadays the maintenance of public spaces faces many economic difficulties from a municipal perspective. Therefore, in a context of sustainability and co-participation of all citizens, privately owned greenspaces could be complementary to traditional public spaces. So, private green roofs could be considered as an important element of the landscape that should be considered by spatial planning.
Regarding urban planning and design, a major challenge is the lack of available space and the difficulty in modifying existing environments. Alternative greenspaces, such as green roofs, vertical green walls, biofilic urbanism, edible green infrastructures, among others, should be taken into consideration in cities’ re-naturing processes [80]. In this context, in urban regeneration processes, innovative green roofs and financial support for their construction should be considered. These contribute, significantly, to the access of residents of the buildings to green areas, to local food production and, additionally, creates ecological connectivity between cities.
The approach of this study has some limitations. First, in our analysis we used accessibility (distance to greenspaces) to evaluate greenspaces distribution and citizens’ access to them, since distance is a key parameter considering spatial separation between supply and demand [61]. However, there are other factors that can be used, such as the provision (greenspace cover within an area) and population pressure (possible crowding of a greenspace). Depending on the factor used, the results may vary [45]. So, ideally, the three factors should be used. Nevertheless, when interpreting and/or comparing the results, we must take into consideration that greenspaces are multidimensional, complex and can be influenced by spatial and temporal factors. Secondly, different methodologies can produce different outcomes [81]. In this study we used the network approach, since it calculates the actual distance from site access points, so it is more accurate compared to other methods [11], although other methodologies such as straight-line (that produces a uniform buffer around the areas chosen, assuming the residents within the buffer can access one or more greenspaces) can be used. Thirdly, we did not take into consideration the quality of the greenspaces. Therefore, future studies relating to Faro’s green areas should take into account the quality of these infrastructures, since negative effects can emerge from lack of planning and poor management of these areas. Thus, resulting in ecosystem disservices, like plant species that induce allergies, the increase of rats and mice, that can act as diseases vectors or fear related to unsafe greenspaces [82]. Fourthly, in the present study we propose the construction of green roofs to increase greenspaces in an urban context and to increase accessibility to them. However, this proposal is not suited for most cities, so comparisons with other cities may be difficult, since Faro has a typical architecture where flat roof tops prevail. Finally, regarding accessibility, green roofs are private spaces and so only residents have access to them. However, this condition can be considered an advantage since residents are in a more protected, reserved and secure place, thus ensuring greater comfort to its users. On the other hand, public green spaces are, usually, characterized as open spaces and can guarantee social equity in their physical access, social interaction and the sequent acquaintanceship which could contribute to social cohesion. We believe that both types of greenspaces should coexist and, together, both promote ecological benefits and enhance health and well-being for its users.
By using the network analysis method of GIS the present study analyzed the close accessibility of pedestrians to greenspaces in the city of Faro, mapping the buildings and streets close to public greenspaces. This study is important for urban rehabilitation processes, enterprise capacity building and for a better perception of local communities and decision makers of urban sustainability.
These results also provide an important strategy to sustainable urban planning and management and to the definition of a green roof network, that could increase the access and usability of greenspaces. With GIS, the results can be well visualized, easily understood and interpreted by urban planners, policy makers and businessmen, bearing in mind that local accessibility must be considered a high priority for service providers.
The sustainability of cities is dependent on governance and collective decision-making processes that must be designed for the collective good of a community, needed for the implementation of innovative sustainable measures.
We thank the municipality of Faro for providing digital cartography. This project had the support of the project UID/MAR/04292/2019 which is funded by the Foundation for Science and Technology. This study was supported by a spatial database of the city of Faro, developed within the framework of the Research Project “Integration of Land Use and Transport in medium-sized cities” reference FCT PTDC / AUR-URB / 111013/2009 and funded by the Foundation for Science and Technology. This project had the support of the project UID/MAR/04292/2019 which is funded by the Foundation for Science and Technology.
The authors declare no conflict of interest, financial or otherwise.
[1] | UN General Assembly. Transforming our world: From 2030 Agenda for Sustainable Development, 2015. Available from: https://www.refworld.org/docid/57b6e3e44.html. |
[2] | World Health Organization (2016) Urban green spaces and health, a review of evidence. Copenhagen: WHO regional office for Europe. |
[3] | European Communities (2000) Towards a local sustainability profile: European common indicators. In: Towards an urban atlas, Technical Report, Directorate-General for Environment, Luxembourg, European Commission. |
[4] | Cavaco C, Vilares E, Rosa F, et al. (2015) The Portuguese Strategy for Sustainable Cities towards smarter urban development. GEOSPATIAL World Forum: Workshop Measuring Progress Achieving Smarter Cities. Available from: http://www.unece.org/fileadmin/DAM/hlm/prgm/urbandevt/Measuring_Progress__Achieving_Smarter_Cities_/Presentations/Cristina_Cavaco.pdf. |
[5] | Fisher B, Costanza R, Turner K, et al. (2007) Defining and classifying ecosystem services for decision making. CSERGE, University of East Anglia, Norwich 07-04. |
[6] | Millennium Ecosystem Assessment (2005) Ecosystems and Human Well-being: Synthesis. In: Island Press, Washington DC. |
[7] |
Escobedo FJ, Varela S, Zhao M, et al. (2010) Analysing the efficacy of subtropical urban forests in offsetting carbon emissions from cities. Environ Sci Policy 13: 362-372. doi: 10.1016/j.envsci.2010.03.009
![]() |
[8] |
Gill S, Handley J, Ennos A, et al. (2007) Adapting cities for climate change: the role of the green infrastructure. Built Environ 33: 115-133. doi: 10.2148/benv.33.1.115
![]() |
[9] | Simpson JR, McPherson EG (1996) Potential of tree shade for reducing residential energy use in California. J Arboricult 22: 10-18. |
[10] |
Comber A, Brunsdon C, Green E (2008) Using a GIS-based network analysis to determine urban greenspace accessibility for different ethnic and religious groups. Landsc Urban Plan 86: 103-114. doi: 10.1016/j.landurbplan.2008.01.002
![]() |
[11] | Handley J, Pauleit S, Slinn P, et al. (2003) Providing accessible natural greenspace in towns and cities: a practical guide to assessing the resource and implementing local standards for provision. Centre for Urban and Regional Ecology 1-36. |
[12] | Maidstone Borough Council: Green and blue infrastructure strategy, 2016. Available from: http://www.maidstone.gov.uk/__data/assets/pdf_file/0004/164659/Green-and-Blue-Infrastructure-trategy-June-2016.pdf. |
[13] |
Bowler DE, Buyung-Ali LM, Knight TM, et al. (2010) A systematic review of evidence for the added benefits to health of exposure to natural environments. BMC Public Health 10: 456. doi: 10.1186/1471-2458-10-456
![]() |
[14] | Thompson K, Coon JB, Stein K, et al. (2011) Does participating in physical activity in outdoor natural environments have a greater effect on physical and mental wellbeing than physical activity indoors? A systematic review. Environ Sc. Technol 45: 1761-1772. |
[15] | de Vries S, Verheij R, Groenewegen P, et al. (2003) Natural environments-healthy environments? An exploratory analysis of the relationship between greenspace and health. Environ Plan A 35: 1717-173. |
[16] |
Fuller R, Irvine K, Devine-Wright P, et al. (2007) Psychological benefits of greenspace increase with biodiversity. Biol Lett 3: 390-394. doi: 10.1098/rsbl.2007.0149
![]() |
[17] |
Owen N, Healy GN, Matthews CE, et al. (2010) Too much sitting: the population-health science of sedentary behavior. Exerc Sport Sci Rev 38: 105-113. doi: 10.1097/JES.0b013e3181e373a2
![]() |
[18] |
Li Q, Morimoto K, Kobayashi M (2008) Visiting a forest, but not a city, increases human natural killer activity and expression of anti-cancer proteins. Int J Immunopath Ph 21: 117-127. doi: 10.1177/039463200802100113
![]() |
[19] | Kuo M (2015) How might contact with nature promote human health? Promising mechanisms and a possible central pathway. Front Psych 25: 1093. |
[20] |
Madureira H., Nunes F., Oliveira JV, et al. (2015) Urban residents' beliefs concerning green space benefits in four cities in France and Portugal. Urban Forest Urban Green 14: 56-64. doi: 10.1016/j.ufug.2014.11.008
![]() |
[21] | Sunyer J, Ballester F, Le Tetre A, et al. (2003) The association of daily sulfur dioxide air pollution levels with hospital admissions for cardiovascular diseases in Europe (The Aphea-II study). Eur Heart J 24 (8): 752-760. |
[22] | Bernstein JA, Alexis N, Barnes C, et al. (2004) Health effects of air pollution. J Allergy Clin Inmun 114 (5): 1116-1123. |
[23] |
Kim J, Kaplan R (2004) Physical and psychological factors in sense of community: new urbanist kentlands and nearby orchard village. Environ Behav 36: 313-340. doi: 10.1177/0013916503260236
![]() |
[24] |
Seeland K, Dubendorfer S, Hansmann R (2009) Making friends in Zurich's urban forests and parks: The role of public green space for social inclusion of youths from different cultures. Forest Policy Econ 11: 10-17. doi: 10.1016/j.forpol.2008.07.005
![]() |
[25] |
Mitchell R, Popham F (2008) Effect of exposure to natural environment on health inequalities: an observational population study. Lancet 372: 1655-1660. doi: 10.1016/S0140-6736(08)61689-X
![]() |
[26] |
Brown SC, Perrino T, Lombard J, et al. (2018) Health disparities in the relationship of neighborhood greenness to mental health outcomes in 249,405 U.S. Medicare beneficiaries. Int J Environ Res Public Health 15: 430. doi: 10.3390/ijerph15030430
![]() |
[27] |
James P, Banay RF, Hart JE, et al. (2015) A Review of the Health Benefits of Greenness. Curr Epidemiol Rep 2:131-142. doi: 10.1007/s40471-015-0043-7
![]() |
[28] |
van den Berg M, Wendel-Vos W, van Poppel M, et al. (2015) Health benefits of green spaces in the living environment: A systematic review of epidemiological studies. Urban Forest Urban Green 14: 806-816. doi: 10.1016/j.ufug.2015.07.008
![]() |
[29] |
Twohig-Bennett C, Jones A (2018) The health benefits of the great outdoors: A systematic review and meta-analysis of greenspace exposure and health outcomes. Environ Res 166: 628-637. doi: 10.1016/j.envres.2018.06.030
![]() |
[30] | Forsyth A, Musacchio L, Fitzgerald F (2005) Designing small parks: a manual for addressing social and ecological concerns, In: John Wiley & Sons, New Jersey. |
[31] |
Berardi U, GhaffarianHoseini A, GhaffarianHoseini A (2014) State-of-the-art analysis of the environmental benefits of green roofs. Appl Energy 115: 411-428. doi: 10.1016/j.apenergy.2013.10.047
![]() |
[32] |
Emilsson T (2008) Vegetation development on extensive vegetated green roofs: influence of substrate composition, establishment method and species mix. Ecol Eng 33: 265-77. doi: 10.1016/j.ecoleng.2008.05.005
![]() |
[33] | Liu K, Baskaran B (2003) Thermal performance of green roofs through field evaluation. Proceedings of the First North American Green Roof Infrastructure Conference, Chicago, USA, May 29-30, 1-10. |
[34] |
GhaffarianHoseini A, Dahlan N, Berardi U, et al. (2013) Sustainable energy performances of green buildings: a review of current theories, implementations and challenges. Renew Sustainable Energy Rev 25: 1-17. doi: 10.1016/j.rser.2013.01.010
![]() |
[35] |
Weng Q, Lu D, Schubring J (2004) Estimation of land surface temperature-vegetation abundance relationship for urban heat island studies. Remote Sens Environ 89: 467-83. doi: 10.1016/j.rse.2003.11.005
![]() |
[36] |
Bates A, Sadler J, Mackay R (2013) Vegetation development over four years on two green roofs in the UK. Urban Forest Urban Green 12: 98-108. doi: 10.1016/j.ufug.2012.12.003
![]() |
[37] | Baumann N (2006) Ground-nesting birds on green roofs in Switzerland: Preliminary observations. Urban Habitats 4 (1): 37-50. |
[38] | Colla SR, Willis E, Packer L (2009) Can green roofs provide habitat for urban bees (Hymenoptera: Apidae)? CATE 2:1-12. |
[39] |
MacIvor S, Lundholm J (2011) Insect species composition and diversity on intensive green roofs and adjacent level-ground habitats. Urban Ecosyst 14: 225-241. doi: 10.1007/s11252-010-0149-0
![]() |
[40] |
Kim KG (2004) The application of the biosphere reserve concept to urban areas: the case for green rooftops for habitat network in Seoul. Ann NY Acad Sci 1023: 187-214. doi: 10.1196/annals.1319.010
![]() |
[41] |
Ignatieva M, Stewart G, Meurk C (2011) Planning and design of ecological networks in urban areas. Landscape Ecol Eng 7: 17-25. doi: 10.1007/s11355-010-0143-y
![]() |
[42] |
Baldock K, Goddard M, Hicks D, et al. (2019) A systems approach reveals urban pollinator hotspots and conservation opportunities. Nat Ecol Evol 3: 363-373. doi: 10.1038/s41559-018-0769-y
![]() |
[43] |
Whittinghill L, Rowe D, Cregg B (2013) Evaluation of vegetable production on extensive green roofs. Agroecol Sust Food 37: 465-484. doi: 10.1080/21683565.2012.756847
![]() |
[44] | Dubbeling M, Renting H, Hoekstra F, et al. (2015) City Region Food Systems. Urban Agr Mag 29: 1-72. |
[45] |
Mears M, Brindley P (2019) Measuring Urban Greenspace Distribution Equity: The Importance of Appropriate Methodological Approaches. Int J Geo-Inf 8: 286. doi: 10.3390/ijgi8060286
![]() |
[46] | VTPI, Accessibility evaluating peoples to reach desired goods, services and activities: From TDM Encyclopedia, Victoria Transport Policy Institute, 2017. Available from: http://www.vtpi.org/tdm/tdm84.htm. |
[47] | Litman T (2017) Accessibility for transportation planning: Measuring people's ability to reach desired goods and activitie. TDM Encyclopedia, Victoria Transport Policy Institute. |
[48] | Barton H, Davis G, Guise R (1995) Sustainable Settlements-a guide for planners, designers and developers, In: Bristol University of the West of England and The Local Government Management Board. |
[49] |
Rioux L, Werner C, Mokounkolo R, et al. (2016) Walking in two French neighbourhoods: A study of how park numbers and locations relate to everyday walking. J Environ Psychol 48: 169-184. doi: 10.1016/j.jenvp.2016.10.003
![]() |
[50] |
Dai D (2011) Racial/ethnic and socioeconomic disparities in urban green space accessibility: Where to intervene? Landsc Urban Plan 102: 234-244. doi: 10.1016/j.landurbplan.2011.05.002
![]() |
[51] | Astell-Burt T, Feng X, Mavoa S, et al. (2014) Do low-income neighbourhoods have the least green space? A cross-sectional study of Australia's most populous cities. BMC Public Health 14: 292. |
[52] |
Heckert M (2013) Access and equity in greenspace provision: A comparison of methods to assess the impacts of greening vacant land. Trans GIS 17: 808-827. doi: 10.1111/tgis.12000
![]() |
[53] |
Shen Y, Sun F, Che Y (2017) Public green spaces and human wellbeing: Mapping the spatial inequity and mismatching status of public green space in the Central City of Shanghai. Urban Forest Urban Green 27: 59-68. doi: 10.1016/j.ufug.2017.06.018
![]() |
[54] | Calthorpe P (1994) Shokokusya: The Next American Metropolis-Ecology, Community and the American Dream, In: Architectural Press, Princeton. |
[55] | European Environment Agency (2002). Towards an urban atlas: Assessment of spatial data on 25 European cities and urban areas. In: Environmental issue report No 30/2002, Copenhagen. |
[56] |
van Herzele A, Wiedemann T (2003) A monitoring tool for the provision of accessible and attractive urban green spaces. Landsc Urban Plan 63: 109-126. doi: 10.1016/S0169-2046(02)00192-5
![]() |
[57] | Natural England: From 'Nature Nearby' Accessible Natural Greenspace Guidance, 2010. Available from: http://www.ukmaburbanforum.co.uk/docunents/other/nature_nearby.pdf. |
[58] | Barbosa O, Tratalos J, Armsworth P, et al. (2007) Who benefits from access to green space? A case study from Sheffield, UK. Landsc Urban Plan 83: 187-195. |
[59] |
Higgs G, Fry R, Langford M (2012) Investigating the implications of using alternative GIS-based techniques to measure accessibility to green space. Environ Plann B: Planning and Design 39: 326-343. doi: 10.1068/b37130
![]() |
[60] |
Comber A, Brunsdon C, Green E (2008) Using a GIS-based network analysis to determine urban greenspace accessibility for different ethnic and religious groups. Landsc Urban 86: 103-114. doi: 10.1016/j.landurbplan.2008.01.002
![]() |
[61] |
Li L, Du Q, Ren F, et al. (2019) Assessing Spatial Accessibility to Hierarchical Urban Parks by Multi-Types of Travel Distance in Shenzhen, China. Int. J Environ Res Public Health 16: 1038. doi: 10.3390/ijerph16061038
![]() |
[62] |
Herman K, Sbarcea M, Panagopoulos T (2018) Creating Green Space Sustainability through Low-Budget and Upcycling Strategies. Sustainability 10: 1857. doi: 10.3390/su10061857
![]() |
[63] | Instituto Nacional de Estatística (INE): From Base Geográfica de Referenciação da Informação, 2011. Available from: http://mapas.ine.pt/download/index2011.phtml. |
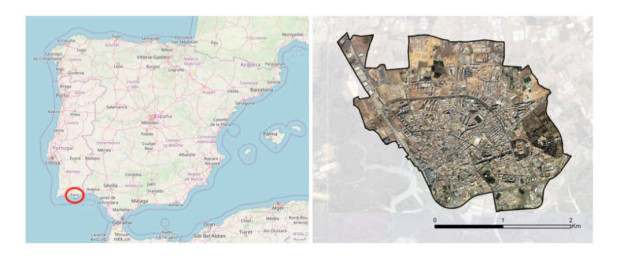
[64] | Figure 1 from: Map data copyrighted OpenStreetMap contributors. Available from: https://www.openstreetmap.org. |
[65] | Alves R, Bento R, Ramos L, et al. (2015) Integração dos usos do solo e transportes em cidades de média dimensão (InLUT). In: Relatório final, Universidade de Trás-os-Montes e Alto douro, Faculdade de Arquitectura da Universidade técnica de Lisboa e Universidade do Algarve. |
[66] | Rosa MP, Martins C, Rodrigues J (2017) The development of indicators of sustainable mobility associated with an urbanism of proximity. The Case of the City of Faro. In: INCREaSE, Proceedings of the International Congress on Engineering and Sustainability, Faro, Portugal, Springer 47-66. |
[67] |
Berte E, Panagopoulos T (2014) Enhancing city resilience to climate change by means of ecosystem services improvement: A SWOT analysis for the city of Faro, Portugal. Int J Urban Sust Dev 6: 241-253. doi: 10.1080/19463138.2014.953536
![]() |
[68] | Santos A, Terremoto R, Brito J, et al. (2008) Plano Verde de Faro-Princípios, Objectivos e Conteúdo. Câmara Municipal de Faro e Gabinete de Apoio Técnico de Faro. |
[69] | Guimarães ET, Bragança L, Almeida MG, et al. (2015) Analysis of Portuguese Residential Building and Proposed Solutions, Connecting People and Ideas. In: Proceedings of EURO ELECS, Guimarães, Portugal. |
[70] | Noocity: Urban Ecology. Available from: https://www.noocity.com/pt-pt/#. |
[71] | Huang R, Hawley D (2009) A data model and internet GIS framework for safe routes to school. URISA J 21: 21-30. |
[72] | Salvo G, Sabatini S (2014) Advanced or and AI methods in transportation a Gis approach to evaluate bus stop accessibility. Available from: http://www.iasi.cnr.it/ewgt/16conference/ID108.pdf. |
[73] | Scheurer J, Curtis C (2007) Accessibility measures: Overview and practical applications. Urbanet Department of Urban and Regional Planning, Curtin University. |
[74] | Geurs K, Ritsema van Eck J (2001) Accessibility measures: review and applications, evaluation of accessibility impacts of land-use transport scenarios and related social and economic impacts. Rese Man Environ 408505 006. |
[75] | Achuthan K, Titheridge H, Mackett RL (2007) Measuring pedestrian accessibility. In: Winstanley, Proceedings of the Geographical Information Science Research, National University of Ireland, Maynooth, UK, vol. 11-13, 264-269. |
[76] |
Bhatti M, Church A (2004) Home the culture of nature and meanings of gardens in late modernity. Housing Studies 19: 37-51. doi: 10.1080/0267303042000152168
![]() |
[77] |
Coolen H, Meesters J (2012) Private and public green spaces: meaningful but different settings. J Hous Built Environ 27:49-67. doi: 10.1007/s10901-011-9246-5
![]() |
[78] | Boumeester HJFM, Dol K., Meesters J (2009) Stedelijk wonen: een brug tussen wens en werkelijkheid. Een onderzoek naar woonwensen en woonproducten bij binnenstedelijk bouwen (Urban living: bridging preferences and reality. Housing preference and housing products for urban development). Voorburg: NVB. |
[79] | Bernardini C, Irvine KN (2007) The 'nature' of urban sustainability: private or public green spaces. In: A. Kungolas, C. A. Brebbia, & E. Beriatos, (Eds.), Sustainable development and planning III, volume 2, WIT Press: 661-674. |
[80] |
Russo A, Cirella G (2018) Modern Compact Cities: How Much Greenery Do We Need? Int J Environ Res Public Health 15: 2180. doi: 10.3390/ijerph15102180
![]() |
[81] |
Oliver LN, Schuurman N, Hall AW (2007) Comparing circular and network buffers to examine the influence of land use on walking for leisure and errands. Int J Health Geograph 6: 41. doi: 10.1186/1476-072X-6-41
![]() |
[82] | Lyytimäki J, Petersen LK, Normander B, et al. (2008) Nature as a nuisance? Ecosystem services and disservices to urban lifestyle. J Environ Sci 5 (3): 161-172. |
1. | Itxaro Latasa, Angela Laurenz, Juan Sádaba, Urban Green Infrastructure as a Strategy to Address Urban Energy Efficiency and Sustainability. A Case Study of Milagrosa (Pamplona), 2021, 14, 2071-1050, 28, 10.3390/su14010028 | |
2. | Anna Carolina Dall’Aneze Ferreira, Silvia Lenyra Meirelles Campos Titotto, Alessandra Cristina Santos Akkari, Urban Agriculture 5.0: An Exploratory Approach to the Food System in a Super Smart Society, 2022, 7, 2455-7749, 455, 10.33889/IJMEMS.2022.7.4.030 | |
3. | Angela Barseghyan, Sandra Serafin, Anna Kostyakova, Ghazwan Saleem Naamo, Moataz Ibrahim Qinbr, Financial and analytical assessment of the costs of maintaining large urban park spaces in the Mediterranean on the example of Barcelona, 2023, 26, 2709-8877, 10.48077/scihor4.2023.108 | |
4. | Josep Pueyo-Ros, Mateja Škerjanec, Joana A.C. Castellar, Nataša Atanasova, Joaquim Comas, Lluís Corominas, Beyond food: A stochastic model to estimate the contributions of urban agriculture to sustainability, 2024, 241, 01692046, 104930, 10.1016/j.landurbplan.2023.104930 |
Potential green areas in rooftops | Number blocks | Number of residential buildings | Number of residents in proposed green block buildings |
Blocks of buildings with 3 or more floors | 388 | 1041 | 21221 |
Blocks of buildings with 5 or more floors | 221 | 541 | 16167 |
Blocks of buildings with 7 or more floors | 108 | 239 | 9488 |
Greenspaces | Standard distance (m) | Residential buildings close to greenspaces (%) | Inhabitants in buildings close to public greenspaces (%) | Residents in private green buildings (%) |
Public greenspaces greater then 5000 m2 | 300 | 34.1 | 29.1 | - |
Public greenspaces greater then 400 m2 and smaller then 5000 m2 | 300 | 41.5 | 39.2 | - |
Public greenspaces greater then 400 m2 | 300 | 75.6 | 68.3 | - |
Proposed green roofs in potential green buildings located in poor greenspaces provision | - | 0.2 | - | 1.3 |
Proposed green roofs in potential blocks of buildings located in poor greenspaces provision | - | 2.8 | - | 11.2 |
Total (sustainable strategy proposal) | - | 78.4 | 79.5 |