Climate change is one of the main factors causing environmental variations that affect the crops in agriculture worldwide. These variations are expected to not only continue, but also to increase, putting future agricultural production and food security at risk. In this work, an agroclimatic monitoring system for greenhouses composed of three main parts: monitoring stations, a wireless communication network, and a data processing and visualization platform is proposed. The aim of this work is to provide a technological solution based on the Internet of Things (IoT) that helps the agricultural sector to avoid crop losses due to climate change. The proposed system consists of several monitoring stations inside and outside the greenhouse, with multiple sensors to measure temperature, relative humidity, soil humidity, wind speed, wind direction, precipitation, radiation, pH, and electroconductivity. The information generated by the sensors is pre-processed and temporarily stored in the LinkIt Smart 7688 Duo microcontroller. Then, this information is sent via wireless through the inbuilt Wi-Fi module of the stations to the Thinger.io platform, where the data is processed, analyzed, and presented in real time in graphical form. Authorized users have access to this platform and can visualize the collected data from any electronic device with Internet access, following protocols to guarantee the security of the system. Using open hardware and open-source tools, and based on the IoT concept, a low-cost greenhouse monitoring system with six internal monitoring stations, one external monitoring station, and one portable monitoring station, that costs US, 180.00 was implemented. The results show that the total energy consumption of the system is approximately 20W, with a very good performance in terms of sampling time. This system was implemented in a 5000 square meter greenhouse with melon crops, where tests to evaluate the network performance within each zone in the greenhouse allowed us to consider WiFi technology to improve network coverage. Also, maximum, minimum, and average measurement values were evaluated to determine the critical levels recorded by the different sensors of agroclimatic variables during the period of study. The proposed system demonstrated to provide the agricultural sector with a low-cost, efficient, and easy-to-use tool to monitor agroclimatic variables in greenhouses that can help to prevent undesired climatic variations in advance, thus guaranteeing adequate conditions and reducing losses in production.
Citation: Edwin Collado, Euribiel Valdés, Antony García, Yessica Sáez. Design and implementation of a low-cost IoT-based agroclimatic monitoring system for greenhouses[J]. AIMS Electronics and Electrical Engineering, 2021, 5(4): 251-283. doi: 10.3934/electreng.2021014
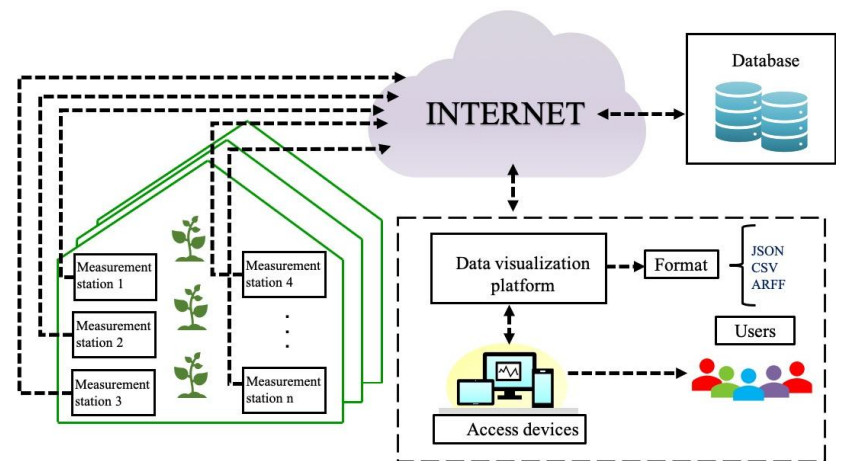
Climate change is one of the main factors causing environmental variations that affect the crops in agriculture worldwide. These variations are expected to not only continue, but also to increase, putting future agricultural production and food security at risk. In this work, an agroclimatic monitoring system for greenhouses composed of three main parts: monitoring stations, a wireless communication network, and a data processing and visualization platform is proposed. The aim of this work is to provide a technological solution based on the Internet of Things (IoT) that helps the agricultural sector to avoid crop losses due to climate change. The proposed system consists of several monitoring stations inside and outside the greenhouse, with multiple sensors to measure temperature, relative humidity, soil humidity, wind speed, wind direction, precipitation, radiation, pH, and electroconductivity. The information generated by the sensors is pre-processed and temporarily stored in the LinkIt Smart 7688 Duo microcontroller. Then, this information is sent via wireless through the inbuilt Wi-Fi module of the stations to the Thinger.io platform, where the data is processed, analyzed, and presented in real time in graphical form. Authorized users have access to this platform and can visualize the collected data from any electronic device with Internet access, following protocols to guarantee the security of the system. Using open hardware and open-source tools, and based on the IoT concept, a low-cost greenhouse monitoring system with six internal monitoring stations, one external monitoring station, and one portable monitoring station, that costs US, 180.00 was implemented. The results show that the total energy consumption of the system is approximately 20W, with a very good performance in terms of sampling time. This system was implemented in a 5000 square meter greenhouse with melon crops, where tests to evaluate the network performance within each zone in the greenhouse allowed us to consider WiFi technology to improve network coverage. Also, maximum, minimum, and average measurement values were evaluated to determine the critical levels recorded by the different sensors of agroclimatic variables during the period of study. The proposed system demonstrated to provide the agricultural sector with a low-cost, efficient, and easy-to-use tool to monitor agroclimatic variables in greenhouses that can help to prevent undesired climatic variations in advance, thus guaranteeing adequate conditions and reducing losses in production.

| [1] | Tol RSJ (2009) The economic effects of climate change. JEP 23: 29–51. |
| [2] | Hardy JT (2003) Climate change: causes, effects, and solutions, Chichister, West Sussex, England: John Wiley & Sons. |
| [3] | Nelson GC, Valin H, Sands RD, et al. (2014) Climate change effects on agriculture: Economic responses to biophysical shocks. PNAS 111: 3274‒3279. |
| [4] | Gregory PJ, Ingram JSI, Brklacich M (2005) Climate change and food security. Philos Trans R Soc Lond B Biol Sci 360: 2139‒2148. |
| [5] | Wheeler T, Von Braun T (2013) Climate change impacts on global food security. Science 341: 508‒513. |
| [6] | Altieri MA, Nicholls CI (2009) Cambio climático y agricultura campesina: impactos y respuestas adaptativas. LEISA 14: 5‒8. |
| [7] | Nelson GC, Rosegrant MW, Koo J, et al. (2009) Climate change: impact on agriculture and costs of adaptation. International Food Policy Research Institute (IFPRI) 21. |
| [8] | Conde-Álvarez C, Saldaña-Zorrilla SO (2009) Cambio climático en América Latina y el Caribe: impactos, vulnerabilidad y adaptación. Ambiente Desarro 23: 23‒30. |
| [9] | Rodríguez AG, López TT, Meza LE, et al. (2015) Innovaciones institucionales y en políticas sobre agricultura y cambio climático Evidencia en América Latina y el Caribe. Comisión Económica para América Latina y el Caribe (CEPAL). |
| [10] | Mora J, Ordaz JL, Acosta A, et al. (2010) Panamá: efectos del cambio climático sobre la agricultura. Comisión Económica para América Latina y el Caribe (CEPAL). |
| [11] | Gameda S, Loboguerrero AM, Boa M, et al. (2014) Estado del Arte en Cambio Climático, Agricultura y Seguridad Alimentaria en Panamá. CGIAR Research Program on Climate Change, Agriculture and Food Security (CCAFS). |
| [12] | Valdés E, Collado E, Saéz Y (2020) IoT-based system for temperature and relative humidity monitoring in greenhouses. In Proceedings of the 18th LACCEI International Multi-Conference for Engineering, Education, and Technology "Industry, innovation, and infrastructure for sustainable cities and communities", Virtual Edition. |
| [13] | Grubb M (2004) Technology innovation and climate change policy: an overview of issues and options. Keio Econ Stud 41:103‒132. |
| [14] | Gans JS (2012) Innovation and climate change policy. Am Econ J Econ Policy 4: 125‒45. |
| [15] | Ruiz-Garcia L, Lunadei L, Barreiro P, et al. (2009) A review of wireless sensor technologies and applications in agriculture and food industry: state of the art and current trends. Sensors 9: 4728‒4750. |
| [16] | Anisi MH, Abdul-Salaam G, Abdullah AH (2015) A survey of wireless sensor network approaches and their energy consumption for monitoring farm fields in precision agriculture. Precision Agric 16: 216–238. |
| [17] | Xiaoyan Z, Xiangyang Z, Chen D, et al. (2013) The design and implementation of the greenhouse monitoring system based on GSM and RF technologies. In Proceedings of the International Conference on Computational Problem-Solving (ICCP), Jiuzhai, China, 32‒35. |
| [18] | Huang H, Bian H, Zhu S, et al. (2011) A greenhouse remote monitoring system based on GSM. 2011 IEEE International Conference on Information Management, Innovation Management and Industrial Engineering, Shenzhen, China, 357‒360. |
| [19] | Chen F, Qin L, Li X, et al. (2017) Design and implementation of ZigBee wireless sensor and control network system in greenhouse. In Proceedings of the 36th Chinese Control Conference (CCC), Dalian, China, 8982‒8986. |
| [20] | Li B, Ling Y, Tian M, et al. (2018) Design and implementation of sugarcane growth monitoring system based on RFID and ZigBee. IJOE 14: 96‒106. |
| [21] | Baviskar J, Mulla A, Baviskar A, et al. (2014) Real Time Monitoring and Control System for Green House Based on 802.15.4 Wireless Sensor Network. In 2014 Fourth International Conference on Communication Systems and Network Technologies, Bhopal, India, 98‒103. |
| [22] | Bayrakdar ME (2020) Energy-efficient technique for monitoring of agricultural areas with terrestrial wireless sensor networks. J Circuits Syst Comput 29: 1‒17. |
| [23] | Bayrakdar ME (2020) Employing sensor network based opportunistic spectrum utilization for agricultural monitoring. Sustain Comput Inform Syst 27: 1‒10. |
| [24] | Rode PC, Gamarra RR, Espinosa Hp, et al. (2010) Invernadero Inteligente basado en un Enfoque Sustentable para la Agricultura Mexicana. Memorias del Ⅷ Congreso Internacional sobre Innovación y Desarrollo Tecnológico, Cuernavaca Morelos, México, 623‒630. |
| [25] | Rojas LJ, Veintimilla JL (2018) Desarrollo de un sistema de telecontrol predictivo para un invernadero usando tecnología Clouding para la empresa Green-House en Quito. Bachelor thesis, Universidad Politécnica Salesiana, Ecuador. |
| [26] | Collado E, Fossatti A, Sáez Y (2018) Smart farming: A potential solution towards a modern and sustainable agriculture in Panama. AIMS Agric Food 4: 266‒284. |
| [27] | Ray PP (2018) A survey on Internet of Things architectures. J King Saud Univ Comp Info Sci 30: 291‒319. |
| [28] | Elijah O, Rahman TA, Orikumhi I, et al. (2018) An Overview of Internet of Things (IoT) and Data Analytics in Agriculture: Benefits and Challenges. IEEE Internet Things 5: 3758‒3773. |
| [29] | Kumar DC, Adiraju RV, Pasupuleti S, et al. (2021) A Review of Smart Greenhouse Farming by Using Sensor Network Technology. In Proceedings of International Conference on Recent Trends in Machine Learning, IoT, Smart Cities and Applications, Hyderabad, India, 849‒856 |
| [30] | Dan L, Xin C, Chongwei C, et al. (2015) Intelligent Agriculture Greenhouse Environment Monitoring System Based on IOT Technology, In 2015 International Conference on Intelligent Transportation, Big Data and Smart City, Halong Bay, Vietnam, 487‒490. |
| [31] | Vimal PV, Shivaprakasha KS (2017) IOT based greenhouse environment monitoring and controlling system using Arduino platform. In 2017 International Conference on Intelligent Computing, Instrumentation and Control Technologies (ICICICT), Kerala, India, 1514‒1519. |
| [32] | Pallavi S, Mallapur JD, Bendigeri KY (2017) Remote sensing and controlling of greenhouse agriculture parameters based on IoT. In 2017 International Conference on Big Data, IoT and Data Science (BID), Pune, India, 44‒48. |
| [33] | Texas Instruments. Texas Instruments MAX3232 3-V to 5.5-V Multichannel RS-232 Line Driver/Receiver With ±15-kV ESD Protection, 2017. Available from: https://www.ti.com/lit/ds/symlink/max3232.pdf. |
| [34] | Seeed Studio. LinkIt Smart 7688 Duo. Available from: https://wiki.seeedstudio.com/LinkIt_Smart_7688_Duo/ |
| [35] | Aosong(Guangzhou) Electronics Co., Ltd. Direnc Temperature and humidity module AM2301. Available from: https://pdf.direnc.net/upload/dht21-am2301-datasheet.pdf |
| [36] | Dataflow Systems Ltd. Dataflow System Ltd Environmental Monitoring Odyssey Soil Moisture Logger. Available from: http://odysseydatarecording.com/download/Odyssey%20Soil%20Moisture%20Logger.pdf |
| [37] | Sparkfun Weather Sensor Assembly. Available from: https://www.sparkfun.com/datasheets/Sensors/Weather/Weather%20Sensor%20Assembly..pdf |
| [38] | Rohm Semiconductor. Digi-Key Electronics ML8511 Datasheet. Available from: https://www.digikey.com/htmldatasheets/production/1342229/0/0/1/ml8511-datasheet.html |
| [39] | EC/pH Transmitters Model A1005. Available from: https://sites.google.com/prod/view/ecphtransmitters/products/model-a1005?authuser=0 |
| [40] | HUAWEI 4G Wingle E8372. Available from: https://consumer.huawei.com/en/routers/e8372/specs/ |
| [41] | TP-link Portable 3G/4G Wireless N Router. Available from: https://static.tp-link.com/2017/201712/20171207/TL-MR3020(EU)_3.20.pdf |
| [42] | Thinger.io Documentation Arduino. Available from: https://docs.thinger.io/quick-sart/devices/arduino |
| [43] | Bustamante AL, Patricio MA, Molina JM (2019) Thinger. io: An open-source platform for deploying data fusion applications in IoT environments. Sensors 19: 1044. |
| [44] | Garcia A, Sáez Y, Chang I (2017) Interfaz para la adquisición de datos en tiempo real basado en un datalogger de nivel de agua de efecto capacitivo. In Proceedings of the 15th LACCEI International Multi-Conference for Engineering, Education, and Technology "Global Partnership for Development and Engineering Education", Boca Raton, FL, United States. |
| [45] | Botella-Campos M, Parra L, Sendra S, et al. (2020) WLAN IEEE 802.11 b/g/n Coverage Study for Rural Areas. In 2020 International Conference on Control, Automation and Diagnosis (ICCAD), IEEE, Paris, France. |
| [46] | Sendra S, Fernandez P, Turro C, et al. (2010) IEEE 802.11 a/b/g/n Indoor Coverage and Performance Comparison. In 2010 6th International Conference on Wireless and Mobile Communications, IEEE, Valencia, Spain. |
| [47] | Bayrakdar ME (2020) Enhancing sensor network sustainability with fuzzy logic-based node placement approach for agricultural monitoring. Comput Electron Agr 174: 105461. |
| [48] | Martez de Miranda NG, Rhona Díaz R, Solis D (2014) Caracterización y análisis de la cadena productiva del melón de exportación en la región de Azuero, República de Panamá. Proceedings of the Sixth International Symposiym on Energy & Technology Innovation Forum, Puerto Rico Energy Center-Laccei, Puerto Rico. |
| [49] | Ruiz C (2017) Efecto de la exposición a luz ultravioleta sobre la calidad y el desarrollo de patógenos en poscosecha de frutos de melón (Cucumis melo L.). Tesis, Repositorio del SIBDI-UCR, Facultad de Ciencias Agroalimentarias, Universidad de Costa Rica. Available from: http://repositorio.sibdi.ucr.ac.cr:8080/jspui/handle/123456789/4899. |
| [50] | Mármol JR (2008) Cultivo del melón en invernadero, Consejería de Agricultura y Pesca, Servicio de Publicaciones y Divulgación, Junta de Andalucía. |
| [51] | Torres AP, Camberato D, López RG, et al. (2010) Producción Comercial de Cultivos Bajo Invernadero Y Vivero. Medición de pH y Conductividad Eléctrica en Sustratos. Departamento de Horticultura y Arquitectura de Áreas Verdes, Purdue Extension, Purdue University. |


Figures(22) / Tables(9)

Edwin Collado, Euribiel Valdés, Antony García, Yessica Sáez. Design and implementation of a low-cost IoT-based agroclimatic monitoring system for greenhouses[J]. AIMS Electronics and Electrical Engineering, 2021, 5(4): 251-283. doi: 10.3934/electreng.2021014


 DownLoad: