Nucleotide and amino acid sequences at the N-terminus affect the expression level and cytotoxicity of proteins; however, their effects are not fully understood yet. Here, N-terminal 30 nucleotide/10 amino acid (N10) sequences that affect the expression level and cytotoxicity of a green fluorescent protein were systematically isolated in the budding yeast Saccharomyces cerevisiae. The expression per gene (EPG) and gene copy number limit (CNL) relationships were examined to assess the effects of the N10 sequence. The isolated N10 nucleotide sequences suggested that codon optimality is the major determinant of the protein expression level. A higher number of hydrophobic or cysteine residues in the N10 sequence seemed to increase the cytotoxicity of the protein. Therefore, a high frequency of specific amino acid residues in the outside of the main tertiary structure of proteins might not be preferable.
Citation: Hisao Moriya. The expression level and cytotoxicity of green fluorescent protein are modulated by an additional N-terminal sequence[J]. AIMS Biophysics, 2020, 7(2): 121-132. doi: 10.3934/biophy.2020010
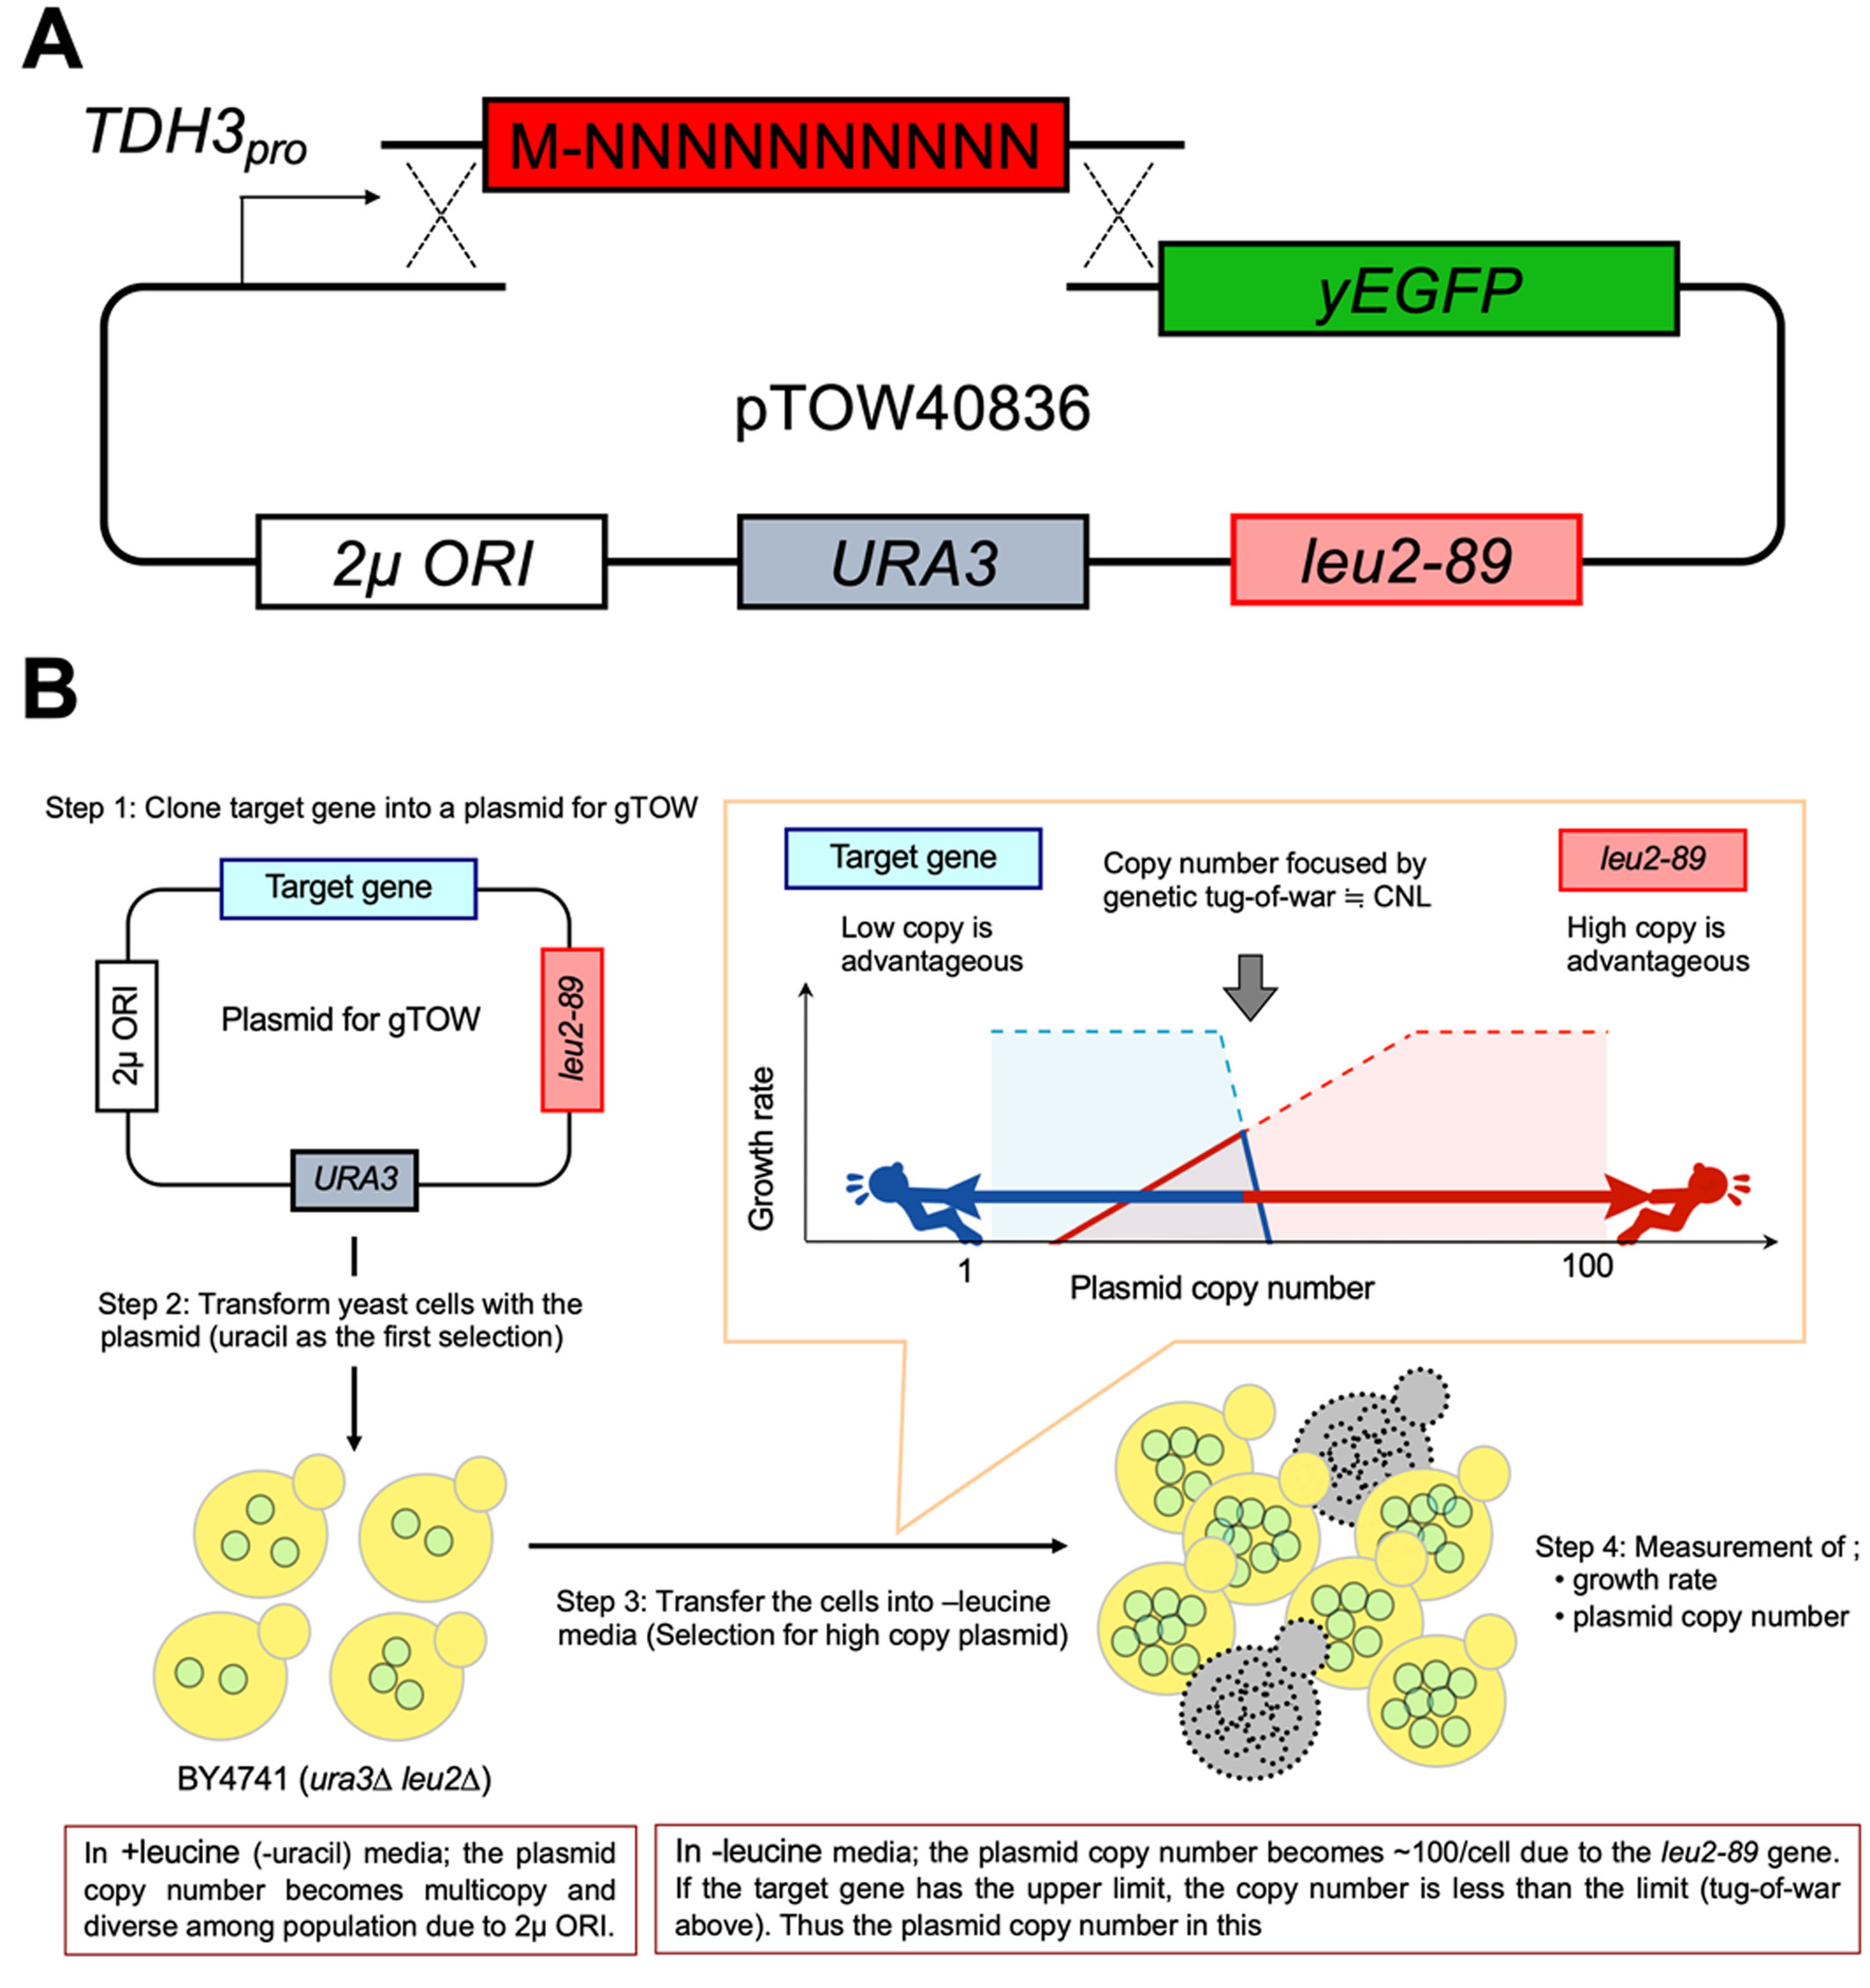
Nucleotide and amino acid sequences at the N-terminus affect the expression level and cytotoxicity of proteins; however, their effects are not fully understood yet. Here, N-terminal 30 nucleotide/10 amino acid (N10) sequences that affect the expression level and cytotoxicity of a green fluorescent protein were systematically isolated in the budding yeast Saccharomyces cerevisiae. The expression per gene (EPG) and gene copy number limit (CNL) relationships were examined to assess the effects of the N10 sequence. The isolated N10 nucleotide sequences suggested that codon optimality is the major determinant of the protein expression level. A higher number of hydrophobic or cysteine residues in the N10 sequence seemed to increase the cytotoxicity of the protein. Therefore, a high frequency of specific amino acid residues in the outside of the main tertiary structure of proteins might not be preferable.

| [1] |
Moriya H (2015) Quantitative nature of overexpression experiments. Mol Biol Cell 26: 3932-3939. doi: 10.1091/mbc.E15-07-0512

|
| [2] |
Eguchi Y, Makanae K, Hasunuma T, et al. (2018) Estimating the protein burden limit of yeast cells by measuring the expression limits of glycolytic proteins. Elife 7: e34595. doi: 10.7554/eLife.34595
|
| [3] |
Piatkevich KD, Verkhusha VV (2011) Guide to red fluorescent proteins and biosensors for flow cytometry. Method Cell Biol 102: 431-461. doi: 10.1016/B978-0-12-374912-3.00017-1
|
| [4] |
Ansari AM, Ahmed AK, Matsangos AE, et al. (2016) Cellular GFP toxicity and immunogenicity: potential confounders in in vivo cell tracking experiments. Stem Cell Rev Rep 12: 553-559. doi: 10.1007/s12015-016-9670-8
|
| [5] |
Kintaka R, Makanae K, Moriya H (2016) Cellular growth defects triggered by an overload of protein localization processes. Sci Rep 6: 1-11. doi: 10.1038/srep31774
|
| [6] |
Geiler-Samerotte KA, Dion MF, Budnik BA, et al. (2011) Misfolded proteins impose a dosage-dependent fitness cost and trigger a cytosolic unfolded protein response in yeast. P Natl Acad Sci 108: 680-685. doi: 10.1073/pnas.1017570108
|
| [7] |
Kafri M, Metzl-Raz E, Jona G, et al. (2016) The cost of protein production. Cell Rep 14: 22-31. doi: 10.1016/j.celrep.2015.12.015
|
| [8] |
Shah P, Ding Y, Niemczyk M, et al. (2013) Rate-limiting steps in yeast protein translation. Cell 153: 1589-1601. doi: 10.1016/j.cell.2013.05.049
|
| [9] |
Kats I, Khmelinskii A, Kschonsak M, et al. (2018) Mapping degradation signals and pathways in a eukaryotic N-terminome. Mol Cell 70: 488-501. doi: 10.1016/j.molcel.2018.03.033
|
| [10] |
Kudla G, Murray AW, Tollervey D, et al. (2009) Coding-sequence determinants of gene expression in Escherichia coli. Science 324: 255-258. doi: 10.1126/science.1170160
|
| [11] |
Chen X, Zaro JL, Shen WC (2013) Fusion protein linkers: property, design and functionality. Adv Drug Deliver Rev 65: 1357-1369. doi: 10.1016/j.addr.2012.09.039
|
| [12] |
Kalderon D, Roberts BL, Richardson WD, et al. (1984) A short amino acid sequence able to specify nuclear location. Cell 39: 499-509. doi: 10.1016/0092-8674(84)90457-4
|
| [13] |
Xu D, Marquis K, Pei J, et al. (2015) LocNES: a computational tool for locating classical NESs in CRM1 cargo proteins. Bioinformatics 31: 1357-1365. doi: 10.1093/bioinformatics/btu826
|
| [14] |
Yarimizu T, Nakamura M, Hoshida H, et al. (2015) Synthetic signal sequences that enable efficient secretory protein production in the yeast Kluyveromyces marxianus. Microb Cell Fact 14: 20. doi: 10.1186/s12934-015-0203-y
|
| [15] |
Einhauer A, Jungbauer A (2001) The FLAG™ peptide, a versatile fusion tag for the purification of recombinant proteins. J Biochem Biophys Methods 49: 455-465. doi: 10.1016/S0165-022X(01)00213-5
|
| [16] |
Hochuli E (1990) Purification of recombinant proteins with metal chelate adsorbent. Genetic Engineering Boston: Springer, 87-98. doi: 10.1007/978-1-4613-0641-2_6
|
| [17] |
Royant A, Noirclerc-Savoye M (2011) Stabilizing role of glutamic acid 222 in the structure of Enhanced Green Fluorescent Protein. J Struct Biol 174: 385-390. doi: 10.1016/j.jsb.2011.02.004
|
| [18] |
Baker Brachmann C, Davies A, Cost GJ, et al. (1998) Designer deletion strains derived from Saccharomyces cerevisiae S288C: a useful set of strains and plasmids for PCR-mediated gene disruption and other applications. Yeast 14: 115-132. doi: 10.1002/(SICI)1097-0061(19980130)14:2<115::AID-YEA204>3.0.CO;2-2
|
| [19] |
Makanae K, Kintaka R, Makino T, et al. (2013) Identification of dosage-sensitive genes in Saccharomyces cerevisiae using the genetic tug-of-war method. Genome Res 23: 300-311. doi: 10.1101/gr.146662.112
|
| [20] | Amberg DC, Burke D, Strathern JN (2005) Methods in Yeast Genetics: A Cold Spring Harbor Laboratory Course Manual Plainview: Cold Spring Harbor Laboratory Press. |
| [21] |
Kevin RO, Vo KT, Michaelis S, et al. (1997) Recombination-mediated PCR-directed plasmid construction in vivo in yeast. Nucleic Acids Res 25: 451-452. doi: 10.1093/nar/25.2.451
|
| [22] |
Moriya H, Shimizu-Yoshida Y, Kitano H (2006) In vivo robustness analysis of cell division cycle genes in Saccharomyces cerevisiae. PLoS Genet 2: e111. doi: 10.1371/journal.pgen.0020111
|
| [23] |
Cormack BP, Bertram G, Egerton M, et al. (1997) Yeast-enhanced green fluorescent protein (yEGFP): a reporter of gene expression in Candida albicans. Microbiology 143: 303-311. doi: 10.1099/00221287-143-2-303
|
| [24] |
Moriya H, Makanae K, Watanabe K, et al. (2012) Robustness analysis of cellular systems using the genetic tug-of-war method. Mol BioSyst 8: 2513-2522. doi: 10.1039/c2mb25100k
|
| [25] |
Zuker M (2003) Mfold web server for nucleic acid folding and hybridization prediction. Nucleic Acids Res 31: 3406-3415. doi: 10.1093/nar/gkg595
|
| [26] | Sabi R, Volvovitch Daniel R, Tuller T (2017) stAIcalc: tRNA adaptation index calculator based on species-specific weights. Bioinformatics 33: 589-591. |
| [27] |
Almagro Armenteros JJ, Sønderby CK, Sønderby SK, et al. (2017) DeepLoc: prediction of protein subcellular localization using deep learning. Bioinformatics 33: 3387-3395. doi: 10.1093/bioinformatics/btx431
|
| [28] |
Kyte J, Doolittle RF (1982) A simple method for displaying the hydropathic character of a protein. J Mol Biol 157: 105-132. doi: 10.1016/0022-2836(82)90515-0
|
| [29] |
Krogh A, Larsson BÈ, Von Heijne G, et al. (2001) Predicting transmembrane protein topology with a hidden Markov model: application to complete genomes. J Mol Biol 305: 567-580. doi: 10.1006/jmbi.2000.4315
|
| [30] |
Drozdetskiy A, Cole C, Procter J, et al. (2015) JPred4: a protein secondary structure prediction server. Nucleic Acids Res 43: W389-W394. doi: 10.1093/nar/gkv332
|
| [31] |
Park SH, Kukushkin Y, Gupta R, et al. (2003) PolyQ proteins interfere with nuclear degradation of cytosolic proteins by sequestering the Sis1p chaperone. Cell 154: 134-145. doi: 10.1016/j.cell.2013.06.003
|
| [32] |
Ford AE, Denicourt C, Morano KA (2019) Thiol stress–dependent aggregation of the glycolytic enzyme triose phosphate isomerase in yeast and human cells. Mol Biol Cell 30: 554-565. doi: 10.1091/mbc.E18-10-0616
|
| [33] |
Stein KC, Frydman J (2019) The stop-and-go traffic regulating protein biogenesis: How translation kinetics controls proteostasis. J Biol Chem 294: 2076-2084. doi: 10.1074/jbc.REV118.002814
|
 biophy-07-02-010-s001.docx biophy-07-02-010-s001.docx |
 |


Figures(5) / Tables(1)

Hisao Moriya. The expression level and cytotoxicity of green fluorescent protein are modulated by an additional N-terminal sequence[J]. AIMS Biophysics, 2020, 7(2): 121-132. doi: 10.3934/biophy.2020010


 DownLoad: