The study's main objective was to evaluate the bone density and osseointegration around dental implants with two different implant surfaces with early loading, using a micro-CT device. Twenty-four Fixo® implants (Oxyimplant, Biomec Italy) 3.5 × 8.5 mm with Laser (test group) and acid-etched surface (control group) were placed in six young beagle dog's mandibles. MicroCT (Albira, Germay) evaluation with seven regions of interest was defined in each implant on two different surfaces. A total of 168 sites were studied, and four isocountours were also done in each implant at coronal, transversal, and sagittal scanned areas to evaluate bone density location. The effect on the bone evaluation of two different surfaces variables was evaluated at the mesial and distal positions, showing crestal, medial, and apical types of bone density. Implant positions (P2, P3, P4, and M1) were also analyzed to determine bone density areas. The results of hard tissue density indicated a statistical significance for laser surface at crestal ROIs level (p < 0.001) and position of implants (p = 0.032) related to P3 areas compared to the acid-etched surface in Fixo® implants. Density D4 was the most common type of bone surrounding Fixo® standard implants at three different positions and density D3 was the most found on Fixo® laser surfaces. Micro-CT evaluation was a powerful tool for measuring the type of bone quality and location surrounding dental implants. Micro-CT study revealed that the most common density type found around Fixo® laser surface (test) implants was density D3 at the mesial and distal coronal part and density D4 at the middle and apical part. Fixo® implant with acid-etched surface showed the type of density D4 bone in hole implant at 3 months follow-up. It is a complementary histologic and histomorphometric analysis method for implant surrounding bone density.
Citation: Jose Luis Calvo-Guirado, Nuria García Carrillo, Félix de Carlos-Villafranca, Miguel Angel Garces-Villala, Lanka Mahesh, Juan Carlos Ibanez, Francisco Martinez-Martinez. A micro-CT evaluation of bone density around two different types of surfaces on one-piece fixo implants with early loading-an experimental study in dogs at 3 months[J]. AIMS Bioengineering, 2022, 9(4): 383-399. doi: 10.3934/bioeng.2022028
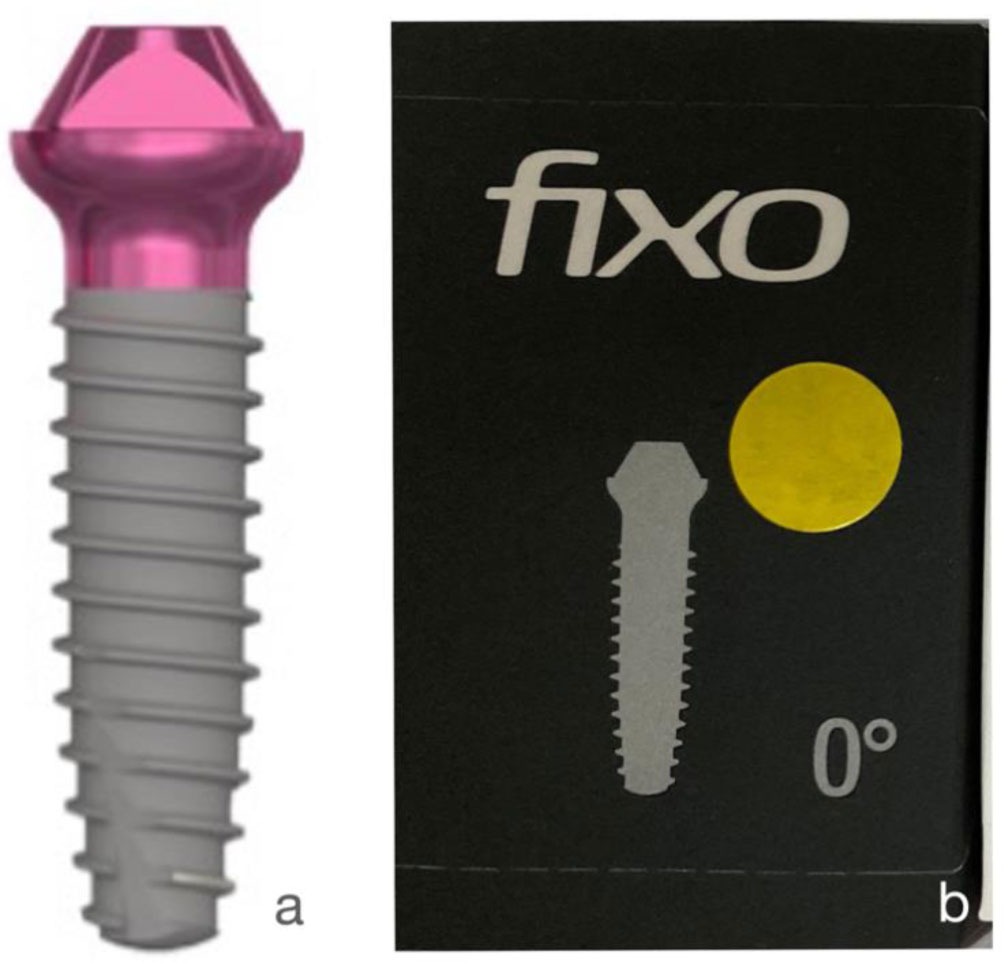
The study's main objective was to evaluate the bone density and osseointegration around dental implants with two different implant surfaces with early loading, using a micro-CT device. Twenty-four Fixo® implants (Oxyimplant, Biomec Italy) 3.5 × 8.5 mm with Laser (test group) and acid-etched surface (control group) were placed in six young beagle dog's mandibles. MicroCT (Albira, Germay) evaluation with seven regions of interest was defined in each implant on two different surfaces. A total of 168 sites were studied, and four isocountours were also done in each implant at coronal, transversal, and sagittal scanned areas to evaluate bone density location. The effect on the bone evaluation of two different surfaces variables was evaluated at the mesial and distal positions, showing crestal, medial, and apical types of bone density. Implant positions (P2, P3, P4, and M1) were also analyzed to determine bone density areas. The results of hard tissue density indicated a statistical significance for laser surface at crestal ROIs level (p < 0.001) and position of implants (p = 0.032) related to P3 areas compared to the acid-etched surface in Fixo® implants. Density D4 was the most common type of bone surrounding Fixo® standard implants at three different positions and density D3 was the most found on Fixo® laser surfaces. Micro-CT evaluation was a powerful tool for measuring the type of bone quality and location surrounding dental implants. Micro-CT study revealed that the most common density type found around Fixo® laser surface (test) implants was density D3 at the mesial and distal coronal part and density D4 at the middle and apical part. Fixo® implant with acid-etched surface showed the type of density D4 bone in hole implant at 3 months follow-up. It is a complementary histologic and histomorphometric analysis method for implant surrounding bone density.

| [1] |
Ramezanzadehkoldeh M, Skallerud BH (2017) MicroCT-based finite element models as a tool for virtual testing of cortical bone. Med Eng Phys 46: 12-20. https://doi.org/10.1016/j.medengphy.2017.04.011 
|
| [2] |
Cox TC (2020) Microcomputed tomography of craniofacial mineralized tissue: a practical user's guide to study planning and generating quality data. Bone 137: 115408. https://doi.org/10.1016/j.bone.2020.115408
|
| [3] |
Clark DP, Badea CT (2021) Advances in micro-CT imaging of small animals. Phys Med 88: 175-192. https://doi.org/10.1016/j.ejmp.2021.07.005
|
| [4] |
Ormianer Z, Matalon S, Block J, et al. (2016) Dental implant thread design and the consequences on long-term marginal bone loss. Implant Dent 25: 471-477. https://doi.org/10.1097/ID.0000000000000441
|
| [5] |
Abuhussein H, Pagni G, Rebaudi A, et al. (2010) The effect of thread pattern upon implant osseointegration. Clin Oral Implants Res 21: 129-136. https://doi.org/10.1111/j.1600-0501.2009.01800.x
|
| [6] | El-Gammal M, Ghoneem N, Tawfik H, et al. (2014) Early-loaded laser-sintered versus acid-etched one-piece dental implants for mandibular premolars replacement: a preliminary study. Implant Dent 23: 565-569. https://doi.org/10.1097/ID.0000000000000133 |
| [7] |
Valles C, Rodriguez-Ciurana X, Clementini M, et al. (2018) Influence of subcrestal implant placement compared with equicrestal position on the peri-implant hard and soft tissues around platform-switched implants: a systematic review and meta-analysis. Clin Oral Invest 22: 555-570. https://doi.org/10.1007/s00784-017-2301-1
|
| [8] |
Calvo-Guirado JL, Lopez-Lopez PJ, Mate Sanchez JE, et al. (2014) Crestal bone loss related to immediate implants in crestal and subcrestal position: a pilot study in dogs. Clin Oral Implants Res 25: 1286-1294. https://doi.org/10.1111/clr.12267
|
| [9] |
Negri B, Lopez Mari M, Mate Sanchez de Val JE, et al. (2015) Biological width formation to immediate implants placed at different level in relation to the crestal bone: an experimental study in dogs. Clin Oral Implants Res 26: 788-98. https://doi.org/10.1111/clr.12345
|
| [10] |
Perez-Albacete Martinez C, Vlahovic Z, Scepanovic M, et al. (2016) Submerged flapless technique vs. conventional flap approach for implant placement: experimental domestic pig study with 12-month follow-up. Clin Oral Implants Res 27: 964-968. https://doi.org/10.1111/clr.12665
|
| [11] |
Calvo-Guirado JL, Gomez-Moreno G, Delgado-Ruiz RA, et al. (2014) Clinical and radiographic evaluation of osseotite-expanded platform implants related to crestal bone loss: a 10-year study. Clin Oral Implants Res 25: 352-358. https://doi.org/10.1111/clr.12134
|
| [12] |
Bertl K, Heimel P, Rokl-Riegler M, et al. (2015) MicroCT-based evaluation of the trabecular bone quality of different implant anchorage sites for masticatory rehabilitation of the maxilla. J Craniomaxillofac Surg 43: 961-968. https://doi.org/10.1016/j.jcms.2015.04.008
|
| [13] |
Cooper D, Turinsky A, Sensen C, et al. (2007) Effect of voxel size on 3D micro-CT analysis of cortical bone porosity. Calcif Tissue Int 80: 211-219. https://doi.org/10.1007/s00223-005-0274-6
|
| [14] |
Ghaleh Golab K, Balouch A, Mirtorabi S (2016) One-year multicenter prospective evaluation of survival rates and bone resorption in one-piece implants. Clin Implant Dent Relat Res 18: 392-400. https://doi.org/10.1111/cid.12299
|
| [15] |
Duda M, Matalon S, Lewinstein I, et al. (2016) One piece immediately loaded implants versus 1 piece or 2 pieces delayed: 3 years outcome. Implant Dent 25: 109-113. https://doi.org/10.1097/ID.0000000000000343
|
| [16] | Rodriguez-Ciurana X, Vela-Nebot X, Segala-Torres M, et al. (2009) The effect of interimplant distance on the height of the interimplant bone crest when using platform-switched implants. Int J Periodontics Restorative Dent 29: 141-151. https://pubmed.ncbi.nlm.nih.gov/19408476 |
| [17] |
Kadkhodazadeh M, Safi Y, Moeintaghavi A, et al. (2019) Marginal bone loss around one-piece implants: a 10-year radiological and clinical follow-up evaluation. Implant Dent 28: 237-243. https://doi.org/10.1097/ID.0000000000000861
|
| [18] | Linkevicius T, Apse P, Grybauskas S, et al. (2009) The influence of soft tissue thickness on crestal bone changes around implants: a 1-year prospective controlled clinical trial. Int J Oral Maxillofac Implants 24: 712-719. https://pubmed.ncbi.nlm.nih.gov/19885413 |
| [19] |
Clementini M, Rossetti PH, Penarrocha D, et al. (2014) Systemic risk factors for peri-implant bone loss: a systematic review and meta-analysis. Int J Oral Maxillofac Surg 43: 323-334. https://doi.org/10.1016/j.ijom.2013.11.012
|
| [20] |
Romanos GE, Javed F, Delgado-Ruiz RA, et al. (2015) Peri-implant diseases: a review of treatment interventions. Dent Clin North Am 59: 157-178. https://doi.org/10.1016/j.cden.2014.08.002
|
| [21] |
Fickl S, Kebschull M, Calvo-Guirado JL, et al. (2015) Experimental peri-implantitis around different types of implants-a clinical and radiographic study in dogs. Clin Implant Dent Relat Res 17: e661-669. https://doi.org/10.1111/cid.12303
|
| [22] |
Bodic F, Amouriq Y, Gayet-Delacroix M, et al. (2012) Relationships between bone mass and micro-architecture at the mandible and iliac bone in edentulous subjects: a dual X-ray absorptiometry, computerised tomography and microcomputed tomography study. Gerodontology 29: e585-594. https://doi.org/10.1111/j.1741-2358.2011.00527.x
|
| [23] |
Hounsfield G.N. (1973) Computerized transverse axial scanning (tomography): description of system. Br J Radiol 46: 1016-1022. https://doi.org/10.1259/0007-1285-46-552-1016
|
| [24] |
Lopez-Valverde N, Lopez-Valverde A, Aragoneses JM, et al. (2021) Bone density around titanium dental implants coating tested/coated with chitosan or melatonin: an evaluation via microtomography in jaws of Beagle dogs. Coatings 11: 777. https://doi.org/10.3390/coatings110707
|
| [25] |
Irie MS, Rabelo G, Spin-Neto R, et al. (2018) Use of micro-computed tomography for bone evaluation in dentistry. Braz Dent J 29: 227-238. https://doi.org/10.1590/0103-6440201801979
|
| [26] |
Peyrin F (2011) Evaluation of bone scaffolds by micro-CT. Osteoporos Int 22: 2043-2048. https://doi.org/10.1007/s00198-011-1609-y
|
| [27] |
Young S, Kretlow JD, Nguyen C, et al. (2008) Microcomputed tomography characterization of neovascularization in bone tissue engineering applications. Tissue Eng Part B Rev 14: 295-306. https://doi.org/10.1089/ten.teb.2008.0153
|
| [28] |
Swain M, Xue J (2009) State of the art of Micro-CT applications in dental research. Int J Oral Sci 1: 177-188. https://doi.org/10.4248/ijos09031
|
| [29] | Lauren B, Pedro T, Felix G, et al. (2021) Assessment of trabecular bone during dental implant planning using cone-beam computed tomography with high-resolution parameters. TODENTJ 2021: 15-57. https://doi.org/10.2174/1874210602115010057 |
| [30] |
Zhang G, Pan XH, Liu Z, et al. (2011) Impaired bone healing pattern in mice with ovariectomy-induced osteoporosis: a drill-hole defect model. Bone 48: 1388-1400. https://doi.org/10.1016/j.bone.2011.03.720
|
| [31] |
Parsa A, Ibrahim N, Hassan B, et al. (2015) Bone quality evaluation at dental implant site using multislice CT, micro-CT, and cone beam CT. Clin Oral Implants Res 26: e1-7. https://doi.org/10.1111/clr.12315
|
| [32] | Calvo Guirado JL, Ortiz Ruiz AJ, Gomez Moreno G, et al. (2008) Immediate loading and immediate restoration in 105 expanded-platform implants via the diem system after a 16-month follow-up period. Med Oral Patol Oral Cir Bucal 13: E576-581. https://pubmed.ncbi.nlm.nih.gov/18758403 |
| [33] |
Enriquez-Sacristan C, Barona-Dorado C, Calvo-Guirado JL, et al. (2011) Immediate post-extraction implants subject to immediate loading: a meta-analytic study. Med Oral Patol Oral Cir Bucal 16: e919-924. https://doi.org/10.4317/medoral.16918
|
| [34] |
Balbinot GS, Leitune VCB, Ponzoni D, et al. (2019) Bone healing with niobium-containing bioactive glass composition in rat femur model: a micro-CT study. Dent Mater 35: 1490-1497. https://doi.org/10.1016/j.dental.2019.07.012
|
| [35] |
Jiang Y, Zhao J, Liao EY, et al. (2005) Application of micro-CT assessment of 3-D bone micro-structure in preclinical and clinical studies. J Bone Miner Metab 23: 122-131. https://doi.org/10.1007/bf03026336
|
| [36] | Van Dessel J, Nicolielo LF, Huang Y, et al. (2017) Accuracy and reliability of different cone beam computed tomography (CBCT) devices for structural analysis of alveolar bone in comparison with multislice CT and micro-CT. Eur J Oral Implantol 10: 95-105. https://pubmed.ncbi.nlm.nih.gov/28327698 |
| [37] | Cano J, Campo J, Vaquero JJ, et al. (2008) High resolution image in bone biology II. Review of the literature. Med Oral Patol Oral Cir Bucal 13: E31-E35. https://pubmed.ncbi.nlm.nih.gov/18167477 |
| [38] |
Tjong W, Nirody J, Burghardt AJ, et al. (2014) Structural analysis of cortical porosity applied to HR-pQCT data. Med Phys 41: 013701. https://doi.org/10.1118/1.4851575
|
| [39] |
Rabelo GD, Coutinho-Camillo C, Kowalski LP, et al. (2017) Evaluation of cortical mandibular bone in patients with oral squamous cell carcinoma. Clin Oral Investig 22: 783-790. https://doi.org/10.1007/s00784-017-2153-8
|
| [40] |
Blok Y, Gravesteijn F, van Ruijven L, et al. (2013) Micro-architecture and mineralization of the human alveolar bone obtained with microCT. Arch Oral Biol 58: 621-627. https://doi.org/10.1016/j.archoralbio.2012.10.001
|
| [41] |
Romao M, Marques M, Cortes A, et al. (2015) Micro-computed tomography and histomorphometric analysis of human alveolar bone repair induced by laser phototherapy: a pilot study. Int J Oral Maxillofac Surg 44: 1521-1528. https://doi.org/10.1016/j.ijom.2015.08.989
|
| [42] |
Norton MR, Gamble C (2001) Bone classification: an objective scale of bone density using the computerized tomography scan. Clin Oral Implant Res 12: 79-84. https://doi.org/10.1034/j.1600-0501.2001.012001079.x
|
| [43] | Annunziata M, Guida L (2015) The effect of titanium surface modifications on dental implant osseointegration. Craniofacial Sutures 17: 62-77. https://doi.org/10.1159/000381694 |
| [44] |
Junker R, Dimakis A, Thoneick M, et al. (2009) Effects of implant surface coatings and composition on bone integration: a systematic review. Clin Oral Implant Res 20: 185-206. https://doi.org/10.1111/j.1600-0501.2009.01777.x
|
| [45] |
Chavez MB, Chu EY, Kram V, et al. (2021) Guidelines for micro-computed tomography analysis of rodent dentoalveolar tissues. JBMR Plus 5: e10474. https://doi.org/10.1002/jbm4.10474
|
| [46] |
Molly L (2006) Bone density and primary stability in implant therapy. Clin Oral Implant Res 17: 124-135. https://doi.org/10.1111/j.1600-0501.2006.01356.x
|
| [47] |
De Smet E, Jaecques S, Wevers M, et al. (2006) Effect of controlled early implant loading on bone healing and bone mass in guinea pigs, as assessed by micro-CT and histology. Eur J Oral Sci 114: 232-242. https://doi.org/10.1111/j.1600-0722.2006.00355.x
|
| [48] |
Barrett JF, Keat N (2004) Artifacts in CT: recognition and avoidance. Radiographics 24: 1679-1691. https://doi.org/10.1148/rg.246045065
|
| [49] | Rebaudi A, Trisi P, Cella R, et al. (2010) Preoperative evaluation of bone quality and bone density using a novel CT/microCT based hard-normal-soft classification system. Int J Oral Maxillofac Implants 25: 75-85. https://pubmed.ncbi.nlm.nih.gov/20209189 |
| [50] | Rebaudi A, Koller B, Laib A, et al. (2004) Microcomputed tomographic analysis of the peri-implant bone. Int J Periodontics Restor Dent 24: 316-325. https://pubmed.ncbi.nlm.nih.gov/15446401 |
| [51] |
Song JW, Cha JY, Bechtold TE, et al. (2004) Influence of peri-implant artifacts on bone morphometric analysis with microcomputed tomography. Int J Oral Maxillofac Implants 28: 519-525. https://doi.org/10.11607/jomi.1632
|


Figures(10) / Tables(4)

Jose Luis Calvo-Guirado, Nuria García Carrillo, Félix de Carlos-Villafranca, Miguel Angel Garces-Villala, Lanka Mahesh, Juan Carlos Ibanez, Francisco Martinez-Martinez. A micro-CT evaluation of bone density around two different types of surfaces on one-piece fixo implants with early loading-an experimental study in dogs at 3 months[J]. AIMS Bioengineering, 2022, 9(4): 383-399. doi: 10.3934/bioeng.2022028


 DownLoad: