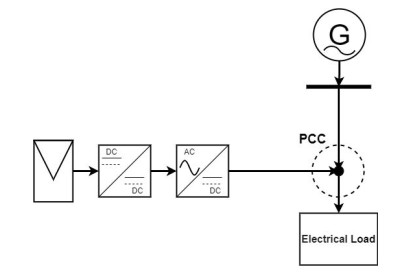
Figure 1.
On-grid PV system block representation.
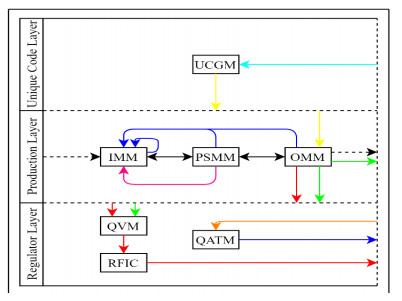
It is relevant for traceability systems to have a common structure for information exchange. Without it, these systems lose much of their utility as they will only be usable internally and will have reduced capacity to add value to products and manage recalls. Based on extensive literature review, a non-proprietary framework for traceability was developed. This framework encompasses whole food supply chains and aims to maintain records of quality and safety while not necessitating mature IT capabilities, uncommon characteristic of SME's. As such the volume of information is divided between all stakeholders according to their necessities and funding capacities. Most of the information is stored by regulators as they have access to more funding. This improves the ease and flexibility of implementation of traceability systems by the companies. Tools were developed and simulated, and all results are presented, clearly demonstrating the capability for quality information sharing through food supply chains which in turn can increase transparency between consumers and producers as well as adjusting the quality to the desired end use.
Citation: João Paulo Curto, Pedro Dinis Gaspar. Traceability in food supply chains: SME focused traceability framework for chain-wide quality and safety-Part 2[J]. AIMS Agriculture and Food, 2021, 6(2): 708-736. doi: 10.3934/agrfood.2021042
| [1] | Rashid Al Badwawi, Mohammad Abusara, Tapas Mallick . Speed control of synchronous machine by changing duty cycle of DC/DC buck converter. AIMS Energy, 2015, 3(4): 728-739. doi: 10.3934/energy.2015.4.728 |
| [2] | Rashmi Murali, Sangeeta Malhotra, Debajit Palit, Krishnapada Sasmal . Socio-technical assessment of solar photovoltaic systems implemented for rural electrification in selected villages of Sundarbans region of India. AIMS Energy, 2015, 3(4): 612-634. doi: 10.3934/energy.2015.4.612 |
| [3] | Zeid Al Qaisi, Qais Alsafasfeh, Ahmad Harb . Stability impact of integrated small scale hybrid (PV/Wind) system with electric distribution network. AIMS Energy, 2018, 6(5): 832-845. doi: 10.3934/energy.2018.5.832 |
| [4] | Virendra Sharma, Lata Gidwani . Optimistic use of battery energy storage system to mitigate grid disturbances in the hybrid power system. AIMS Energy, 2019, 7(6): 688-709. doi: 10.3934/energy.2019.6.688 |
| [5] | Yannick Fanchette, Harry Ramenah, Camel Tanougast, Michel Benne . Applying Johansen VECM cointegration approach to propose a forecast model of photovoltaic power output plant in Reunion Island. AIMS Energy, 2020, 8(2): 179-213. doi: 10.3934/energy.2020.2.179 |
| [6] | K. M. S. Y. Konara, M. L. Kolhe, Arvind Sharma . Power dispatching techniques as a finite state machine for a standalone photovoltaic system with a hybrid energy storage. AIMS Energy, 2020, 8(2): 214-230. doi: 10.3934/energy.2020.2.214 |
| [7] | Fadhil Khadoum Alhousni, Firas Basim Ismail, Paul C. Okonkwo, Hassan Mohamed, Bright O. Okonkwo, Omar A. Al-Shahri . A review of PV solar energy system operations and applications in Dhofar Oman. AIMS Energy, 2022, 10(4): 858-884. doi: 10.3934/energy.2022039 |
| [8] | Aaron St. Leger . Demand response impacts on off-grid hybrid photovoltaic-diesel generator microgrids. AIMS Energy, 2015, 3(3): 360-376. doi: 10.3934/energy.2015.3.360 |
| [9] | HVV Priyadarshana, MA Kalhan Sandaru, KTMU Hemapala, WDAS Wijayapala . A review on Multi-Agent system based energy management systems for micro grids. AIMS Energy, 2019, 7(6): 924-943. doi: 10.3934/energy.2019.6.924 |
| [10] | Mulualem T. Yeshalem, Baseem Khan . Design of an off-grid hybrid PV/wind power system for remote mobile base station: A case study. AIMS Energy, 2017, 5(1): 96-112. doi: 10.3934/energy.2017.1.96 |
It is relevant for traceability systems to have a common structure for information exchange. Without it, these systems lose much of their utility as they will only be usable internally and will have reduced capacity to add value to products and manage recalls. Based on extensive literature review, a non-proprietary framework for traceability was developed. This framework encompasses whole food supply chains and aims to maintain records of quality and safety while not necessitating mature IT capabilities, uncommon characteristic of SME's. As such the volume of information is divided between all stakeholders according to their necessities and funding capacities. Most of the information is stored by regulators as they have access to more funding. This improves the ease and flexibility of implementation of traceability systems by the companies. Tools were developed and simulated, and all results are presented, clearly demonstrating the capability for quality information sharing through food supply chains which in turn can increase transparency between consumers and producers as well as adjusting the quality to the desired end use.
The photovoltaic (PV) system comprises one or more solar panels connected to an inverter and other electrical hardware, utilizing the energy from the sun to produce electricity. The PV systems significantly differ in size, ranging from small ones used on rooftops to large utility-scale used in generation plants. Palestine is among the countries in the world that receive enough solar radiation. Regardless, Palestine has power shortages, with a large part of its electricity imported from other countries. Besides the inadequate electricity supply, Palestine is among the fastest-growing populations in the region. In the last 25 years, the population has doubled from 2.7 million in 1997 to almost 5.3 million in 2021 [1]. Therefore, the electricity demand is high, and the government has engaged in several strategies to compensate for the shortage. The adoption of PV systems is one of the government's policies already implemented. According to P.E.a.N.R.A, the demand is expected to rise from 1400 MWp to 2335 MWp by 2030 [2]. Studies conducted in the country show that many residential buildings are now connected with PV systems. When implementing this strategy, the relevant stakeholders should pay attention to the concept of the power factor. Power factor is defined as measuring the phase difference between current and voltage in an AC power system.
The deployment of PV systems is regarded as one of the fastest-growing renewable sources of energy in the world today. PV systems have many advantages, including providing a safe and environmentally friendly energy source. Some of the factors that affect the success of this form of energy include the tilting of the solar PV, solar radiation, ambient temperature, wind speed, and dust deposition [3,4]. The Middle East region remains one of the areas in the world receiving high solar radiation [6]. Palestine is one of the countries with the highest solar irradiation potential. The sunshine availability is estimated to be around 3000 hours a year.
Palestine acquires a significant portion of its energy from neighboring countries. For instance, research shows that in 2016, 91% of the electricity used in Palestine was imported [7]. Regardless, electricity is one of the most fundamental needs required in many Palestinian households. Electricity is required for various reasons, including cooling and operating the air conditioning units [8,9]. With a lack of an electricity plant in Palestine, government officials have been prompted to develop PV systems for electricity production. Essentially, this has contributed to too many challenges, prompting the Palestinian government to invest in the PV systems to deal with the challenges. The residential PV systems in Palestine have primarily bettered thanks to the favorable policy. Khatib, T. et al. illustrated that a dominant factor that may determine solar generating success or failure is energy policy [3].
PV generation in most countries depends on the nature and type of policy developed by a country. The policy should pay significant attention to tax reduction, market capacity, financial and fiscal incentives, and technical and non-technical information dissemination. Many Palestinian cities have now embraced the PV electrical systems as the primary mode of electricity generation to serve the deficit experienced by the country.
Currently, 39 MW PV systems have been installed. More than 93 MWp of PV systems are yet to be completed [3]. However, research has shown that Palestine faces significant policy issues that adversely affect the development of PV systems. Some identified areas include poor technical standards, low awareness, and a lack of information dissemination. Therefore, these issues have contributed to Palestine lagging in its PV electrical systems.
Most of the residential households in Palestine are apartment buildings. Approximately 85% of the household units are owned by the residents [7]. Residential buildings are primarily found in cities, existing in neighborhoods and clusters. As illustrated by Monna, S et al., in Palestine, a 1 kW rooftop system put at optimal tilt and orientation angles generates up to 1635 kWh per year in Hebron, 1613 kWh per year in Jerusalem, 1562 kWh per year in Nablus, and 1557 kWh per year in Gaza city [7]. The outcome is crucial in determining the future of PV in the country. Residential buildings, especially in urban areas, have a high potential to maximize solar energy from the sun. The quality and type of the building remain a critical aspects to consider when determining whether to develop the PV systems.
The use of the grid-connected PV systems culminated in several fundamental aspects influenced by the decreasing PV prices and positive government regulation practices promoting renewable energy sources [10]. Today, residential buildings, municipalities, schools, and private firms have established PV systems. In research by [11], the authors selected PV home systems operating in the last three years. According to the research, the systems yielded 4.81 kWh/kWp per day. Annually, this translates to 1756 kWh/kWp.
As emphasized by the authors in [11], Economic assessments show that increasing the usage of PV household systems is motivating because the payback period is 4.9 years, the cost per kWh produced is 0.43 NIS (0.115 US $), and the internal rate of return is 25%. Further studies have shown the importance and significance of the PV systems in the national grid. According to studies, the PV system contributes to decreasing losses, high voltage levels, and decreasing power factors [12]. Besides increasing the electricity supply for many Palestinians, it has also improved the environment due to its clean nature. A schematic diagram of a grid-tied PV system can be found in Figure 1.
The PV system is connected to a broader electricity network in a grid-connected version. The inverter is the intermediary between the PV system and the utility grid. The inverter's role is to convert direct current (DC) into alternating current (AC). The connection to residential buildings can take any of the three designs or models explained [14]. Researchers have paid significant attention to the residential PV systems, including their various electrical dynamics. The study by [10] looks at the various aspects of the residential PV systems installed in France. With this research, the author seeks to answer three fundamental questions, including the amount of energy produced, the level of performance, and the parameters that influence its quality [10]. In 2010, the PV systems in France produced an average power level of 1163 kWh/kWp [10]. Besides France, South American countries like Chile have also experienced a growth in the US of the PV systems as part of their electrical production system [13]. Therefore, the PV systems continue to act as a primary source of electricity for many countries and cities across the globe. The PV system offers individuals an opportunity to generate power in a clean, quiet, and reliable manner.
Power factor is one of the most fundamental concepts in electricity. It is regarded as the phase difference between current and voltage in an AC power system. In resistive loads such as those witnessed in an electric kettle or incandescent bulb, the voltage is in phase with the current creating a unity power factor [16]. However, the same is not valid for the inductive and capacitive loads, such as in an inductive motor or a capacitor bank. The current will lag or lead the voltage leading to a non-unity power factor. In a non-unity power factor, the load utilizes both active and reactive power. As shown in Eq 1, the active power is the true power and is directly involved in the work: [17].
| PF=cos(tan−1QP) | (1) |
Most PV systems have a unity power factor, which means that they strictly produce active power [16]. However, research shows that this reduces the power factor in the real sense, and the grid is compelled to supply less active power with the same level of reactive power.
Generally, the PV systems negatively influence the overall power factor, resulting in penalties, especially when corrective measures are not taken [19]. When the solar system produces energy, the active power is harnessed and fed directly to the load. Consequently, this results in lowering the active power demand from the utility. However, the reactive power emanating from the load largely remains the same [20]. The outcome is a reduction in the power factor at the grid connection. From a consumer perspective, reducing the power factor yields penalties for the grid operator. However, research has shown that several ways exist that could be used to reduce the power factor [19]. The primary strategy used revolves around the manipulation of the inverter. Stakeholders should pay significant attention to finding the most appropriate ratio between the active and reactive power. Essentially, this enables them to control the amount of active power that reaches the load, including the reactive power [20]. Capacitors could also be used in the correction of the power factor. The role of the capacitors is to reduce the magnetization of the current. Improving the power factor has many benefits, including environmental protection, reducing electricity bills, and reducing voltage drop [20]. A reduced power factor also means that the equipment has an extended life, thanks to the reduced burden on cables and other additional components.

Choosing the suitable power factor is now considered one of the crucial design points of a grid-connected PV system [26]. The integration of solar energy may have a detrimental influence on the electrical infrastructure's overall power factor (PF), resulting in fines if remedial measures are not implemented. Since the solar system produces and provides solely active energy, less active energy from the grid is needed to produce the same amount of reactive energy that the solar system produces and provides [26]. Solar enterprises must reduce the likelihood of an increase in kVAR fines and penalties [27]. Adopting a Power Factor Correction device may quickly and effectively remedy this problem by installing a special type of available SCADA system [27]. Alternatively, a power factor compensator may be installed to avoid the penalty.
In Palestine, there are several electricity distributors, each with its own set of rules and regulations regarding power factor penalties and settings. For example, the North Electricity Company decides that the power factor of a solar energy system is 0.92, which is lower than the national average [28]. This would have significant limitations, as it would reduce the actual amount of energy produced by solar energy systems in cases where there is no need to reduce its value. In addition, reducing the power factor for some systems should be based on technical studies for each case. The oversized design might have a negative impact on the network or the loads in this facility. On the other hand, after fourteen trial days of PV systems commissioning, the Jerusalem District Electricity Company operates and examines the station to determine the effect of connecting it to the network and gather the information on the ground for accurate evaluation [29]. If necessary, the company notifies the facility's owner, with each project being evaluated separately. For example, it was requested to establish a 7.5-megawatt solar power plant control system in the Al-Nuwaimah Plant [30], which would continuously modify the power factor to consistently meet the condition of the network without harming it or causing any problems to the network or its equipment. Nevertheless, there are no technical criteria for measuring the power factor of inverters under the legislation governing municipal authorities [31]. This paper mainly focuses on such authorities, which account for approximately 32.5% of the total share of electricity distributors in Palestine [3]. These parts of the network are susceptible to instability, which is achieved by not studying its status before connecting the solar energy system and determining the amount of reactive power that the inverters must compensate the network with.
In large-scale PV power plants, the power factor and its correction are relevant both from the perspective of the plant and the grid [31]. The supply of reactive power is vital in a power grid. The amount of reactive power generated must closely balance that which is being consumed. A leading power factor due to capacitive loads causes a rise in voltage, while a lagging power factor due to inductive loads causes a reduction in the voltage [18]. However, most grid-connected PV inverters only produce active power, reducing the power factor as the grid supplies less active power but the same reactive power [32]. Further, emphasize the significance of regulating the power factor of PV plants, given that controlling and monitoring voltage is a crucial aspect of electrical grid systems. Accordingly, power factor compensation is a crucial step in attaining voltage demand in the connection point of PV plants. It is also a reliable way of easing the integration of distributed sources [33]. However, the method of handling reactive powers of photovoltaic plants depends on local legislative expectations.
Figure 3 shows the annual temperature and irradiance values as a function of time. Palestine, as previously stated, has adequate amounts of irradiance and moderate temperatures. As a result, solar energy is one of the most promising renewable energy sources. The findings and conclusions are based on Palestinian meteorological data. Half-hourly data sets of solar irradiance and temperature are evaluated for one week, as shown in Figure 5.

For load flow studies, the model has been built with ETAP 19.0.1. The Electrical Transient Analyzer Program (ETAP) is a modeling and simulation software for electrical networks that power systems engineers use to generate an "electrical digital twin" to examine electrical power system dynamics, transients, and protection. An averaged model has also been built in the Simulink environment. The latter is used to simulate changing the inverter power factor on the overall active and reactive power flow. Figure 4 shows the sub-network model consisting of a transformer in a typical town in Palestine. PV systems were distributed over five service feeders. Lengths of the cables were averaged with lumped loads at the terminals. Figure 5 shows the active and reactive power profiles for the lumped loads.

| Parameter | Value |
| Medium Voltage | 22 kV |
| Low Voltage | 0.4 kV |
| Transformer Capacity | 1000 kVA |
| Transformer X/R Ratio | 13 |
| Service Line Length | 200 m |
| Service Line Impedance | 0.705 + j0.406 Ω/km |
 DownLoad:
CSV
DownLoad:
CSV

The electric sub-network has been investigated in terms of the power factor of PV systems connected to the power grid on the overall value of the power factor of the connection point. Moreover, it was proposed to install solar energy systems with 150 kilowatts distributed across the five service feeders. The total capacity of the systems increased through 12 different scenarios after the power factor value for all photovoltaic systems was fixed. As an example, Table 2 below depicts the different scenarios addressed by adjusting the power factor of all PV installations on the grid from 1 to 0.9 leading power factor.
| Scenario No. | Feeder 1 | Feeder 2 | Feeder 3 | Feeder 4 | Feeder 5 | Total Power (kW) |
| 1 | 10 | 0 | 0 | 0 | 0 | 10 |
| 2 | 10 | 10 | 0 | 0 | 0 | 20 |
| 3 | 10 | 10 | 10 | 0 | 0 | 30 |
| 4 | 10 | 10 | 10 | 10 | 0 | 40 |
| 5 | 10 | 10 | 10 | 10 | 10 | 50 |
| 6 | 20 | 10 | 10 | 10 | 10 | 60 |
| 7 | 20 | 20 | 10 | 10 | 10 | 70 |
| 8 | 20 | 20 | 20 | 10 | 10 | 80 |
| 9 | 20 | 20 | 20 | 20 | 10 | 90 |
| 10 | 20 | 20 | 20 | 20 | 20 | 100 |
| 11 | 30 | 20 | 30 | 20 | 20 | 120 |
| 12 | 30 | 30 | 30 | 30 | 30 | 150 |
DownLoad:
CSV
The findings are broken down into three sections. The first step is to look at altering PVs' power factor on the PCC's total power factor. Second, a PV power fac-tor lookup table is given, which assists towns and electric network operators in determining the optimal power factor for PV installers to use. Finally, a suggested intuitive power fac-tor control block is described.
As mentioned earlier, choosing the proper power factor for a grid-connected PV system could be crucial. For instance, if all connected systems are operating at a unity power factor, a decrease in the overall power factor at the point of common connection (PCC) is expected, especially at peak times. For a single system, the power factor at the PCC is given in Eq 2:
| PFPCC=cos[arctan[QloadPgrid−PPV]] | (2) |
The grid will deliver part of the real power to the load, but all reactive power will be drawn from the grid. Hence, as seen from the grid side, the total power factor will decrease at peak generation times. Power factor degradation worsens with increasing PV generation at the unity power factor. For this reason, it can be noted how important it is to reconsider the unity power factor arrangements for integrated PV systems. Figure 6 depicts how the power factor at the PCC behaves when PV integration is increased concerning the maximum active power of the connected loads. Where the load ratio r is given by dividing the total installed PV capacity by the maximum load from Figure 5 is shown in Eq 3:
| r=Installed PV Capacity(kWp)Maximum Active Load(kW) | (3) |
Alternatively, this ratio can also be the proportion of the total PV capacity of the average load. From Figure 6, it is quite clear how increasing the installed PV capacity by fixing the power factor of all systems at a universal power factor can degrade the overall power factor of the network. However, it has a delayed effect with a leading power factor. For instance, having all systems at a leading power factor of 0.95 gives the network operator a broader range to accept more PVs (as high as 80% with respect to the overall load).

The 3D plot is shown in Figure 7. This figure gives the PCC power factor as a function of the PV power factor and the total installed PV capacity. It gives an insight into how much PV at a given power factor will be permissible. For example, the upper area sweeps all possible combinations of the PV power factor and its relative total capacity, resulting in an overall PCC power factor of 0.90 and higher. On the other side, unacceptable combinations are given by the areas at the slope of the graph. These combinations give an alarming overall power factor of less than 0.50. These findings are being widely noticed with the PV integration surge in areas like Palestine. Network operators and municipalities are more concerned about the PCC power factor than ever. Some are already requesting a complete grid impact study before getting the license to install a PV system. Nevertheless, such studies are still immature to fully address the effect of the PV power factor on the PCC power factor. Thus, this paper is considered an excellent reference for interested parties in power factor assessment.

This section develops a lookup table to help network operators and municipalities decide on the best power factor settings for any added PV systems added to their grid. Based on Figure 7, the values shown in Table 3 were established. In the first column to the left, the power ratio parameter represents the PV system's peak power to the peak power demand within the network under consideration. However, the first row refers to the proper PV system's power factor, which should be selected to get the overall power factor shown in the table. The proposed lookup table serves as a good decision-making criterion where no exhaustive grid impact studies are applicable. It is evident in small villages where they cannot acquire grid-scale data or cannot afford costly studies. It can also help predict the future overall power factor if excessive PV penetration occurs. For instance, adding more than 50% of the overall capacity can drastically reduce the overall grid power factor.

|
1 | 0.99 | 0.98 | 0.97 | 0.96 | 0.95 | 0.91 |
| 5.0% | 94.0% | 94.1% | 94.2% | 94.2% | 94.3% | 94.3% | 94.5% |
| 10.0% | 93.4% | 94.8% | 94.0% | 94.1% | 94.2% | 94.3% | 94.7% |
| 15.0% | 92.8% | 93.4% | 93.7% | 93.9% | 94.1% | 94.3% | 94.9% |
| 20.0% | 92.2% | 93.1% | 93.5% | 93.8% | 94.0% | 94.3% | 95.2% |
| 25.0% | 91.5% | 92.7% | 93.2% | 93.6% | 94.0% | 94.2% | 95.4% |
| 30.0% | 90.6% | 92.3% | 92.9% | 93.4% | 93.8% | 94.2% | 95.7% |
| 35.0% | 89.5% | 91.7% | 92.5% | 93.2% | 93.7% | 94.2% | 96.0% |
| 40.0% | 88.2% | 91.1% | 92.2% | 93.0% | 93.6% | 94.2% | 96.3% |
| 45.0% | 86.4% | 90.5% | 91.7% | 92.7% | 91.8% | 94.1% | 96.7% |
| 50.0% | 84.0% | 89.4% | 91.1% | 92.3% | 91.0% | 94.1% | 97.1% |
| 55.0% | 80.8% | 88.0% | 90.4% | 91.9% | 91.0% | 94.0% | 97.4% |
| 60.0% | 77.0% | 86.3% | 89.7% | 91.4% | 91.0% | 94.0% | 97.7% |
| 65.0% | 71.6% | 83.8% | 88.2% | 90.8% | 91.0% | 93.9% | 97.7% |
| 70.0% | 63.5% | 78.4% | 85.0% | 89.5% | 91.0% | 93.8% | 92.8% |
| 80.0% | 43.5% | 63.6% | 76.3% | 86.0% | 91.0% | 93.5% | 76.7% |
| 90.0% | 22.3% | 32.8% | 39.7% | 45.5% | 51.7% | 59.1% | 39.0% |
| 100.0% | 1.1% | 2.0% | 3.0% | 5.0% | 12.4% | 24.7% | 1.3% |
DownLoad:
CSV
To elaborate on how fixing the power factor at a constant value could affect the output of a PV System, Figure 8 shows real-time data from two identical PV systems at different inverters' power factors. As can be seen, the system with a 0.92 power factor has an in the parallel generation of reactive power. This reactive power can be helpful at peak times when the power factor at the connection point is expected to decrease. However, there could be a counterproductive effect of this excess reactive power at low generation times.

As concluded, setting the PV system on a constant power factor may only be helpful for specific periods, specifically at peak generation times. As shown in Figure 9, the inverter has a maximum capacity in terms of kVAs. When the power factor is set at unity, the inverter injects only active power at its maximum capacity. However, it means that less active power is injected when the inverter operates at something other than a unity power factor. Hence, an interactive power factor controller can be more realistic. Such a controller is responsible for monitoring the overall power factor at the PCC. Then it acts by sending a command to the inverter to charge the power factor to maintain a proper one at the PCC.

A proposed power factor controller is shown below in Figure 10. This intuitive controller works by detecting a decrease in the PCC power factor below a specific limit. Consequently, it commands the inverter to decrease its power factor by an increment (e.g., 0.01).

If the PCC power factor increases above the limit, the controller goes back by increasing the inverter power factor by the same increment. Figure 11, shown below, shows how the injection of pure active power comes with a decrease in the PCC power factor. Thus, the controller senses the limit of 0.95 and sends a signal to the inverter to decrease the power factor by 0.01. As a result, the total power factor experiences an increase as reactive power is injected into the grid. Using such a controller could help in more than one way. First, it adds an element of flexibility with load and generation intermittency. Second, it serves as an economic optimization tool, where customers can avoid penalties concerning excessive reactive power consumption. Moreover, it maximizes the active power generation when there is no need for a leading power factor. To elaborate on the latter, Figure 12 shows how a fixed power factor can waste much energy, especially at times other than the peak.


This refers to utilizing the suggested power factor controller could encourage municipalities and grid operators to consider such controllers as a superior way to overcome power factor compensation. Such controllers can be found commercially with various construction. For example, the power factor monitoring and control system has been used in several solar power plants in Palestine, with the Skytron system being used for the first time in a solar power plant with a peak capacity of 992 kW on the roof of the National Aluminum and Profile Company (NAPCO) factory in 2019. This technique is used in two ground-based solar power facilities in the Palestinian territories of Birzeit and Ya'bad [34,35]. Many aspects of the station's performance, particularly the power factor, are controlled by the device, which is constantly working to change the value of the inverters to ensure the highest production and the highest efficiency of the station without affecting the power factor the connection point in question. The figure below shows how such a controller alters the power factor of the PV system. These data are taken from a 1 MW PV plant in Birzeit, Palestine. It is evident how at low generation, time step 35, the inverter increases its power factor since there is less need for reactive power.

When it comes to distributed generation (DG) using renewable energy (RE) sources, there are several obstacles to overcome, the most prominent of which is the impact of intermittency, as well as technological concerns deriving from grid connections [36]. The photovoltaic array, for example, feeds electrical energy directly into the electrical grid (also known as grid-tied systems), such as a solar-powered system [37]. Due to the unpredictability of solar radiation, this kind of system is regarded as an unstable energy source. Although challenging to forecast, the performance of these systems is vitally significant in many associated aspects such as system sizing and control [38]. Because the integration of distributed generation into a power system is not considered in the initial network design, certain technical consequences of PV integration into a power system might occur [39]. Moreover, various factors can be analyzed and studied as the impact of connecting PV plants to the national grid, such as the evaluation of the harmonics generated by the PV inverter and the influence of these harmonics on the current harmonic spectrum of the current injected by the PV system at PCC bus [40].
The increased penetration of PV systems in Palestine requires an in-depth study to consider their impact on the national grid. Overall grid power factor comes as one of the essential criteria to be considered when any grid impact study is performed. This paper's extensive literature review of the power factor importance and its side effects was delivered. Besides, a lookup table was developed to help grid operators choose the proper power factor for any PV system added to the grid. All data used in this study are actual data to increase the validity of the findings. It was also found that an auxiliary power fac-tor controller can be even more helpful and less stressful for designers to improve power factor.
The author would like to thank the Solar Energy Research Institute, UKM for the lab facilities. This research was funded by Universiti Kebangsaan Malaysia (UKM), research grant Program Translational MRUN Rakan-RU-2019-001/4.
The authors declare no conflict of interest
| [1] |
Moe T (1998) Perspectives on traceability in food manufacture. Trends Food Sci Technol 9: 211-214. doi: 10.1016/S0924-2244(98)00037-5

|
| [2] |
Karlsen KM, Dreyer B, Olsen P, et al. (2013) Literature review: Does a common theoretical framework to implement food traceability exist? Food Control 32: 409-417. doi: 10.1016/j.foodcont.2012.12.011
|
| [3] |
Beulens AJM, Broens DF, Folstar P, et al. (2005) Food safety and transparency in food chains and networks. Relationships and challenges. Food Control 16: 481-486. doi: 10.1016/j.foodcont.2003.10.010
|
| [4] |
Borit M, Olsen P (2012) Evaluation framework for regulatory requirements related to data recording and traceability designed to prevent illegal, unreported and unregulated fishing. Mar Policy 36: 96-102. doi: 10.1016/j.marpol.2011.03.012
|
| [5] |
Hu J, Zhang X, Moga LM, et al. (2013) Modeling and implementation of the vegetable supply chain traceability system. Food Control 30: 341-353. doi: 10.1016/j.foodcont.2012.06.037
|
| [6] |
Parreño-Marchante A, Alvarez-Melcon A, Trebar M, et al. (2014) Advanced traceability system in aquaculture supply chain. J Food Eng 122: 99-109. doi: 10.1016/j.jfoodeng.2013.09.007
|
| [7] |
Wang L, Kwok SK, Ip WH (2010) A radio frequency identification and sensor-based system for the transportation of food. J Food Eng 101: 120-129. doi: 10.1016/j.jfoodeng.2010.06.020
|
| [8] |
Li M, Qian JP, Yang XT, et al. (2010) A PDA-based record-keeping and decision-support system for traceability in cucumber production. Comput Electron Agric 70: 69-77. doi: 10.1016/j.compag.2009.09.009
|
| [9] |
Lavelli V (2013) High-warranty traceability system in the poultry meat supply chain: A medium-sized enterprise case study. Food Control 33: 148-156. doi: 10.1016/j.foodcont.2013.02.022
|
| [10] |
Trebar M, Lotrič M, Fonda I, et al. (2013) RFID data loggers in fish supply chain traceability. Int J Antennas Propag 2013(3-4): 1-9. doi: 10.1155/2013/875973
|
| [11] |
Liu F, Wang Y, Jia Y, et al. (2015) The egg traceability system based on the video capture and wireless networking technology. Int J Sens Networks 17: 211-216. doi: 10.1504/IJSNET.2015.069582
|
| [12] |
Wang X, Fu D, Fruk G, et al. (2018) Improving quality control and transparency in honey peach export chain by a multi-sensors-managed traceability system. Food Control 88: 169-180. doi: 10.1016/j.foodcont.2018.01.008
|
| [13] |
Bollen AF, Riden CP, Cox NR (2007) Agricultural supply system traceability, Part Ⅰ: Role of packing procedures and effects of fruit mixing. Biosyst Eng 98: 391-400. doi: 10.1016/j.biosystemseng.2007.07.011
|
| [14] |
Skoglund T, Dejmek P (2007) Fuzzy traceability: A process simulation derived extension of the traceability concept in continuous food processing. Food Bioprod Process 85: 354-359. doi: 10.1205/fbp07044
|
| [15] |
Frosch S, Randrup M, Thorup-Frederiksen M (2008) Opportunities for the herring industry tooptimize operations through information recording, effective traceability systems, and use of advanced data analysis. J Aquat Food Prod Technol 17: 387-403. doi: 10.1080/10498850802369179
|
| [16] |
Thakur M, Martens BJ, Hurburgh CR (2011) Data modeling to facilitate internal traceability at a grain elevator. Comput Electron Agric 75: 327-336. doi: 10.1016/j.compag.2010.12.010
|
| [17] |
Karlsen KM, Sørensen CF, Forås F, et al. (2011) Critical criteria when implementing electronic chain traceability in a fish supply chain. Food Control 22: 1339-1347. doi: 10.1016/j.foodcont.2011.02.010
|
| [18] |
Huang F, Zhang S, Zhao H (2012) Design and application of quality traceability system based on RFID technology for red jujubes. IFIP Adv Inf Commun Technol 368: 371-380. doi: 10.1007/978-3-642-27281-3_43
|
| [19] | Pizzuti T, Mirabelli G, Gómez-González F, et al. (2012) Modeling of an agro-food traceability system: The case of the frozen vegetables. Proceedings of the 2012 International Conference on Industrial Engineering and Operations Management, 1065-1074. |
| [20] |
Gessner GH, Volonino L, Fish LA (2007) One-up, one-back ERM in the food supply chain. Inf Syst Manag 24: 213-222. doi: 10.1080/10580530701404561
|
| [21] | Jedermann R, Lang W (2007) Semi-passive RFID and beyond: Steps towards automated quality tracing in the food chain. Int J Radio Freq Identif Technol Appl 1: 247-259. |
| [22] |
Aung MM, Chang YS (2014) Traceability in a food supply chain: Safety and quality perspectives. Food Control 39: 172-184. doi: 10.1016/j.foodcont.2013.11.007
|
| [23] |
Matzembacher DE, do Carmo Stangherlin I, Slongo LA, et al. (2018) An integration of traceability elements and their impact in consumer's trust. Food Control 92: 420-429. doi: 10.1016/j.foodcont.2018.05.014
|
| [24] |
Dabbene F, Gay P, Tortia C (2014) Traceability issues in food supply chain management: A review. Biosyst Eng 120: 65-80. doi: 10.1016/j.biosystemseng.2013.09.006
|
| [25] |
Hsiao HI, Huang KL (2016) Time-temperature transparency in the cold chain. Food Control 64: 181-188. doi: 10.1016/j.foodcont.2015.12.020
|
| [26] |
Dandage K, Badia-Melis R, Ruiz-García L (2017) Indian perspective in food traceability: A review. Food Control 71: 217-227. doi: 10.1016/j.foodcont.2016.07.005
|
| [27] |
Raak N, Symmank C, Zahn S, et al. (2017) Processing- and product-related causes for food waste and implications for the food supply chain. Waste Manag 61: 461-472. doi: 10.1016/j.wasman.2016.12.027
|
| [28] |
Ndraha N, Hsiao HI, Vlajic J, et al. (2018) Time-temperature abuse in the food cold chain: Review of issues, challenges, and recommendations. Food Control 89: 12-21. doi: 10.1016/j.foodcont.2018.01.027
|
| [29] |
Chrysochou P, Chryssochoidis G, Kehagia O (2009) Traceability information carriers. The technology backgrounds and consumers' perceptions of the technological solutions. Appetite 53: 322-331. doi: 10.1016/j.appet.2009.07.011
|
| [30] |
Bosona T, Gebresenbet G (2013) Food traceability as an integral part of logistics management in food and agricultural supply chain. Food Control 33: 32-48. doi: 10.1016/j.foodcont.2013.02.004
|
| [31] |
Asioli D, Boecker A, Canavari M (2014) On the linkages between traceability levels and expected and actual traceability costs and benefits in the Italian fishery supply chain. Food Control 46: 10-17. doi: 10.1016/j.foodcont.2014.04.048
|
| [32] |
Germani M, Mandolini M, Marconi M, et al. (2015) A system to increase the sustainability and traceability of supply chains. Procedia CIRP 29: 227-232. doi: 10.1016/j.procir.2015.02.199
|
| [33] |
Thakur M, Forås E (2015) EPCIS based online temperature monitoring and traceability in a cold meat chain. Comput Electron Agric 117: 22-30. doi: 10.1016/j.compag.2015.07.006
|
| [34] |
Stranieri S, Cavaliere A, Banterle A (2018) The determinants of voluntary traceability standards. The case of the wine sector. Wine Econ Policy 7: 45-53. doi: 10.1016/j.wep.2018.02.001
|
| [35] |
Jansen-Vullers MH, Van Dorp CS, Beulens AJM (2003) Managing traceability information in manufacture. Int J Inf Manage 23: 395-413. doi: 10.1016/S0268-4012(03)00066-5
|
| [36] |
Regattieri A, Gamberi M, Manzini R (2007) Traceability of food products: General framework and experimental evidence. J Food Eng 81: 347-356. doi: 10.1016/j.jfoodeng.2006.10.032
|
| [37] |
Donnelly KAM, Karlsen KM, Olsen P (2009) The importance of transformations for traceability - A case study of lamb and lamb products. Meat Sci 83: 68-73. doi: 10.1016/j.meatsci.2009.04.006
|
| [38] |
Storoy J, Thakur M, Olsen P (2013) The TraceFood Framework - Principles and guidelines for implementing traceability in food value chains. J Food Eng 115: 41-48. doi: 10.1016/j.jfoodeng.2012.09.018
|
| [39] |
Aiello G, Enea M, Muriana C (2015) The expected value of the traceability information. Eur J Oper Res 244: 176-186. doi: 10.1016/j.ejor.2015.01.028
|
| [40] |
Olsen P, Borit M (2018) The components of a food traceability system. Trends Food Sci Technol 77: 143-149. doi: 10.1016/j.tifs.2018.05.004
|
| [41] |
Óskarsdóttir K, Oddsson GV (2019) Towards a decision support framework for technologies used in cold supply chain traceability. J Food Eng 240:153-159. doi: 10.1016/j.jfoodeng.2018.07.013
|
| [42] |
Sloof M, Tijskens P, Wilkinson EC (1996) Concepts for modelling the quality of perishable products. Trends Food Sci Technol 7: 165-171. doi: 10.1016/0924-2244(96)81257-X
|
| [43] |
Hsu CI, Hung SF, Li HC (2007) Vehicle routing problem with time-windows for perishable food delivery. J Food Eng 80: 465-475. doi: 10.1016/j.jfoodeng.2006.05.029
|
| [44] | Heese HS (2007) Inventory Record Inaccuracy, Double marginalization, and RFID adoption. Prod Oper Manag 16: 542-553. |
| [45] |
Xiaofeng L, Tang O, Huang P (2008) Dynamic pricing and ordering decision for the perishable food of the supermarket using RFID technology. Asia Pacific J Mark Logist 20: 7-22. doi: 10.1108/13555850810844841
|
| [46] | Kwok SK, Tsang AHC, Ting JSL, et al. (2008) An intelligent RFID-based electronic anti-counterfeit system (InRECS) for the manufacturing industry. IFAC 41: 5482-5487. |
| [47] |
Woo SH, Choi JY, Kwak C, et al. (2009) An active product state tracking architecture in logistics sensor networks. Comput Ind 60: 149-160. doi: 10.1016/j.compind.2008.12.001
|
| [48] | Hu Z, Jian Z, Shen P, et al. (2009) Modeling method of traceability system based on information flow in meat food supply chain. WSEAS Trans Inf Sci Appl 6: 1094-1103. |
| [49] |
Bakker M, Riezebos J, Teunter RH (2012) Review of inventory systems with deterioration since 2001. Eur J Oper Res 221: 275-284. doi: 10.1016/j.ejor.2012.03.004
|
| [50] |
Wang X, Li D (2012) A dynamic product quality evaluation based pricing model for perishable food supply chains. Omega 40: 906-917. doi: 10.1016/j.omega.2012.02.001
|
| [51] |
Verdouw CN, Beulens AJM, van der Vorst JGAJ (2013) Virtualisation of floricultural supply chains: A review from an internet of things perspective. Comput Electron Agric 99: 60-175. doi: 10.1016/j.compag.2013.09.006
|
| [52] |
Pahl J, Voß S (2014) Integrating deterioration and lifetime constraints in production and supply chain planning: A survey. Eur J Oper Res 238: 654-674. doi: 10.1016/j.ejor.2014.01.060
|
| [53] | Hertog MLATM, Uysal I, Verlinden BM, et al. (2014) Shelf life modelling for first-expired-first-out warehouse management. Philos Trans R Soc A: 1-15. |
| [54] |
Qian J, Fan B, Wu X, et al. (2017) Comprehensive and quantifiable granularity: A novel model to measure agro-food traceability. Food Control 74: 98-106. doi: 10.1016/j.foodcont.2016.11.034
|
| [55] | Bechini A, Cimino MGCA, Lazzerini B, et al. (2006), A General framework for food traceability. 2005 Symposium on Applications and the Internet Workshops (SAINT 2005 Workshops), 366-369. |
| [56] |
Kelepouris T, Pramatari K, Doukidis G (2007) RFID-enabled traceability in the food supply chain. Ind Manag Data Syst 107: 183-200. doi: 10.1108/02635570710723804
|
| [57] |
Bechini A, Cimino MGCA, Marcelloni F, et al. (2007) Patterns and technologies for enabling supply chain traceability through collaborative e-business. Inf Softw Technol 50: 342-359. doi: 10.1016/j.infsof.2007.02.017
|
| [58] |
Thakur M, Hurburgh CR (2009) Framework for implementing traceability system in the bulk grain supply chain. J Food Eng 95: 617-626. doi: 10.1016/j.jfoodeng.2009.06.028
|
| [59] |
Olsen P, Aschan M (2010) Reference method for analyzing material flow, information flow and information loss in food supply chains. Trends Food Sci Technol 21: 313-320. doi: 10.1016/j.tifs.2010.03.002
|
| [60] |
Thakur M, Sørensen CF, Bjørnson FO, et al. (2011) Managing food traceability information using EPCIS framework. J Food Eng 103: 417-433. doi: 10.1016/j.jfoodeng.2010.11.012
|
| [61] |
Jvan der Vorst JGAJ, Tromp SO, van der Zee DJ (2009) Simulation modelling for food supply chain redesign; Integrated decision making on product quality, sustainability and logistics. Int J Prod Res 47: 6611-6631. doi: 10.1080/00207540802356747
|
| [62] |
Zhou W, Tu YJ, Piramuthu S (2009) RFID-enabled item-level retail pricing. Decis Support Syst 48: 169-179. doi: 10.1016/j.dss.2009.07.008
|
| [63] |
Karlsen KM, Dreyer B, Olsen P, et al. (2012) Granularity and its role in implementation of seafood traceability. J Food Eng 112: 78-85. doi: 10.1016/j.jfoodeng.2012.03.025
|
| [64] |
Grunow M, Piramuthu S (2013) RFID in highly perishable food supply chains - Remaining shelf life to supplant expiry date? Int J Prod Econ 146: 717-727. doi: 10.1016/j.ijpe.2013.08.028
|
| [65] |
Piramuthu S, Farahani P, Grunow M (2013) RFID-generated traceability for contaminated product recall in perishable food supply networks. Eur J Oper Res 225: 253-262. doi: 10.1016/j.ejor.2012.09.024
|
| [66] | Jedermann R, Nicometo M, Uysal I, et al. (2014) Reducing food losses by intelligent food logistics. Philos Trans R Soc, Series A: 1-20. |
| [67] |
Badia-Melis R, Mishra P, Ruiz-García L (2015) Food traceability: New trends and recent advances. A review. Food Control 57: 393-401. doi: 10.1016/j.foodcont.2015.05.005
|
| [68] |
Saak AE (2016) Traceability and reputation in supply chains. Int J Prod Econ 177: 149-162. doi: 10.1016/j.ijpe.2016.04.008
|
| [69] |
Gaukler G, Ketzenberg M, Salin V (2017) Establishing dynamic expiration dates for perishables: An application of RFID and sensor technology. Int J Prod Econ 193: 617-632. doi: 10.1016/j.ijpe.2017.07.019
|
| [70] |
Tijskens LMM, Polderdijk JJ (1996) A generic model for keeping quality of vegetable products during storage and distribution. Agric Syst 51: 431-452. doi: 10.1016/0308-521X(95)00058-D
|
| [71] |
Mgonja JT, Luning P, Van Der Vorst JGAJ (2013) Diagnostic model for assessing traceability system performance in fish processing plants. J Food Eng 118: 188-197. doi: 10.1016/j.jfoodeng.2013.04.009
|
| [72] |
Shankar R, Gupta R, Pathak DK (2018) Modeling critical success factors of traceability for food logistics system. Transp Res Part E Logist Transp Rev 119: 205-222. doi: 10.1016/j.tre.2018.03.006
|
| [73] | Bendaoud M, Lecomte C, Yannou B (2012) A methodological framework to design and assess food traceability systems. Int Food Agribus Manag Rev 15: 103-126. |
| 1. | Franz Teske, Jano Schubert, Adrian Fehrle, Felix Funk, Jörg Franke, Techno-economic analysis of battery storage systems and hydrogen-based storage systems as an alternative to grid expansion in the medium voltage grid in Germany, 2023, 11, 2333-8334, 358, 10.3934/energy.2023019 | |
| 2. | B. Rajasekhara Reddy, S. Pranavanand, Naregalkar Akshay, 2023, Intelligent Control System for Solar Power Complementing with Grid Power, 979-8-3503-1398-7, 1, 10.1109/ICSCNA58489.2023.10370204 | |
| 3. | Bahgat Ayasi, Iago X. Vázquez, Mohammed Saleh, Angel M. Garcia-Vico, Cristóbal J. Carmona, Application of spiking neural networks and traditional artificial neural networks for solar radiation forecasting in photovoltaic systems in Arab countries, 2025, 0941-0643, 10.1007/s00521-025-11066-z |
João Paulo Curto, Pedro Dinis Gaspar. Traceability in food supply chains: SME focused traceability framework for chain-wide quality and safety-Part 2[J]. AIMS Agriculture and Food, 2021, 6(2): 708-736. doi: 10.3934/agrfood.2021042

| Parameter | Value |
| Medium Voltage | 22 kV |
| Low Voltage | 0.4 kV |
| Transformer Capacity | 1000 kVA |
| Transformer X/R Ratio | 13 |
| Service Line Length | 200 m |
| Service Line Impedance | 0.705 + j0.406 Ω/km |
DownLoad:
CSV
| Scenario No. | Feeder 1 | Feeder 2 | Feeder 3 | Feeder 4 | Feeder 5 | Total Power (kW) |
| 1 | 10 | 0 | 0 | 0 | 0 | 10 |
| 2 | 10 | 10 | 0 | 0 | 0 | 20 |
| 3 | 10 | 10 | 10 | 0 | 0 | 30 |
| 4 | 10 | 10 | 10 | 10 | 0 | 40 |
| 5 | 10 | 10 | 10 | 10 | 10 | 50 |
| 6 | 20 | 10 | 10 | 10 | 10 | 60 |
| 7 | 20 | 20 | 10 | 10 | 10 | 70 |
| 8 | 20 | 20 | 20 | 10 | 10 | 80 |
| 9 | 20 | 20 | 20 | 20 | 10 | 90 |
| 10 | 20 | 20 | 20 | 20 | 20 | 100 |
| 11 | 30 | 20 | 30 | 20 | 20 | 120 |
| 12 | 30 | 30 | 30 | 30 | 30 | 150 |
DownLoad:
CSV
|
|
1 | 0.99 | 0.98 | 0.97 | 0.96 | 0.95 | 0.91 |
| 5.0% | 94.0% | 94.1% | 94.2% | 94.2% | 94.3% | 94.3% | 94.5% |
| 10.0% | 93.4% | 94.8% | 94.0% | 94.1% | 94.2% | 94.3% | 94.7% |
| 15.0% | 92.8% | 93.4% | 93.7% | 93.9% | 94.1% | 94.3% | 94.9% |
| 20.0% | 92.2% | 93.1% | 93.5% | 93.8% | 94.0% | 94.3% | 95.2% |
| 25.0% | 91.5% | 92.7% | 93.2% | 93.6% | 94.0% | 94.2% | 95.4% |
| 30.0% | 90.6% | 92.3% | 92.9% | 93.4% | 93.8% | 94.2% | 95.7% |
| 35.0% | 89.5% | 91.7% | 92.5% | 93.2% | 93.7% | 94.2% | 96.0% |
| 40.0% | 88.2% | 91.1% | 92.2% | 93.0% | 93.6% | 94.2% | 96.3% |
| 45.0% | 86.4% | 90.5% | 91.7% | 92.7% | 91.8% | 94.1% | 96.7% |
| 50.0% | 84.0% | 89.4% | 91.1% | 92.3% | 91.0% | 94.1% | 97.1% |
| 55.0% | 80.8% | 88.0% | 90.4% | 91.9% | 91.0% | 94.0% | 97.4% |
| 60.0% | 77.0% | 86.3% | 89.7% | 91.4% | 91.0% | 94.0% | 97.7% |
| 65.0% | 71.6% | 83.8% | 88.2% | 90.8% | 91.0% | 93.9% | 97.7% |
| 70.0% | 63.5% | 78.4% | 85.0% | 89.5% | 91.0% | 93.8% | 92.8% |
| 80.0% | 43.5% | 63.6% | 76.3% | 86.0% | 91.0% | 93.5% | 76.7% |
| 90.0% | 22.3% | 32.8% | 39.7% | 45.5% | 51.7% | 59.1% | 39.0% |
| 100.0% | 1.1% | 2.0% | 3.0% | 5.0% | 12.4% | 24.7% | 1.3% |
DownLoad:
CSV
| Parameter | Value |
| Medium Voltage | 22 kV |
| Low Voltage | 0.4 kV |
| Transformer Capacity | 1000 kVA |
| Transformer X/R Ratio | 13 |
| Service Line Length | 200 m |
| Service Line Impedance | 0.705 + j0.406 Ω/km |
| Scenario No. | Feeder 1 | Feeder 2 | Feeder 3 | Feeder 4 | Feeder 5 | Total Power (kW) |
| 1 | 10 | 0 | 0 | 0 | 0 | 10 |
| 2 | 10 | 10 | 0 | 0 | 0 | 20 |
| 3 | 10 | 10 | 10 | 0 | 0 | 30 |
| 4 | 10 | 10 | 10 | 10 | 0 | 40 |
| 5 | 10 | 10 | 10 | 10 | 10 | 50 |
| 6 | 20 | 10 | 10 | 10 | 10 | 60 |
| 7 | 20 | 20 | 10 | 10 | 10 | 70 |
| 8 | 20 | 20 | 20 | 10 | 10 | 80 |
| 9 | 20 | 20 | 20 | 20 | 10 | 90 |
| 10 | 20 | 20 | 20 | 20 | 20 | 100 |
| 11 | 30 | 20 | 30 | 20 | 20 | 120 |
| 12 | 30 | 30 | 30 | 30 | 30 | 150 |
|
|
1 | 0.99 | 0.98 | 0.97 | 0.96 | 0.95 | 0.91 |
| 5.0% | 94.0% | 94.1% | 94.2% | 94.2% | 94.3% | 94.3% | 94.5% |
| 10.0% | 93.4% | 94.8% | 94.0% | 94.1% | 94.2% | 94.3% | 94.7% |
| 15.0% | 92.8% | 93.4% | 93.7% | 93.9% | 94.1% | 94.3% | 94.9% |
| 20.0% | 92.2% | 93.1% | 93.5% | 93.8% | 94.0% | 94.3% | 95.2% |
| 25.0% | 91.5% | 92.7% | 93.2% | 93.6% | 94.0% | 94.2% | 95.4% |
| 30.0% | 90.6% | 92.3% | 92.9% | 93.4% | 93.8% | 94.2% | 95.7% |
| 35.0% | 89.5% | 91.7% | 92.5% | 93.2% | 93.7% | 94.2% | 96.0% |
| 40.0% | 88.2% | 91.1% | 92.2% | 93.0% | 93.6% | 94.2% | 96.3% |
| 45.0% | 86.4% | 90.5% | 91.7% | 92.7% | 91.8% | 94.1% | 96.7% |
| 50.0% | 84.0% | 89.4% | 91.1% | 92.3% | 91.0% | 94.1% | 97.1% |
| 55.0% | 80.8% | 88.0% | 90.4% | 91.9% | 91.0% | 94.0% | 97.4% |
| 60.0% | 77.0% | 86.3% | 89.7% | 91.4% | 91.0% | 94.0% | 97.7% |
| 65.0% | 71.6% | 83.8% | 88.2% | 90.8% | 91.0% | 93.9% | 97.7% |
| 70.0% | 63.5% | 78.4% | 85.0% | 89.5% | 91.0% | 93.8% | 92.8% |
| 80.0% | 43.5% | 63.6% | 76.3% | 86.0% | 91.0% | 93.5% | 76.7% |
| 90.0% | 22.3% | 32.8% | 39.7% | 45.5% | 51.7% | 59.1% | 39.0% |
| 100.0% | 1.1% | 2.0% | 3.0% | 5.0% | 12.4% | 24.7% | 1.3% |