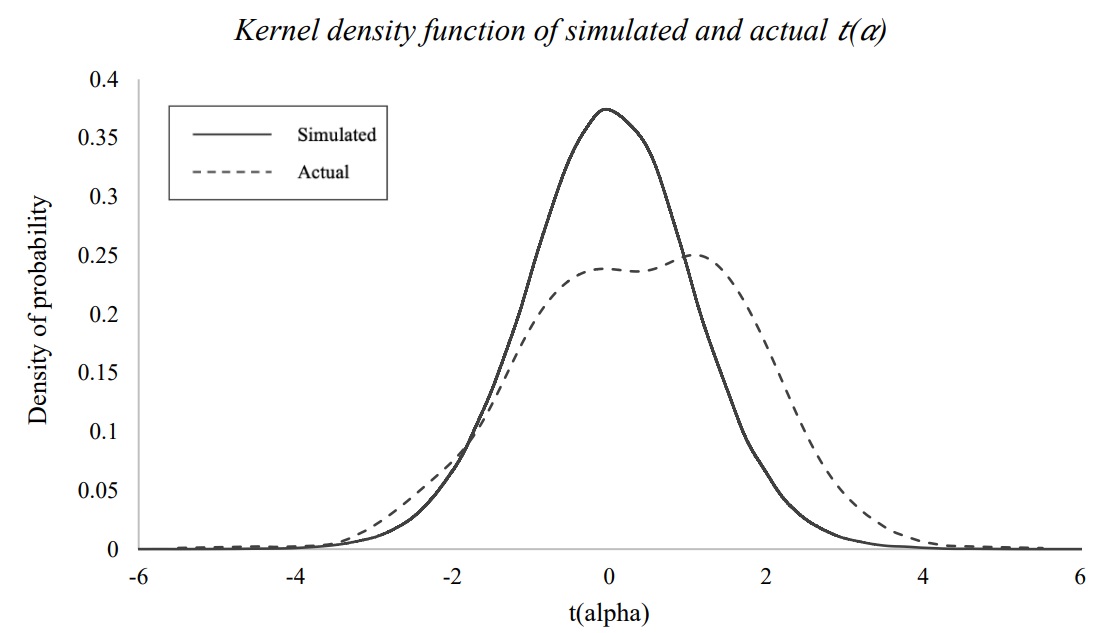
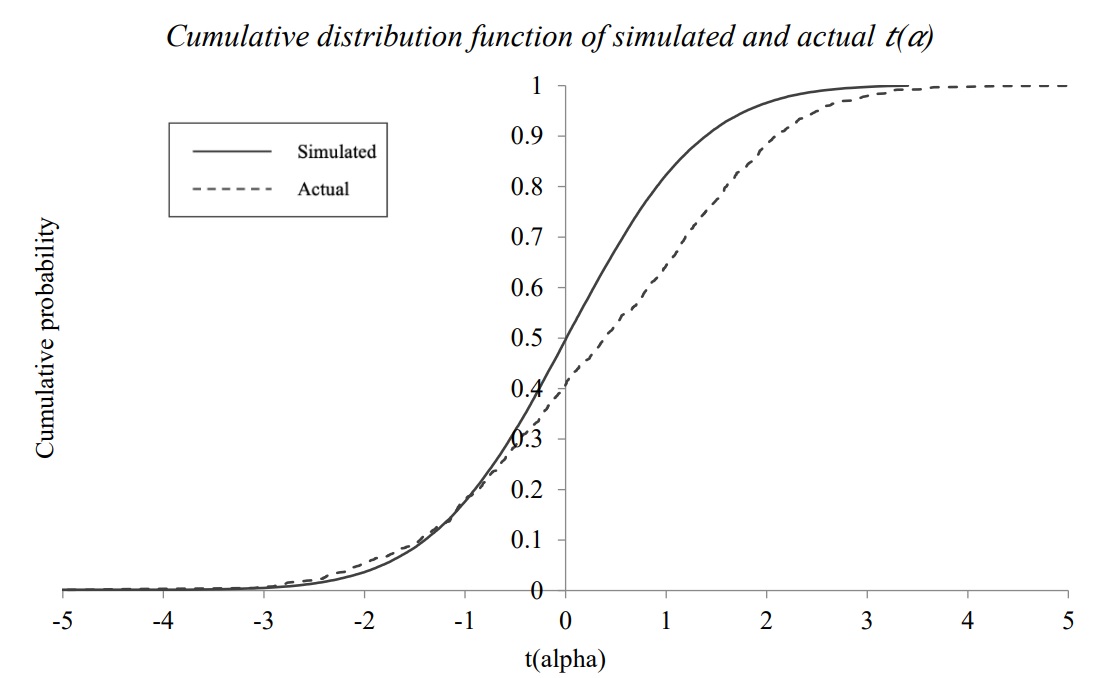
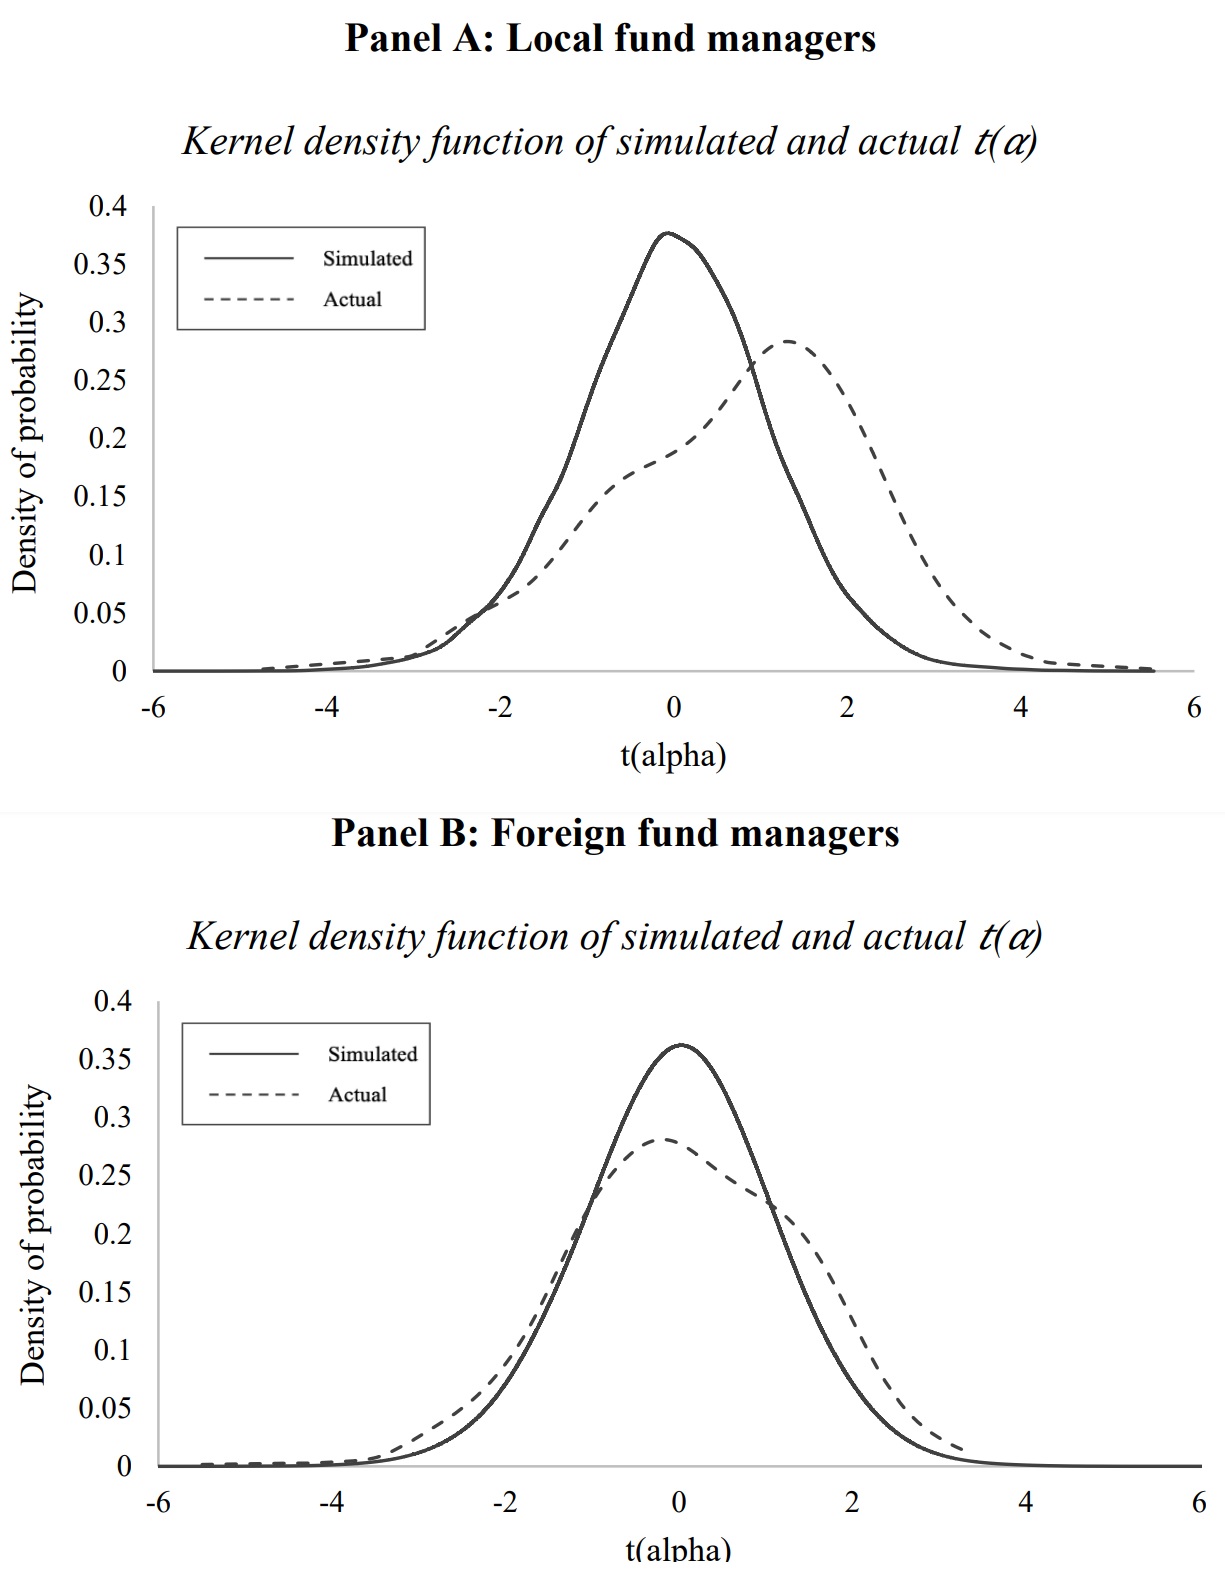
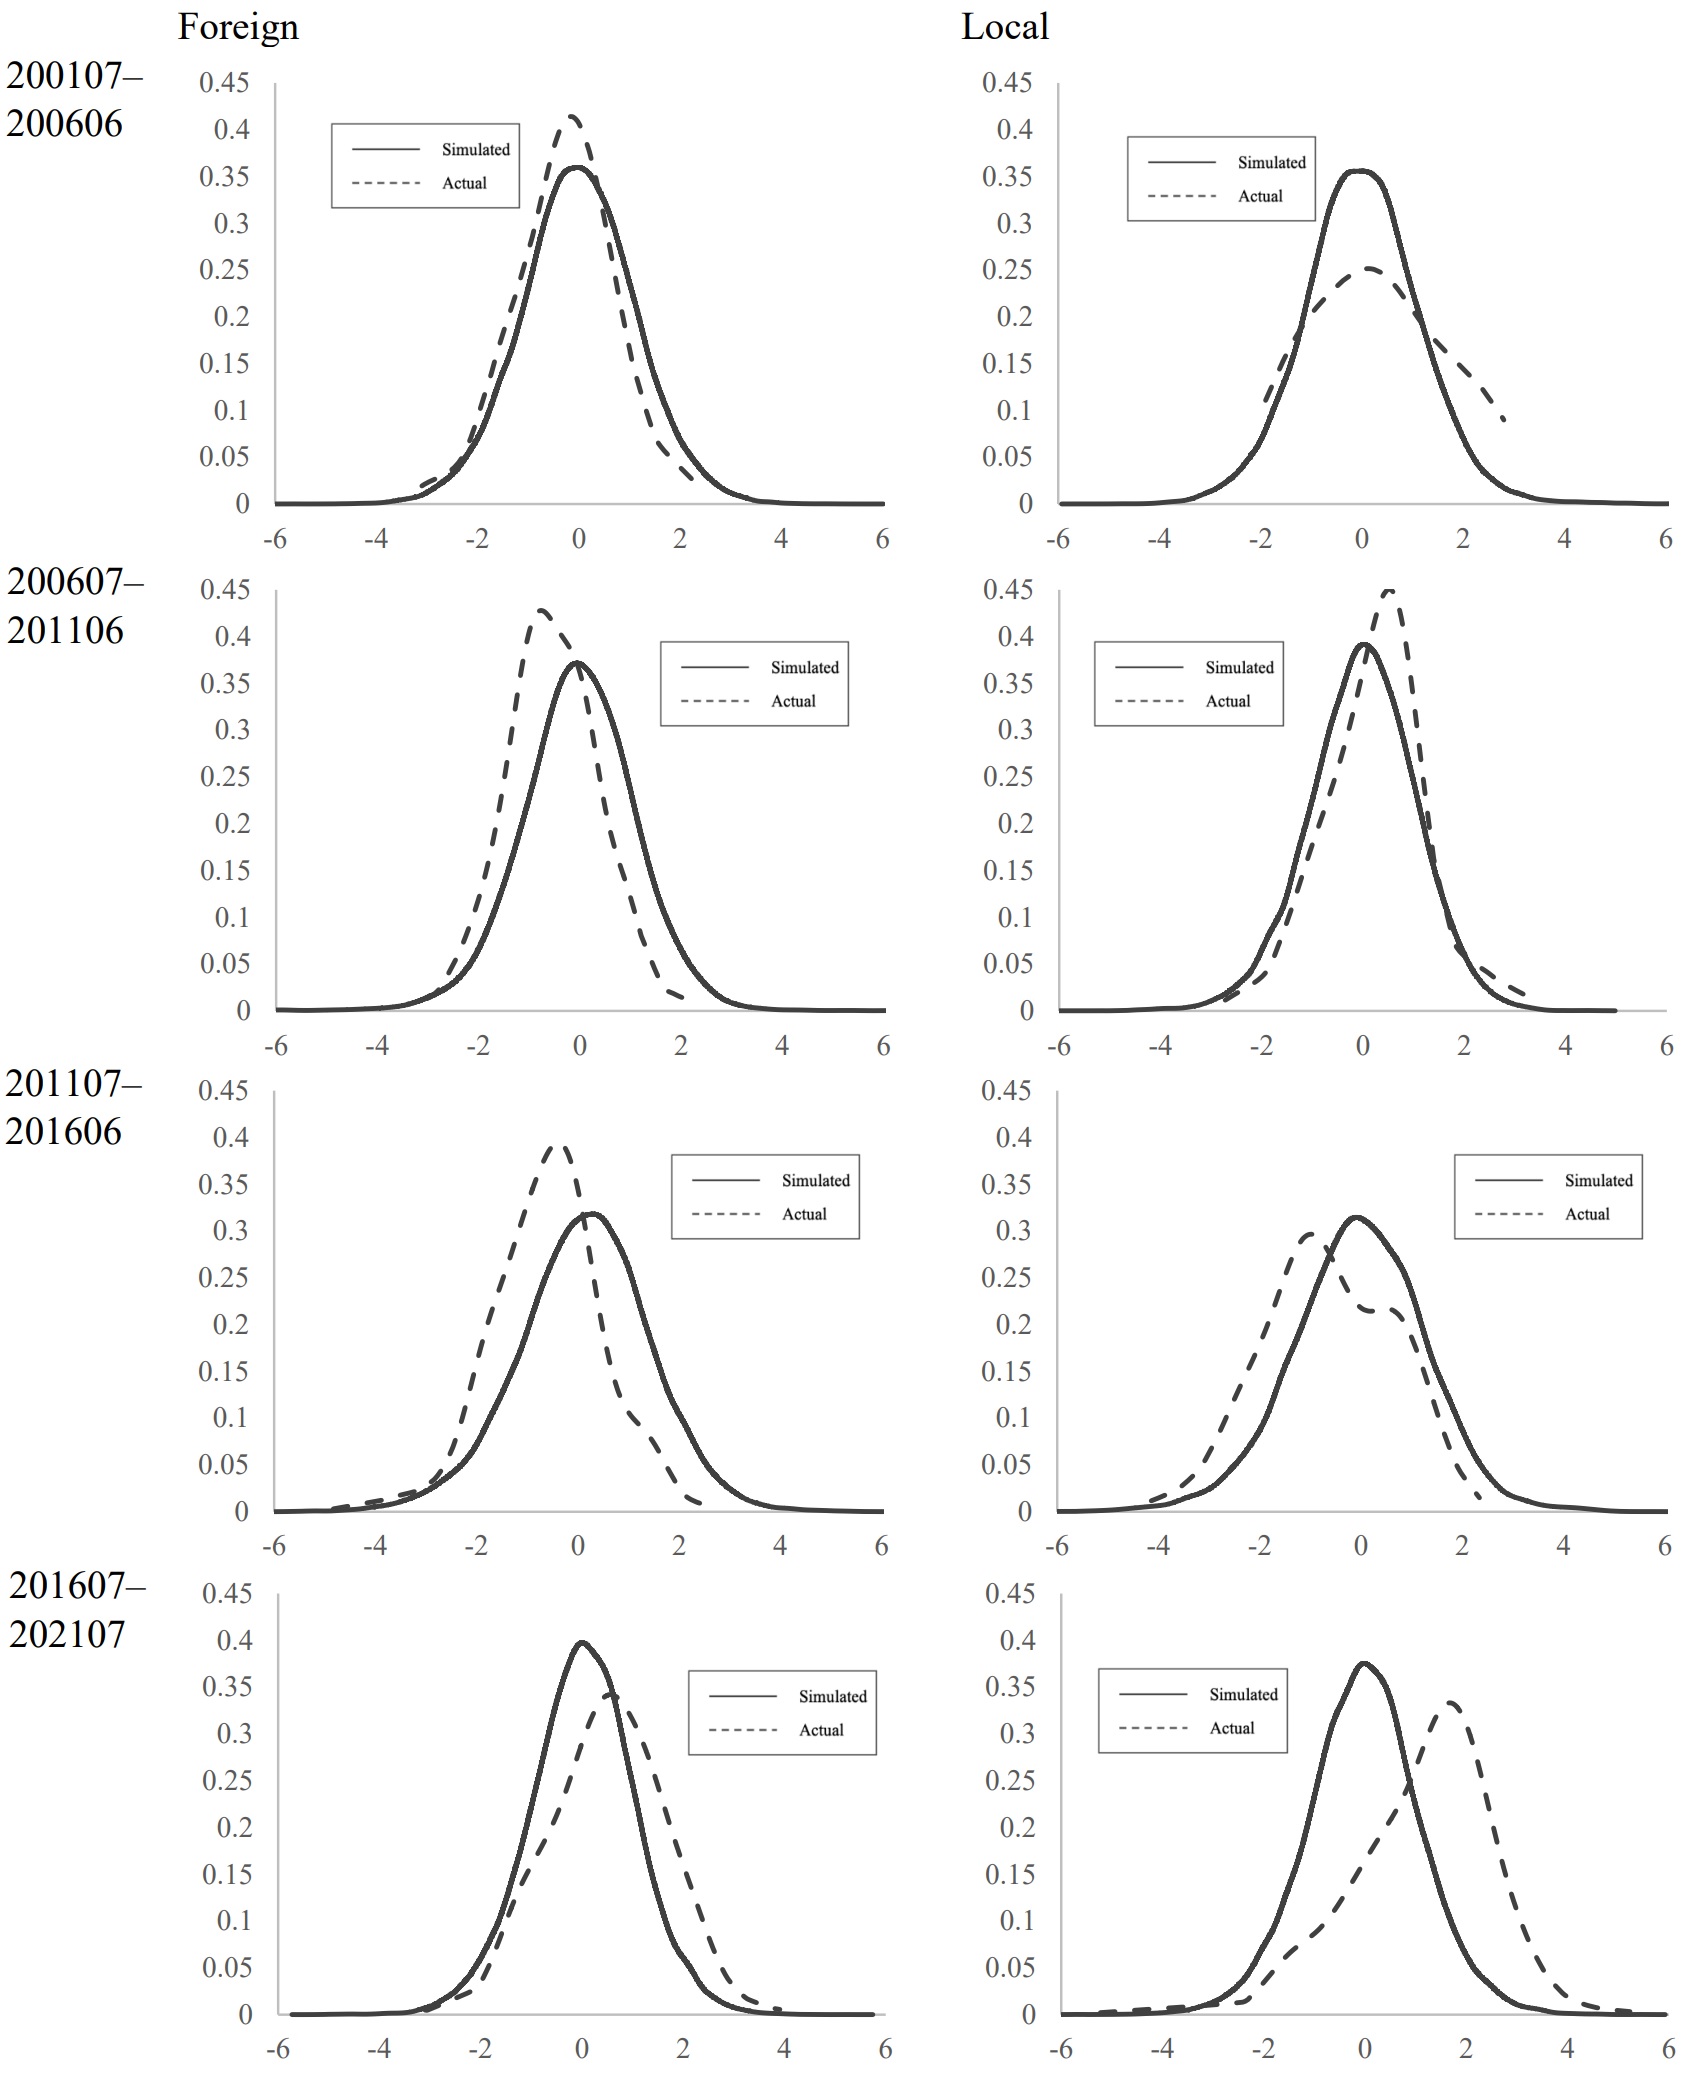
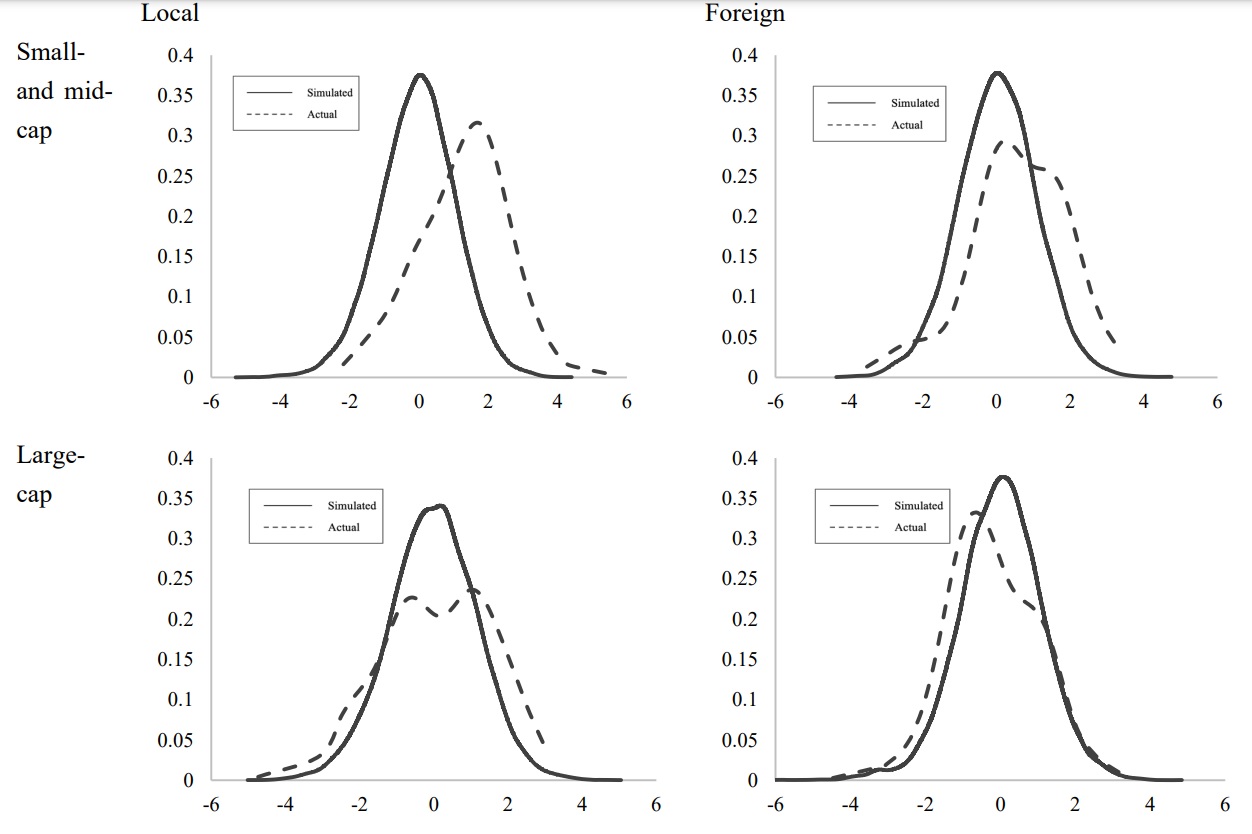
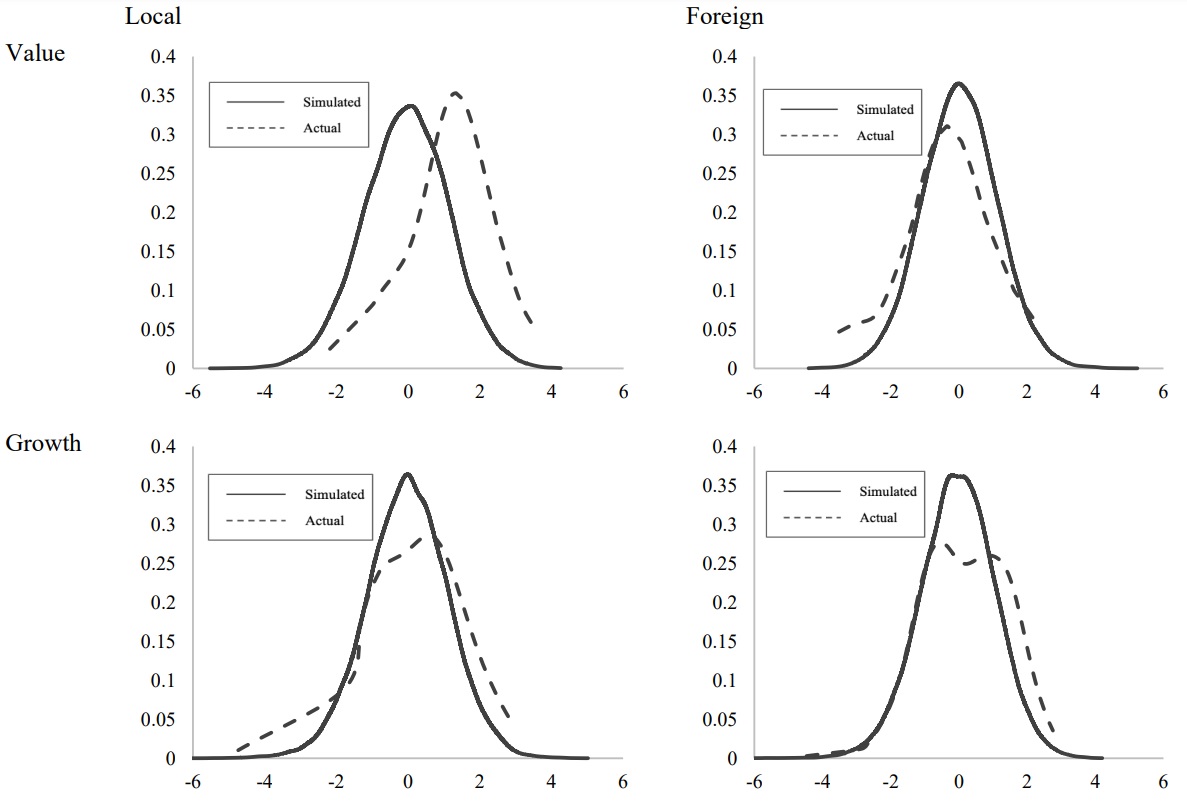
A bootstrap and a subsequent injected alpha analysis were conducted on 1,221 Chinese mutual funds that were active at some point between July 2001 and July 2021. The results show that most active managers achieve a positive risk-adjusted return. Additionally, we find that this phenomenon is primarily attributable to local (i.e., Chinese) fund managers. We argue that one explanation for the different levels of risk-adjusted returns observed is the information asymmetry between foreign and local fund managers. Additional results support this view, as fund managers primarily investing in small- to mid-cap and value stocks provide a superior performance, which inherently exhibit greater information asymmetry. The findings are contrary to those from similar studies in developed markets, where only a few active managers demonstrate actual skill in their performance.
Citation: Julius Nickelsen, Olaf Stotz. Do fund managers in the Chinese mutual fund market deliver positive risk-adjusted returns? Yes, but it is mainly observed for local fund managers[J]. Quantitative Finance and Economics, 2023, 7(4): 595-621. doi: 10.3934/QFE.2023029
A bootstrap and a subsequent injected alpha analysis were conducted on 1,221 Chinese mutual funds that were active at some point between July 2001 and July 2021. The results show that most active managers achieve a positive risk-adjusted return. Additionally, we find that this phenomenon is primarily attributable to local (i.e., Chinese) fund managers. We argue that one explanation for the different levels of risk-adjusted returns observed is the information asymmetry between foreign and local fund managers. Additional results support this view, as fund managers primarily investing in small- to mid-cap and value stocks provide a superior performance, which inherently exhibit greater information asymmetry. The findings are contrary to those from similar studies in developed markets, where only a few active managers demonstrate actual skill in their performance.

| [1] |
Agyei-Ampomah S, Clare A, Mason A, et al. (2015) On luck versus skill when performance benchmarks are style-consistent. J Bank Financ 59: 127–145. https://doi.org/10.1016/j.jbankfin.2015.05.013 doi: 10.1016/j.jbankfin.2015.05.013

|
| [2] |
Ayers BC, Ramalingegowda S, Yeung PE (2011) Hometown advantage: The effects of monitoring institution location on financial reporting discretion. J Account Econ 52: 41–61. https://doi.org/10.1016/j.jacceco.2011.03.003 doi: 10.1016/j.jacceco.2011.03.003
|
| [3] |
Berk J, van Binsbergen JH (2015) Measuring skill in the mutual fund industry. J Financ Econ 118: 1–20. https://doi.org/10.1016/j.jfineco.2015.05.002 doi: 10.1016/j.jfineco.2015.05.002
|
| [4] |
Blake D, Caulfield T, Ioannidis C, et al. (2017) New evidence on mutual fund performance: a comparison of alternative bootstrap methods. J Financial Quant Anal 52: 1279–1299. https://doi.org/10.1017/S0022109017000229 doi: 10.1017/S0022109017000229
|
| [5] |
Carhart MM (1997) On persistence in mutual fund performance. The Journal of Finance 52: 57–82. https://doi.org/10.2307/2329556 doi: 10.2307/2329556
|
| [6] |
Chan K, Covrig V, Ng L (2005) What determines the domestic bias and foreign bias? Evidence from mutual fund equity allocations worldwide. J Finance 60: 1495–1534. https://doi.org/10.1111/j.1540-6261.2005.768_1.x doi: 10.1111/j.1540-6261.2005.768_1.x
|
| [7] |
Chen X, Wu C (2022) Retail investor attention and asymmetry: evidence from China. Pacific-Basin Finance J 75: 1–19. https://doi.org/10.1016/j.pacfin.2022.101847 doi: 10.1016/j.pacfin.2022.101847
|
| [8] |
Chung CY, Sul HK, Wang K (2021) A tale of two forms of proximity: Geography and market. J Bus Res 122: 14–23. https://doi.org/10.1016/j.jbusres.2020.08.060 doi: 10.1016/j.jbusres.2020.08.060
|
| [9] |
Cuthbertson K, Nitzsche D (2013) Performance, stock selection and market timing of the German equity mutual fund industry. J Empir Finance 21: 86–101. https://doi.org/10.1016/j.jempfin.2012.12.002 doi: 10.1016/j.jempfin.2012.12.002
|
| [10] |
Cochrane JH (2011) Presidential address: Discount rates. J Finance 66: 1047–1108. https://doi.org/10.1111/j.1540-6261.2011.01671.x doi: 10.1111/j.1540-6261.2011.01671.x
|
| [11] |
Corbet S, Hou Y, Hu Y, et al. (2020) The influence of the COVID-19 pandemic on asset-price discovery: Testing the case of Chinese informational asymmetry. Int Rev Financial Anal 72: 1015–1060. https://doi.org/10.1016/j.irfa.2020.101560 doi: 10.1016/j.irfa.2020.101560
|
| [12] |
Cornell B, Hsu J, Kiefer P, et al. (2020) Assessing mutual fund performance in China. J Portf Manag 46: 118–127. https://doi.org/10.3905/jpm.2020.1.140 doi: 10.3905/jpm.2020.1.140
|
| [13] |
Deng Y, Xu Y (2014) Do institutional investors have superior stock selection ability in China? China J Account Res 4: 107–119. https://doi.org/10.1016/j.cjar.2011.06.001 doi: 10.1016/j.cjar.2011.06.001
|
| [14] |
Fama EF, French KR (1993) Common risk factors in the returns on stocks and bonds. J Financ Econ 33: 3–56. https://doi.org/10.1016/0304-405X(93)90023-5 doi: 10.1016/0304-405X(93)90023-5
|
| [15] |
Fama EF, French KR (2010) Luck versus skill in the cross-section of mutual fund returns. J Finance 65:1915–1947. https://doi.org/10.1111/j.1540-6261.2010.01598.x doi: 10.1111/j.1540-6261.2010.01598.x
|
| [16] |
Fama EF, French KR (2015) A five-factor asset pricing model. J Financ Econ 116: 1–22. https://doi.org/10.1016/j.jfineco.2014.10.010 doi: 10.1016/j.jfineco.2014.10.010
|
| [17] |
Fama EF, French KR (2018) Choosing factors. J Financ Econ 128: 234–252. https://doi.org/10.1016/j.jfineco.2018.02.012 doi: 10.1016/j.jfineco.2018.02.012
|
| [18] |
Ferreira MA, Matos P, Pereira JP, et al. (2017) Do locals know better? A comparison of the performance of local and foreign institutional investors. J Bank Financ 82: 1–164. https://doi.org/10.1016/j.jbankfin.2017.06.002 doi: 10.1016/j.jbankfin.2017.06.002
|
| [19] | Fifield SG, Jetty J (008) Further evidence on the efficiency of the Chinese stock markets: A note. Res Int Bus Finance 22: 351–361. https://doi.org/10.1016/j.ribaf.2008.02.002 |
| [20] |
Gao J, O'Sullivan N, Sherman M (2020) An evaluation of Chinese securities investment fund performance. Q Rev Econ Finance 76: 249–259. https://doi.org/10.1016/j.qref.2019.08.007 doi: 10.1016/j.qref.2019.08.007
|
| [21] |
Gao J, O'Sullivan N, Sherman M (2021) Chinese securities investment funds: The role of luck in performance. Rev Account Financ 20: 271–297. https://doi.org/10.1108/RAF-07-2020-0182 doi: 10.1108/RAF-07-2020-0182
|
| [22] |
Grinblatt M, Keloharju M (2000) The investment behavior and performance of various investor types: A study of Finland unique data set. J Financ Econ 55: 43–67. https://doi.org/10.1016/S0304-405X(99)00044-6 doi: 10.1016/S0304-405X(99)00044-6
|
| [23] |
Harvey CH, Liu Y (2020) False (and missed) discoveries in financial economics. J Finance 75: 2503–2553. https://doi.org/10.1111/jofi.12951 doi: 10.1111/jofi.12951
|
| [24] |
Jensen MC (1968) The performance of mutual funds in the period 1945–1964. J Finance 23: 389–416. https://doi.org/10.1111/j.1540-6261.1968.tb00815.x doi: 10.1111/j.1540-6261.1968.tb00815.x
|
| [25] |
Kiymaz H (2015) A performance evaluation of Chinese mutual funds. In J Emer Mark 10: 820–836. https://doi.org/10.1108/IJoEM-09-2014-0136 doi: 10.1108/IJoEM-09-2014-0136
|
| [26] |
Kosowski R, Timmermann A, Wermers R, et al. (2006) Can mutual fund "stars" really pick stocks? New evidence from a bootstrap analysis. J Finance 61: 2551–2595. https://doi.org/10.1111/j.1540-6261.2006.01015.x doi: 10.1111/j.1540-6261.2006.01015.x
|
| [27] |
Koutmos D, Wu B, Zhang Q (2020) In search of winning mutual funds in the Chinese stock market. Rev Quant Finance Account 54: 589–616. https://doi.org/10.1007/s11156-019-00800-z doi: 10.1007/s11156-019-00800-z
|
| [28] |
Kutan AM, Lin H, Sun PW, et al. (2018) A reliable performance measure to differentiate China's actively managed open-end equity mutual funds. Appl Econ 50: 5592–5603. https://doi.org/10.1080/00036846.2018.1488055 doi: 10.1080/00036846.2018.1488055
|
| [29] |
Leuz C, Lins KV, Warnock FE (2008) Do foreigners invest less in poorly governed firms? Rev Financ Stud 22: 3245–3285. https://doi.org/10.1093/rfs/hhn089 doi: 10.1093/rfs/hhn089
|
| [30] |
Li S, Brockman P, Zurbruegg R (2015) Cross-listing, firm-specific information, and corporate governance: Evidence from Chinese A-shares and H-shares. J Corp Finance 32: 347–362. https://doi.org/10.1016/j.jcorpfin.2014.10.008 doi: 10.1016/j.jcorpfin.2014.10.008
|
| [31] |
Li Y, Yan D, Greco J (2006) Market segmentation and price differentials between A shares and H shares in the Chinese stock markets. J Multinatl Financial Manag 16: 232–248. https://doi.org/10.1016/j.mulfin.2005.07.003 doi: 10.1016/j.mulfin.2005.07.003
|
| [32] |
Liang Q, Liao J, Leng L (2021) Social interactions and mutual fund portfolios: The role of alumni networks in China. China Financ Rev Int 12: 433–450. https://doi.org/10.1108/CFRI-04-2021-0073 doi: 10.1108/CFRI-04-2021-0073
|
| [33] |
Malloy C (2005) The geography of equity analysis. J Finance 60: 719–755. https://doi.org/10.1111/j.1540-6261.2005.00744.x doi: 10.1111/j.1540-6261.2005.00744.x
|
| [34] |
Mondria J, Wang X, Wu T (2021) Familiarity and surprises in international financial markets: bad news travel like wildfire, good news travels slow. J Int Money Finance 115: 1–16. https://doi.org/10.1016/j.jimonfin.2021.102390 doi: 10.1016/j.jimonfin.2021.102390
|
| [35] | MSCI (2021) MSCI China All Shares Index (USD) Factsheet (July). |
| [36] | Parshakov P (2014) Russian Mutual Funds: Skill vs. Luck. https://dx.doi.org/10.2139/ssrn.2539490 |
| [37] |
Pilbeam K, Preston H (2019) An empirical investigation of the performance of Japanese mutual funds: Skill or luck? Int J Financ Stud 7: 6. https://doi.org/10.3390/ijfs7010006 doi: 10.3390/ijfs7010006
|
| [38] |
Rao Z, Ahsan T, Tauni MZ, et al. (2018) Performance and persistence in performance of actively managed Chinese equity funds. J Quant Econ 16: 727–747. https://doi.org/10.1007/s40953-017-0104-5 doi: 10.1007/s40953-017-0104-5
|
| [39] |
Seddighi HR, Nian W (2004) The Chinese stock exchange market: operations and efficiency. Appl Financial Econ 14: 785–797. https://doi.org/10.1080/0960310042000180826 doi: 10.1080/0960310042000180826
|
| [40] |
Suh S, Hong K (2011) Control of luck in measuring investment fund performance. Asia‐Pacific J Financ Stud 40: 467–493. https://doi.org/10.1111/j.2041-6156.2011.01046.x doi: 10.1111/j.2041-6156.2011.01046.x
|
| [41] |
Titman S, Wei C, Zhao R (2021) Corporate actions and the manipulation of retail investors in China: an analysis of stock splits. J Financ Econ 145: 762–787. https://doi.org/10.1016/j.jfineco.2021.09.018 doi: 10.1016/j.jfineco.2021.09.018
|
| [42] |
Wagner M, Margaritis D (2017) All about fun(ds) in emerging markets? The case of equity mutual funds. Emerg Mark Rev 22: 62–78. https://doi.org/10.1016/j.ememar.2017.08.004 doi: 10.1016/j.ememar.2017.08.004
|
| [43] |
Yang L, Liu W (2017) Luck versus skill: Can Chinese funds beat the market? Emerg Mark Finance and Trade 53: 629–643. https://doi.org/10.1080/1540496X.2015.1097951 doi: 10.1080/1540496X.2015.1097951
|
 QFE-07-04-029-s001.pdf QFE-07-04-029-s001.pdf |
 |
Figures(6) / Tables(7)

Julius Nickelsen, Olaf Stotz. Do fund managers in the Chinese mutual fund market deliver positive risk-adjusted returns? Yes, but it is mainly observed for local fund managers[J]. Quantitative Finance and Economics, 2023, 7(4): 595-621. doi: 10.3934/QFE.2023029


 DownLoad: