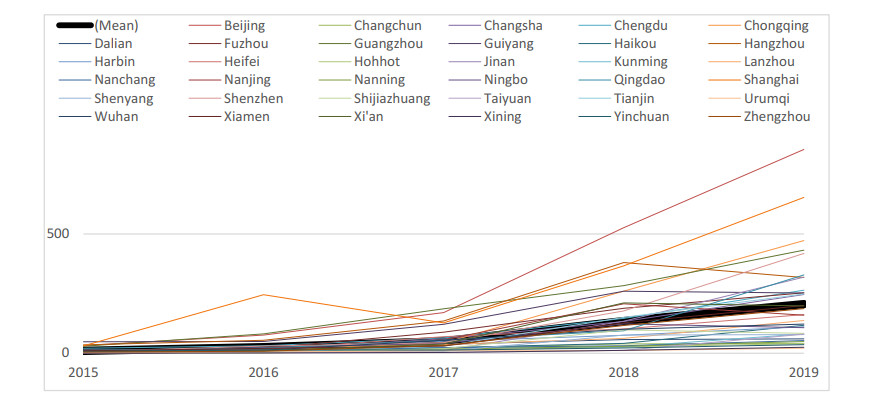
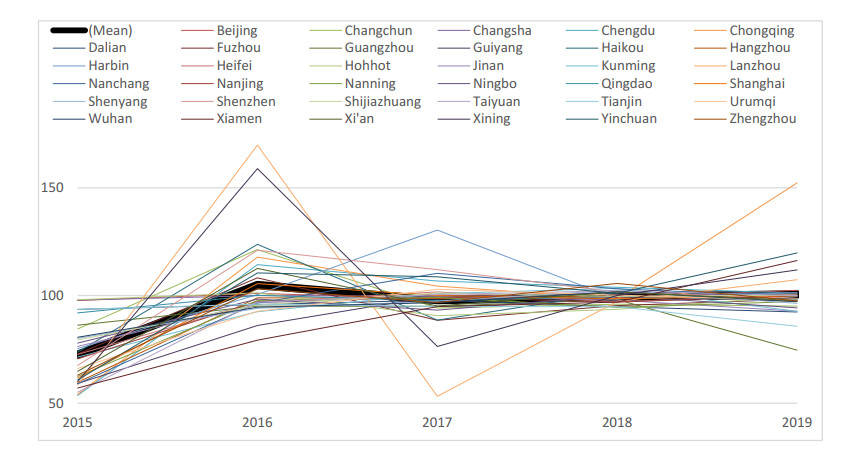
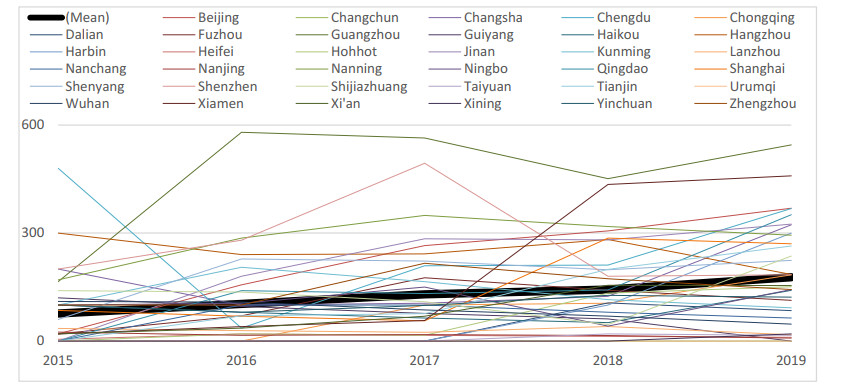
The key to balancing economic transformation and improving quality development is financial supporting green development. The relationship between financial technology (fintech) and green development has gradually emerged recently. Based on the data of 35 major cities in China from 2015 to 2019, the fintech development index and green total factor productivity (GTFP) are obtained by adopting web crawler technology and Bootstrap-SBM-GML model respectively; further, the impact of urban fintech level on GTFP is also revealed by taking the financial support policy index (FSP) as the instrumental variable. The empirical research shows the following results. First, the level of fintech and financial support policy indicators show a steady upward trend in the study period; whereas the tendency of GTFP is not obvious. Second, the urban fintech level has a significant promoting effect on GTFP through FE, MM-QR and 2SLS models. Specifically, the promoting effect mainly comes from the promotion of technological change (TC) of the GTFP decomposition index; the promoting effect will be greater in the lower cities of green development level. Third, industrial structure upgrading (UIS) and technological innovation (TI) play an intermediary role in the green development effect of fintech. Four, the green development effect of fintech is heterogeneous. Specifically, the green development effect of fintech on GTFP is larger in the central and western regions and low-level cities; whereas it is smaller in the eastern part regions and high-level cities.
Citation: Yanyan Yao, Dandan Hu, Cunyi Yang, Yong Tan. The impact and mechanism of fintech on green total factor productivity[J]. Green Finance, 2021, 3(2): 198-221. doi: 10.3934/GF.2021011
The key to balancing economic transformation and improving quality development is financial supporting green development. The relationship between financial technology (fintech) and green development has gradually emerged recently. Based on the data of 35 major cities in China from 2015 to 2019, the fintech development index and green total factor productivity (GTFP) are obtained by adopting web crawler technology and Bootstrap-SBM-GML model respectively; further, the impact of urban fintech level on GTFP is also revealed by taking the financial support policy index (FSP) as the instrumental variable. The empirical research shows the following results. First, the level of fintech and financial support policy indicators show a steady upward trend in the study period; whereas the tendency of GTFP is not obvious. Second, the urban fintech level has a significant promoting effect on GTFP through FE, MM-QR and 2SLS models. Specifically, the promoting effect mainly comes from the promotion of technological change (TC) of the GTFP decomposition index; the promoting effect will be greater in the lower cities of green development level. Third, industrial structure upgrading (UIS) and technological innovation (TI) play an intermediary role in the green development effect of fintech. Four, the green development effect of fintech is heterogeneous. Specifically, the green development effect of fintech on GTFP is larger in the central and western regions and low-level cities; whereas it is smaller in the eastern part regions and high-level cities.

| [1] |
Charnes A, Cooper WW, Rhodes E (1978) Measuring the efficiency of decision making units. Eur J Oper Re 2: 429-444. doi: 10.1016/0377-2217(78)90138-8

|
| [2] | Broner FA, Bustos P, Carvalho VM (2012) Sources of comparative advantage in polluting industries. CEPR Discuss Pap 9111. |
| [3] |
Canay IA (2011) A simple approach to quantile regression for panel data. Economet J 14: 368-386. doi: 10.1111/j.1368-423X.2011.00349.x
|
| [4] |
Caves DW, Christensen LR, Diewert WE (1982) The economic theory of index numbers and the measurement of input, output, and productivity. Econometrica 50: 1393-1414. doi: 10.2307/1913388
|
| [5] |
Chemla G, Tinn K (2020) Learning through crowdfunding. Manage Sci 66: 1783-1801. doi: 10.1287/mnsc.2018.3278
|
| [6] |
Chen C, Lan Q, Gao M, et al. (2018) Green total factor productivity growth and its determinants in China's industrial economy. Sustainability 10: 1-25. doi: 10.3390/su10020001
|
| [7] | Chen MA, Wu QX, Yang BZ (2019) How valuable is fintech innovation? Rev Financ Stud 32: 2062-2106. |
| [8] |
Cui H, Wang H, Zhao Q (2019) Which factors stimulate industrial green total factor productivity growth rate in China? An industrial aspect. Greenh Gases 9: 505-518. doi: 10.1002/ghg.1874
|
| [9] |
D'acunto F, Prabhala N, Rossi AG (2019) The promises and pitfalls of robo-advising. Rev Financ Stud 32: 1983-2020. doi: 10.1093/rfs/hhz014
|
| [10] |
Demirguec-Kunt A, Kane E, Laeven L (2015) Deposit insurance around the world: A comprehensive analysis and database. J Financ Stabil 20: 155-183. doi: 10.1016/j.jfs.2015.08.005
|
| [11] | Deng X, Cheng X (2019) Can ESG indices improve the enterprises' stock market performance?—An empirical study from China. Sustainability 11: 4765. |
| [12] |
Dong H, Liu Y, Chang J (2019) The heterogeneous linkage of economic policy uncertainty and oil return risks. Green Financ 1: 46-66. doi: 10.3934/GF.2019.1.46
|
| [13] |
Färe R, Grosskopf S, Lindgren B, et al. (1992) Productivity changes in Swedish pharamacies 1980-1989: a non-parametric malmquist approach. J Prod Anal 3: 85-101. doi: 10.1007/BF00158770
|
| [14] | Färe R, Grosskopf S, Norris M, et al. (1994) Productivity growth, technical progress, and efficiency change in industrialized countries. Am Econ Rev 84: 66-83. |
| [15] |
Fuster A, Plosser M, Schnabl P, et al. (2019) The role of technology in Mortgage lending. Rev Financ Stud 32: 1854-1899. doi: 10.1093/rfs/hhz018
|
| [16] |
Hendershott T, Riordan R (2013) Algorithmic trading and the market for liquidity. J Financ Quant Anal 48: 1001-1024. doi: 10.1017/S0022109013000471
|
| [17] |
Hering L, Poncet S (2014) Environmental policy and exports: evidence from Chinese cities. J Environ Econ Manage 68: 296-318. doi: 10.1016/j.jeem.2014.06.005
|
| [18] |
Jalil A, Feridun M (2011) The impact of growth, energy and financial development on the environment in China: a cointegration analysis. Energy Econ 33: 284-291. doi: 10.1016/j.eneco.2010.10.003
|
| [19] |
Johnes J (2006) Data envelopment analysis and its application to the measurement of efficiency in higher education. Econ Educ Rev 25: 273-288. doi: 10.1016/j.econedurev.2005.02.005
|
| [20] |
Koenker R (2004) Quantile regression for longitudinal data. J Multivariate Anal 91: 74-89. doi: 10.1016/j.jmva.2004.05.006
|
| [21] |
Koenker R, Bassett G (1978) Regression quantiles. Econometrica 46: 33-50. doi: 10.2307/1913643
|
| [22] | Kpmg (2018) Global Fintech investment soars to record US$\$$57B in first half of 2018. The Pulse of Fintech 2018. |
| [23] | Lee CC, Chen MP, Lee CC (2021) Investor attention, ETF returns, and country-specific factors. Res Int Bus Financ 56: 101386. |
| [24] | Li F, Yang C, Li Z, et al. (2021) Does geopolitics have an impact on energy trade? Empirical research on emerging countries. Sustainability 13: 5199. |
| [25] | Li T, Ma J, Mo B (2021) Does the land market have an impact on green total factor productivity? A case study on China. Land 10: 595. |
| [26] |
Liao G, Drakeford BM (2019) An analysis of financial support, technological progress and energy efficiency:evidence from China. Green Financ 1: 174-187. doi: 10.3934/GF.2019.2.174
|
| [27] |
Liu Z, Xin L (2019) Dynamic analysis of spatial convergence of green total factor productivity in China's primary provinces along its Belt and Road Initiative. Chin J Popul Resour Environ 17: 101-112. doi: 10.1080/10042857.2019.1611342
|
| [28] | Lorente JC, Schmukler SL (2018) The fintech revolution: a threat to global banking? Res Policy Brief 1. |
| [29] | Lu P, Liu J, Wang Y, et al. (2021) Can industrial agglomeration improve regional green total factor productivity in China? An empirical analysis based on spatial econometrics. Growth Change. |
| [30] |
Machado JAF, Silva JMCS (2019) Quantiles via moments. J Economet 213: 145-173. doi: 10.1016/j.jeconom.2019.04.009
|
| [31] | Malmquist S (1953) Index numbers and indifference surfaces. Trabajos de Estadistica 4. |
| [32] |
Oh DH (2010) A global Malmquist-Luenberger productivity index. J Prod Anal 34: 183-197. doi: 10.1007/s11123-010-0178-y
|
| [33] | Ryu HS, Chang Y (2018) What makes users willing or hesitant to use Fintech?: The moderating effect of user type. Ind Manage Data Syst 118. |
| [34] | Singh SK, Del Giudice M, Chierici R, et al. (2020) Green innovation and environmental performance: The role of green transformational leadership and green human resource management. Technol Forecast Soc Change 150: 119762. |
| [35] | Sobehart JR (2016) The FinTech revolution: quantifying earnings uncertainty and credit risk in competitive business environments with disruptive technologies. J Risk Manage Financ I 9: 163-174. |
| [36] |
Song M, Du J, Tan KH (2018) Impact of fiscal decentralization on green total factor productivity. Int J Prod Econ 205: 359-367. doi: 10.1016/j.ijpe.2018.09.019
|
| [37] |
Tone K (2001) A slacks-based measure of efficiency in data envelopment analysis. Eur J Oper Res 130: 498-509. doi: 10.1016/S0377-2217(99)00407-5
|
| [38] |
Tone K (2002) A slacks-based measure of super-efficiency in data envelopment analysis. Eur J Oper Res 143: 32-41. doi: 10.1016/S0377-2217(01)00324-1
|
| [39] | Vallee B, Zeng Y (2019) Marketplace lending: a new banking paradigm? Rev Financ Stud 32: 1939-1982. |
| [40] | Wang M, Li Y, Liao G (2021) Research on the impact of green technology innovation on energy total factor productivity-based on provincial data of China. Front Environ Sci. |
| [41] | Yang C, Li T, Albitar K (2021) Does energy efficiency affect ambient PM2.5? The moderating role of energy investment. Front Environ Sci. |
| [42] | Zavolokina L, Dolata M, Schwabe G (2016) FinTech-What's in a name? Thirty Seventh International Conference on Information Systems. |
| [43] | Zhong J, Li T (2020) Impact of financial development and its spatial spillover effect on green total factor productivity: evidence from 30 Provinces in China. Math Probl Eng 2020. |
| [44] |
Zhong J, Wang M, Drakeford BM, et al. (2019) Spillover effects between oil and natural gas prices: Evidence from emerging and developed markets. Green Financ 1: 30-45. doi: 10.3934/GF.2019.1.30
|
Figures(3) / Tables(15)

Yanyan Yao, Dandan Hu, Cunyi Yang, Yong Tan. The impact and mechanism of fintech on green total factor productivity[J]. Green Finance, 2021, 3(2): 198-221. doi: 10.3934/GF.2021011


 DownLoad: