Citation: Ankit Kumar Begwani, Taha Selim Ustun. Electric bus migration in Bengaluru with dynamic charging technologies[J]. AIMS Energy, 2017, 5(6): 944-959. doi: 10.3934/energy.2017.6.944
[1] | Yuan Liu, Ruilong Deng, Hao Liang . Game-theoretic control of PHEV charging with power flow analysis. AIMS Energy, 2016, 4(2): 379-396. doi: 10.3934/energy.2016.2.379 |
[2] | Edwin Collado, Easton Li Xu, Hang Li, Shuguang Cui . Profit maximization with customer satisfaction control for electric vehicle charging in smart grids. AIMS Energy, 2017, 5(3): 529-556. doi: 10.3934/energy.2017.3.529 |
[3] | Anbazhagan Geetha, S. Usha, J. Santhakumar, Surender Reddy Salkuti . Forecasting of energy consumption rate and battery stress under real-world traffic conditions using ANN model with different learning algorithms. AIMS Energy, 2025, 13(1): 125-146. doi: 10.3934/energy.2025005 |
[4] | Mansoor Soomro, Zeeshan Ali Shaikh, Mazhar Baloch, Abdul Manan Shaikh, Sohaib Tahir Chauhdary . Development of wind and solar systems for power charging: An application of an electric vehicle to grid systems. AIMS Energy, 2024, 12(3): 664-685. doi: 10.3934/energy.2024031 |
[5] | Imam Abadi, Chairul Imron, Mohammad Musa Bachrowi, Dwi Nur Fitriyanah . Design and implementation of battery charging system on solar tracker based stand alone PV using fuzzy modified particle swarm optimization. AIMS Energy, 2020, 8(1): 142-155. doi: 10.3934/energy.2020.1.142 |
[6] | Saad Jarid, Manohar Das . An Electro-Thermal Model based fast optimal charging strategy for Li-ion batteries. AIMS Energy, 2021, 9(5): 915-933. doi: 10.3934/energy.2021043 |
[7] | Austin Bushur, Kevin Ward, Tommy Flahaven, Tom Kelly, Jin H. Jo, Matt Aldeman . Techno-economic evaluation of installing EV and PV combined infrastructure on Academic Institution’s Parking Garages in Illinois, USA. AIMS Energy, 2019, 7(1): 31-45. doi: 10.3934/energy.2019.1.31 |
[8] | R. H. Almeida, M. C. Brito . A review of technical options for solar charging stations in Asia and Africa. AIMS Energy, 2015, 3(3): 428-449. doi: 10.3934/energy.2015.3.428 |
[9] | Kritanjali Das, Santanu Sharma . Coulombic efficiency estimation technique for eco-routing in electric vehicles. AIMS Energy, 2022, 10(3): 356-374. doi: 10.3934/energy.2022019 |
[10] | Soufiyan Bahetta, Nabil Dahhou, Rachid Hasnaoui . Comparative effectiveness of environmental regulation instruments: Case of the Moroccan electricity mix. AIMS Energy, 2021, 9(5): 1097-1112. doi: 10.3934/energy.2021050 |
Asia-pacific region has experienced a rapid economic growth over the last two decades. It is forecasted that this region will become the fastest growing source of greenhouse gas emissions globally contributing around 45% of the global energy-related carbon dioxide emissions by 2030. The region is estimated to share 38% of the total growth in the world surface transport emissions in 2050. Large cities in India, China and Latin America will more than double their share of world passenger transport emissions from 9% in 2010 to 20% in 2050. By 2030, India and China will contribute more than half of transport related emissions in the world [1].
In 2009, India had the third largest energy demand in the world after China and the United States and just ahead of Russia. India's energy demand in 2009 was 669 million tons of oil equivalent (Mtoe) which was more than double of its demand in 1990 [1]. It had the third largest energy demand in the world after China and the United States. However, India's per-capita energy consumption is 0.58 (toe/capita) which is still at a much lower level compared to the world average of 1.8, OECD of 4.28, China of 1.7 and Africa of 0.67 in 2009 [2]. With a growing economy and population, CO2 emissions are projected to rise to 540 megatons by 2050. Air pollution is a serious challenge in India. According to world health organization (WHO) every year about 600,000 people in India die from diseases directly related to air pollution. It is the sixth largest cause of death in the country [3].
By 2050, a private transport-oriented policy for Indian cities would lead to 67% of urban mobility being covered by car traffic, 17% and 5% with motorized two and three wheelers respectively making public transportation accounting to only 11%. Whereas, with a pro-public transport policy, the share of buses and other public transport forms could reach as high as 39% and making it at par with car travel share of 40% with 12% and 9% share of two and three wheelers respectively. Policies that favor car use could lead to an emission growth by 47%. Whereas, policies that favor public transport could reduce emissions by 37% [4]. It is important for India to adapt a pro-public transport policy for combatting climate change.
Internal combustion engines (ICEs) can only give a maximum efficiency of 30% [5,6]. A more sustainable alternative in required considering the increasing oil prices and the emission concerns [5]. An alternative to the India's conventional fossil fuel dependent public bus transportation system is the electric bus. Countries in Europe and America have already started to see the potential of electric buses in public transit. There are several projects underway such as European Bus System of the Future (EBSF 1 and 2) [7], Zero Emission Urban Bus System (ZeEUS) [8] and Electrification of Public Transport in Cities (ELIPTIC) [9]. While they are focusing on slightly different aspects of the research field, they all aim at creating technological innovations, uses cases and novel business models to increase the use of electric buses in urban set ups. Furthermore, they are looking at creating solutions for real-life set ups in European cities such as London, Dresden and Barcelona, since they have found that electric bus solutions at a specific location have proved to be more viable than at theoretical non-places. Giving a thorough review of electric bus research and pilot projects is clearly out of scope of this paper. However, these projects show the timeliness and importance of considering similar situations for countries like India where the population is large, growth rate is much higher and urban pollution levels are alarming. Population, traffic congestion and erratic power supply are the major concerns for the usage of electric buses in India. Integration of renewable energy into the power grid, proper route planning and use of dynamic charging technologies will help Indian cities to follow the examples from Europe and America. Previous research shows how the introduction of electric buses help with CO2 reduction [10] and even retrofitting already existing bus fleets has enormous advantages [11].
The rate of public transport in some of the Indian cities is relatively higher than world standards (Table 1). In contrast, the share in some cities of Australia and New Zealand is relatively low by world standards accounting to an average of 5% of all trips made using public transport. Cities in United States have recorded similar lower rates of about 3% of all trips. On the other hand, rates of public transport use are relatively high in both Western European (WEU) cities such as London and Paris, which is 19% of all trips, and high-income Asian cities such as Tokyo and Hong Kong recorded as high as a 30% rate [5,12,13]. As seen from above facts, it is clear that public transport usage is high in congested and densely populated cities. Similarly, Bengaluru is India's third largest city with a population of 8.47 million. With an annual per capita income of $ 1,816.30 USD, highest among metropolitan regions in India, it is the second fastest growing major metropolis in India. It is popularly known as the "Silicon Valley of India" [14,15]. Table 1 shows the modal transport distribution in Indian cities. A study conducted by Centre for Science and Environment (CSE) on motor vehicle registrations in Bengaluru indicates that more than 1,200 vehicles are registered every day.
City | Population (million) | Land Area (km2) | Private Transport | Public Transport | Para Transit | Cycle | Walk |
Mumbai | 12.5 | 603 | 15 | 45 | 7 | 6 | 27 |
Delhi | 11 | 431 | 19 | 42 | 6 | 12 | 21 |
Bengaluru | 8.4 | 226 | 25 | 35 | 7 | 7 | 26 |
Ahmedabad | 5.6 | 281 | 42 | 16 | 6 | 14 | 22 |
Out of these 250 are cars and close to 900 are two wheelers accounting to about 90% of the total registered vehicles in the city [16]. The past decade has seen an increase from 9.2% to 17.5% in households owning a four-wheeled vehicle and an increase from 32.8% to 44.3% in households owning two-wheelers [16].
Bengaluru's current traffic on roads is 2.5 times higher than its designed capacity. The travel speeds on the roads have dropped down to about 15 kmph during peak hours [12].
Spending more than 240 hours stuck in traffic each year has resulted in loss of productivity, reduced air quality, reduced quality of life, and increased costs of goods and services for the average citizens of Bengaluru [16].
Transport sector is the major source of air pollutants in Bengaluru. According to studies conducted in 2012, vehicles contributed 41% of particulate matter emissions and 67% of all NOx emissions released in the city [16].
Private vehicles, having combined mode share of 25% for all trips, are responsible for a disproportionate share of air pollutant emissions in city [17]. Two-wheelers alone contribute to more than 65% of hydrocarbons and 50% of carbon monoxide emitted by vehicular sources in Bengaluru [18]. Studies show that increasing public transportation share in the city can reduce the fuel consumption, number of vehicles and bring down the pollution levels significantly. An increase in bus share to 80% can save about 21% of fuel consumed leading to 23% reduction in total vehicles freeing road space equivalent to taking off about 418,210 cars from roads [16].
Increasing environmental concerns and unstable fuel prices have made hybrid vehicles (HEVs) and Battery Electric Vehicles (BEVs) a more sustainable replacement to the conventional fossil fuel operated vehicles. Simplified layouts of the different city bus configurations are shown in Figure 1 (ICE = Diesel Engine, TX = transmission, FD = final drive, AUX = auxiliary devices, TC = torque coupler, MC = motor/controller, BATT = battery, GEN-SET = engine-generator) [19].
Different bus configurations can be categorized as follows [20]:
• CONV: A lightweight diesel city bus.
• PAR 1: A parallel hybrid bus with ultra-capacitors as energy storage.
• PAR 2: A parallel hybrid bus with a high-power lithium-ion battery as energy storage.
• SER 1: A series hybrid bus with a high-power lithium-ion battery as energy storage.
• SER 2: A plug-in hybrid bus with a series hybrid powertrain and a high-energy lithium-ion battery as energy storage.
• EV: A full electric city bus with a high-energy lithium-ion battery as energy storage.
There is tremendous potential in electric vehicles to achieve lower energy consumption than conventional vehicles [21]. The operation range remains a challenge for passenger vehicles, however proper charge management and route planning can make the use of electric bus more feasible. The simulation results obtained from ADVISOR, a vehicle simulation program, clearly show that energy efficiency of the city bus is significantly improved by electrification [20].
There is a large variation in the energy efficiency depending on the driving cycle and bus configuration. Figure 2 presents a summary of the energy consumption variation for each bus configuration. These results show that the electric city buses have much lower energy consumption per kilometer compared to the other types of buses [20].
Electric buses are zero emission buses as fossil fuels are not used to power them. On the other hand hybrid electric buses use both electricity from charged batteries and fossil fuels as a source of power. The emissions from various hybrid bus configurations are compared in Figure 3.
The impact of the driving cycles is much higher on the emissions than on the energy consumption [20]. The average driving speed has no significant impact on the plug-in hybrid and electric city bus' energy consumption (Figure 4). The low speed operation at speeds less than 15 km/h and high number of stops per driven distance increases the energy consumption of the engine operation. Slow moving traffic and congestion will not affect the performance of a fully electric city bus when compared to the conventional light weight city bus. Thus, the performance level of the electric city bus is better than diesel buses in slow moving traffic making it apt for congested traffic conditions in urban India.
Hybrid and electric buses are more expensive to manufacture than conventional diesel buses [22,23,24]. However, the operational and maintenance cost of an electric bus is comparatively lower than the other types of buses (Figure 5). Planned operational strategies, management and integration of latest infrastructure can generate higher revenues making it more feasible in the Indian context. All the above factors lay a solid potential for incorporating the electric buses in the conventional existing bus fleet in Bengaluru, India.
Under the Jawaharlal Nehru National Urban Renewal Mission, in 2014, the BMTC planned to phase out diesel run buses for procuring CNG buses over the span of five years. Under this program, the BMTC would bear 50% of the cost of vehicles while the Centre and the State governments would provide 35% and 15% of the cost respectively [12]. However, losses incurred by the BMTC due to operational cost and increase in the salary of the employees has caused tremendous setback citing financial constraints. According to the BMTC officials, each CNG bus would cost them over INR (Indian Rupees) 8.4 million (non AC), whereas an ordinary diesel bus costs about INR 4 million. The Mileage per kilometer is 2 km per kg of CNG, but a diesel bus has a mileage of 3.8–4 km per liter. The maintenance of CNG buses is an expensive affair, for example in an ordinary bus the oil is changed about 12 times, whereas oil is changed 100 times in a CNG bus during its lifespan. Delhi transport service incurred a loss of about INR 29.140 billion due to operation of CNG buses which was subsidized by the government. BMTC on the other hand has no separate funding from the government making it difficult for the institution to take such risks [25].
Despite its bitter experience with CNG buses, due to its desire to make the public transport more sustainable, BMTC in 2014 launched India's first electric bus for a trial run in Bengaluru. The electric bus was procured from a Chinese company-Build Your Dreams (BYD).
The BYD's zero emission all electric bus can drive more than 250 km even in heavy city traffic on a single charge of 6 hours. Four Fe (Ferrous) batteries are provided with a capacity of 324 kWh (500 V, 600 Ah). Energy consumption amounts to 1.2 kWh/km. The operating cost is about INR 7/km [27]. Figure 5 shows the variation of the operating costs of conventional, hybrid and electric city bus. The maintenance cost of the electric city bus is less compared to diesel or hybrid-diesel buses. A zero emission electric city bus usually travels for about 250 km on single charge. In comparison Table 2 shows gram per day emission of the pollutants from a conventional CNG and diesel for 250 km per day [26,28].
Pollution Parameter Fuel | CO in g/250 km/day | NOx in g/250 km/day | PM in g/250 km/day |
Diesel | 2.4 × 250 = 600 g/day | 21 × 250 = 5250 g/day | 0.38 × 250 = 95 g/day |
CNG | 0.4 × 250 = 100 g/day | 8.9 × 250 = 2225 g/day | 0.012 × 250 = 3 g/day |
Impact of electric vehicles and buses is a hot topic and different projects investigate different aspects such as the impact of charging load on the energy network [4], the impact on the environment considering the reduction on the greenhouse gas emissions [29] and the performance of different powertrains [30]. Similar to aforementioned projects in European Union (EU), some research projects focus on potential benefits that can be reaped from the implementation of electric buses in different countries such as China [29], Argentina [30], Bolivia and Paraguay [31] and Malaysia [32]. Following from this trend, in this section, a similar impact assessment is done for city of Bengaluru, India. Giving a thorough review of similar research efforts is out of scope of this work. However, interested readers can consult cited references for further details.
The migration of the existing conventional buses in the BMTC fleet to electric buses can have significant impact on the electrical grid and pollution levels. The scenarios with 10%, 20%, 30% and 50% migration of existing BMTC operated buses to electric buses has been studied to understand the load on the grid due to the conventional charging of the buses. Figure 6 shows the corresponding electrical load increase for the cases studied. The major contribution is in exhaust fume reduction. As shown in Figure 7 to 9, NO, CO and particulate matter emissions are reduced considerably even with a 10% migration level. With the increasing migration to electric buses, reduction in CO, NOx and PM up to 64.63% is observed at 50% migration level. Table 3 lists the reduction levels with respect to the percentage of migration to electric buses.
Percentage reduction of pollution levels | |||||
Percentage migration to electric buses | 10% | 20% | 30% | 50% | |
Reduction of pollution/emissions | 12.93 % | 25.86 % | 38.77 % | 64.63% |
India needs development of infrastructure to support and promote electric buses as a component of its public transport fleet. The increasing migration to electric buses would cause significant loads on the power grids. Development of microgrids fuelled with renewable sources of energy would be sustainable. It needs to adapt and take lessons from other countries who that successfully demonstrated the integration of electric city buses in their existing bus fleet. Achieving an effective operational range for electric buses has been a central issue in a number of studies. Studies have done to show that hybrid electric buses would be the most suitable of available technologies, but the best alternative would be a pure electric bus if it could provide an acceptable range [26]. Wireless power transfer technology has been deployed at various locations to enhance the operational range.
In Turin, a fleet of 23 electric buses received boost charge batteries when they stopped at stations [33]. In Mannheim, Germany, two electric buses were tested for 12 months using PRIMOVE wireless powerless transfer technology [34]. Bombardier's PRIMOVE wireless charging technology was also deployed at Braunschweig. 120 kW charging module was installed at the bus stations of Netherlands to power a 86-passenger size Volvo bus (Figure 10) [35]. Asea Brown Bovery (ABB) Ltd. is testing an electric bus serving the city-to-airport shuttle in Geneva using the new flash charging concept named Trolleybus Optimization System Alimentation (TOSA) with a 15 sec charge bursts of 400 kW at selective bus stops [35]. Special solar powered bus stops were developed and deployed in the Dutch city of Noord-Brabant (Figure 11) [35,36].
A five year study to evaluate commercial feasibility is being conducted for electric buses in Milton Keynes, London. It operates for about 17 hours a day. It receives a 10 min energy boost from inductive charge pads at either end of the route (Figure 12 and 13) [35,38]. In central London, BYD electric buses were introduced on two short routes for peak hour management. They operate in the morning peak alongside the core diesel fleet and then go back to stations at night for a overnight charge [39].
Countries around the world are now quickly moving to the opportunity charging systems to enhance the overall transportation systems. The Volvo Group and Swedish transport administration have planned to use inductive charging for its hyper bus fleet [37].
The dynamic and static charging using shaped magnetic field in resonance-SMFIR technology has been incorporated in South Korea. Dynamic inductive charging developed by KIAST powers the Online Electric Vehicles (OLEV) wirelessly on specially designed roads. The buses acquire the charge while it is moving. This is unlike the other static wireless power transfer technologies used in the world (Figure 14). The technology is currently tested in the city of Gumi and other areas of United States [35,40].
India needs to catch up with the EV market. In an attempt to understand the feasibility of electric buses and wireless power transfer technology, Bengaluru's Airport bus service routes shown in Figure 15, have been analyzed for two charging scenarios: one where the electric buses are charged for 5 hours using the conventional charging facilities and the other where opportunity charging facilities at the point of origin and destination are deployed with the conventional charging at the beginning of the journey. A 200 kW charger is used to charge the bus for 15 min at the point of origin and destination at the end of every trip acquiring a charge of 50 kWh at both the ends. Based on the distance covered in every trip and time of travel, the total number of successful full length trips made by a typical BYD electric bus is calculated and shown in the Table 4. In case of scenario 1 the battery exhausts after travelling to about 250 km. The charging boosts given at the end points improve the number of trips significantly.
Route | Distance km | Travel Time | Trips in Scenario 1 | Trips in Scenario 2 |
KIAS 4 | 46 | 1:55 | 5 | 8 |
KIAS 5 | 49.7 | 2:00 | 5 | 8 |
KIAS 6 | 64.76 | 2:10 | 3 | 8 |
KIAS 7 | 50 | 1:55 | 5 | 8 |
KIAS 7A | 50 | 2:00 | 5 | 8 |
KIAS 8 | 66 | 2:45 | 3 | 6 |
KIAS 8C | 73.5 | 3:00 | 3 | 5 |
KIAS 9 | 34.5 | 1:15 | 7 | 12 |
KIAS 10 | 52.2 | 2:10 | 4 | 8 |
KIAS 12 | 50 | 2:00 | 5 | 8 |
The wireless charging option for the bus services in the Bengaluru airport services is a good option. The number of trips increases with the wireless opportunity charging systems at the end points. If the route planning is done with implementation of the opportunity charging techniques, the transportation system may be more efficient. The charge acquired at the end points is almost equal to (KIAS 4, 5, 7, 7A, 9, 10, 12) the power used during the trip. These buses can operate for more than 19 hours as the charging time at the initial conventional charging stations can be reduced (possible to charge for less than 5 hours). However, the inductive charging at the intermediate bus stops on the way can also improve the performance. They may necessarily not be required at the beginning, as the initial cost may shoot up. With an 80 kW charging for 30 sec on every bus stop, the charge acquired by the bus on every trip provides charge for additional kilometers, as shown in Table 5.
Route No | Distance km | No. of stops | Additional km |
KIAS 4 | 46 | 24 | 15 |
KIAS 5 | 49.7 | 46 | 30 |
KIAS 6 | 64.76 | 20 | 12 |
KIAS 7 | 50 | 26 | 16 |
KIAS 7A | 50 | 24 | 15 |
KIAS 8 | 66 | 46 | 29 |
KIAS 8C | 73.5 | 48 | 31 |
KIAS 9 | 34.5 | 11 | 6 |
KIAS 10 | 52.2 | 30 | 19 |
KIAS 12 | 50 | 33 | 21 |
For the routes with comparatively short distances end to end charging point facilities may be sufficient. For routes-KIAS 8, 8C, 6 the performance can be maximized by building infrastructure for WPT at few intermediate bus stops to increase efficiency. Wireless power technology is a must for using the electric bus services in Bengaluru city for long distance routes. The concept of opportunity charging will increase the efficiency and performance of the bus-economy, maintenance, reduced battery size; and the bus may operate continuously for more than 19–21 hours for the assumed cases.
The growing power requirement at the airport can be met by integration of renewable power into the grid. Bangalore has a solar radiation constant of 5.26 kWh/m2/day, with a fair annual distribution as shown in Figure 16. A typical 1 MW capacity solar power plant with a thin film solar module installed in an area of five acre can generate more than 1.7 million units of power every year. This could meet about 58.21% of the power required for dynamic charging of the electric buses at the airport every year, as per Scenario 2 described above. In this fashion, clean electric buses can replace traditional buses and the impact on the electricity grid can be substantially reduced with renewable energy systems such as solar curve bus stop.
Indian cities are very congested and pollution problems further worsens the situation. The air quality of most cities is at alarming level. Electric buses are the key components of a pro-public transport driven policies which could enhance the quality of life in urban India. An increasing modal share in public transport could possibly solve the traffic congestion problems in major cities. Our research shows that migration to electric buses might be a solution to cut down emissions significantly in Bengaluru. In difference to diesel buses, the plug-in hybrid and electric buses require a dedicated charging equipment and infrastructure for their operation.
The development of smart cities in India is an opportunity for development of stronger infrastructure for electric vehicles. The shift towards usage of zero emission vehicle trends in India will provide a great means to tackle and deal with the global climate change challenges. The concept of electric buses equipped with dynamic charging technologies can make it feasible in the Indian perspective. Bengaluru was the first city in India to conduct trial runs of electric buses. However, the high procurement costs, lack of institutional funds from government led to the cancellation of further equipping BMTC with more number of electric buses even though the trials received a positive response from common public. Our research shows that equipping the electric buses with dynamic charging technologies can make it a more sustainable and economical solution to tackle the growing concerns of traffic and pollution in the city of Bengaluru. Other cities of India like New Delhi, Mumbai, Kolkata, Chennai can also adopt similar model of transportation. However, the increase in electric bus migration will lead to higher power demands. Integration of renewable sources of energy like solar, wind and biogas into the microgrids designed and developed specifically for charging the buses at the Bus stations and inductive charging platforms could reduce the dependency on the existing grids and also reduce the overall operating costs.
The development of infrastructure for electric bus can create a lot business opportunities in the country. The government of India has already started to encourage private players in the renewable power sector. With the increase in the limit for Foreign Direct Investment (FDI) and formulation of policies that would promote manufacturing industries, the day is not far when India would design and build electric buses within the country reducing the procurement cost of these electric buses. This would make the large scale implementation of the project more practical. It would be beneficial to launch more pilot projects to study the feasibility of electric buses in India and lay down a proper roadmap for a sustainable transportation.
All authors declare no conflicts of interest in this paper.
[1] | International Energy Agency (2012) Understanding energy challenges in India. Policies, Players and Issues. IEEE Ind Appl Mag 17: 116. |
[2] | Somalwar PRS, Apte MSM, Ikhe MYR (2014) A power sector of India by electric grid. IJRITCC 2: 774–777. |
[3] | ICCT Fuels, International Council on Clean Transportation. Available from: http://www.theicct.org/. |
[4] | M Release (2014) New transport scenarios for China, India, Latin America highlight role of cities in combatting climate change International Transport Forum at OECD releases projections for modal shares , emissions at Lima COP20 conference. |
[5] |
Ustun TS, Zayegh A, Ozansoy C (2013) Electric vehicle potential in Australia: its impact on smart grids. IEEE Ind Electron M 7: 15–25. doi: 10.1109/MIE.2013.2273947
![]() |
[6] | Media Briefing Note, Centre for Science and Environment, Bengaluru, 2013. Available from: http://www.cseindia.org/userfiles/mbriefing_note.pdf. |
[7] | EBSF: Designing the future of the bus, Press Kit, International Association of Public Transport. Available from: http://bit.ly/2z63wn4. |
[8] | ZeEUS, Ebus Fact Sheet. Available from: http://bit.ly/2A20nVp. |
[9] | ELIPTIC, Factor 100. Available from: http://bit.ly/2zHfsuU. |
[10] |
Wu Y, Zhang L (2017) Can the development of electric vehicles reduce the emission of air pollutants and greenhouse gases in developing countries? Transport Res D-Tre 51: 129–145. doi: 10.1016/j.trd.2016.12.007
![]() |
[11] |
Alessandrini A, Cignini F, Ortenzi F, et al. (2017) Advantages of retrofitting old electric buses and minibuses. Energ Procedia 126: 995–1002. doi: 10.1016/j.egypro.2017.08.260
![]() |
[12] | Fok T, Prabhu A, Bachu P (2014) The high cost of low emissions standards for bus-based public transport operators in india: evidence from bangalore. Hepatology 16: 1322–1326. |
[13] | Kenworthy J (2003) A study of 84 global cities, in transport energy use and greenhouse gases in Urban passenger transport systems. Available from: http://bit.ly/1kXoGZ4. |
[14] | Asian Development Bank (2008) Managing Asian cities. ADB Publishing. |
[15] | Krishna S (2013) A city in need of its citizens. The Hindu. Available from: http://bit.ly/1NTKtrn. |
[16] | Centre for Science and Environment, Media briefing note. 2013. Available from: http://bit.ly/1TcOBqd. |
[17] | Land Transport Authority Singapore (2011) Journeys: Sharing urban transport solutions. |
[18] | Harish M (2012) A study on air pollution by automobiles in Bangalore city. Manage Res Pract 4: 25–36. |
[19] | Midgley P (2009) Sharing urban transport solutions. Journeys-Sharing Urban Transport Solutions, 23–31. |
[20] |
Lajunen A (2014) Energy consumption and cost-benefit analysis of hybrid and electric city buses transp. Transport Res C-Emer 38: 1–15. doi: 10.1016/j.trc.2013.10.008
![]() |
[21] |
Banjac T, Trenc F, Katrašnik T (2009) Energy conversion efficiency of hybrid electric heavy-duty vehicles operating according to diverse drive cycles. Energ Convers Manage 50: 2865–2878. doi: 10.1016/j.enconman.2009.06.034
![]() |
[22] | Ahluwalia R, Wang X, Kumar R (2012) Fuel Cell Transit Buses. Annual Report-IEA Advanced Fuel Cells. Available from: http://bit.ly/2zK1k0O. |
[23] | Clark NN, Zhen F, Wayne WS, et al. (2007). Transit Bus Life Cycle Cost and Year 2007 Emissions Estimation. US DOT Federal Transit Administration. Carbon Dioxide, 2007. |
[24] | Williamson R (2012) Transport for NSW Hybrid Bus Trial. Rare Consulting, Final Report. |
[25] | BMTC in the red; city buses cannot go green, Bangalore Mirror. Available from: http://bit.ly/2An6z9Q. |
[26] | Marvaniya RP, Gundaliya PJ (2014) Vehicular emission in Indian environment. IJFTET 4: 38–42. |
[27] | BMTC Press Release. Available from: http://bit.ly/1Xmze55. |
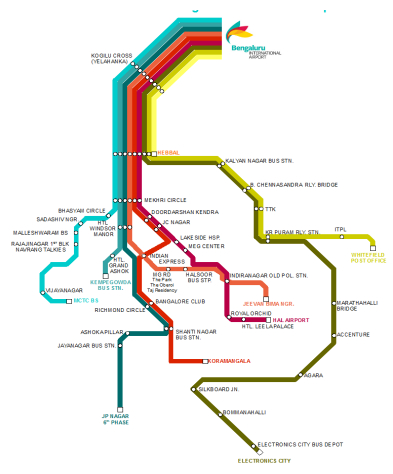
[28] | BMTC Bengaluru International Airport city bus shuttle route map. Available from: http://bit.ly/2A2Ujw3. |
[29] | He X, Zhang S, Ke W, et al. (2017) Energy consumption and well-to-wheels air pollutant emissions of battery electric buses under complex operating conditions and implications on fleet electrification. J Clean Prod 171: 714–722. |
[30] |
Correa G, Muñoz P, Falaguerra T, et al. (2017) Performance comparison of conventional, hybrid, hydrogen and electric urban buses using well to wheel analysis. Energy 141: 537–549. doi: 10.1016/j.energy.2017.09.066
![]() |
[31] |
Sauer IL, Escobar JF, Silva MFPD, et al. (2015) Bolivia and paraguay: a beacon for sustainable electric mobility? Renew Sust Energ Rev 51: 910–925. doi: 10.1016/j.rser.2015.06.038
![]() |
[32] | Teoh LE, Khoo HL, Goh SY, et al. (2017) Scenario-based electric bus operation: a case study of Putrajaya, Malaysia. International Journal of Transportation Science and Technology. Available from: http://www.sciencedirect.com/science/article/pii/S2046043017300540. |
[33] | Wireless charging-the future for electric cars. Available from: http://www.bbc.com/news/technology-14183409. |
[34] | Bombardier PRIMOVE Equipped E-buses start passenger service in Mannheim, Germany. Available from: http://bit.ly/1Xli3kd. |
[35] | Review and Evaluation of wireless power transfer for Electric transit application (2014) FTA Research. Available from: http://1.usa.gov/1NTJSpA. |
[36] | Wireless solar charging for electric buses. Available from: http://zd.net/1jnRQyO. |
[37] | Volvo building an electric roadway to wirelessly charge buses. Available from: http://engt.co/2BGRuhq. |
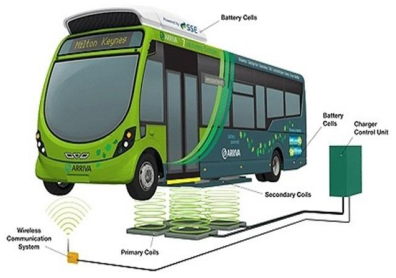
[38] | ARUP, World's most demanding electric bus route launched in Milton Keynes. Available from: http://bit.ly/2AJ63n0. |
[39] |
Miles J, Potter S (2014) Developing a viable electric bus service: the Milton Keynes demonstration project. Res Transp Econ 48: 357–363. doi: 10.1016/j.retrec.2014.09.063
![]() |
[40] | Global Opportunities for SMEs in Electro-Mobility. Available from: http://bit.ly/2km56ut. |
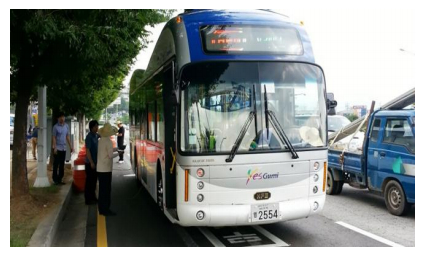
[41] | South Korean road wirelessly recharges OLEV buses, BBC News. Available from: http://bbc.in/1NzJwKs. |
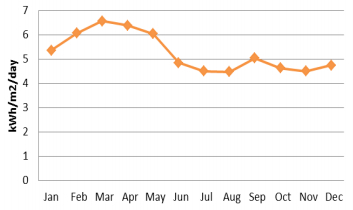
[42] | Solar Irradiation in Bengaluru, Karnataka, India. Available from: http://bit.ly/2iI5we5. |
1. | Domenico Nardo, Alfio Scuto, Giuseppe Sorrentino, Angelo Raciti, Santi Agatino Rizzo, 2019, The key role of the SJ MOSFET with fast diode in high-end SMPS converters for telecom applications, 978-8-8872-3745-0, 1, 10.23919/AEIT.2019.8893311 | |
2. | Ishant Sharma, Munish K. Chandel, Will electric vehicles (EVs) be less polluting than conventional automobiles under Indian city conditions?, 2020, 8, 2213624X, 1489, 10.1016/j.cstp.2020.10.014 | |
3. | G. Mauromicale, A. Raciti, S.A. Rizzo, G. Susinni, G. Parise, L. Parise, 2019, E-mobility: Safety, Service Continuity and Penetration of Charging Systems, 978-8-8872-3743-6, 1, 10.23919/EETA.2019.8804496 | |
4. | Shaik Mullapathi Farooq, S. M. Suhail Hussain, Siddavaram Kiran, Taha Selim Ustun, Certificate Based Security Mechanisms in Vehicular Ad-Hoc Networks based on IEC 61850 and IEEE WAVE Standards, 2019, 8, 2079-9292, 96, 10.3390/electronics8010096 | |
5. | Kothalanka Kameswara Pavan Kumar, Nirmala Soren, Abdul Latif, Dulal Chandra Das, S. M. Suhail Hussain, Ahmed Al-Durra, Taha Selim Ustun, Day-Ahead DSM-Integrated Hybrid-Power-Management-Incorporated CEED of Solar Thermal/Wind/Wave/BESS System Using HFPSO, 2022, 14, 2071-1050, 1169, 10.3390/su14031169 | |
6. | Khaled A. Mahafzah, Mohammad A. Obeidat, Ali Q. Al-Shetwi, Taha Selim Ustun, A Novel Synchronized Multiple Output DC-DC Converter Based on Hybrid Flyback-Cuk Topologies, 2022, 8, 2313-0105, 93, 10.3390/batteries8080093 | |
7. | Bishal Dey, Bidesh Roy, Subir Datta, Taha Selim Ustun, Forecasting ethanol demand in India to meet future blending targets: A comparison of ARIMA and various regression models, 2023, 9, 23524847, 411, 10.1016/j.egyr.2022.11.038 | |
8. | K. M. Muttaqi, M. T. Hagh, Thomas Creek, M. G. M. Abdolrasol, M S Hossain Lipu, M. A. Hannan, 2022, Hybrid Operation of Super-Capacitor and Battery Storage to Improve Electric Vehicles Performances, 978-1-6654-7815-1, 1, 10.1109/IAS54023.2022.9940084 | |
9. | Taha Selim Ustun, S. M. Suhail Hussain, Hiroshi Kikusato, IEC 61850-Based Communication Modeling of EV Charge-Discharge Management for Maximum PV Generation, 2019, 7, 2169-3536, 4219, 10.1109/ACCESS.2018.2888880 | |
10. | Vinay Simha Reddy Tappeta, Bhargav Appasani, Suprava Patnaik, Taha Selim Ustun, A Review on Emerging Communication and Computational Technologies for Increased Use of Plug-In Electric Vehicles, 2022, 15, 1996-1073, 6580, 10.3390/en15186580 | |
11. | Vita Lystianingrum, Andi Irawan, Ilham Bagus Santoso, I Made Yulistya Negara, Ardyono Priyadi, 2021, On Feasibility of Ultracapacitor Full Electric Transit Bus for Jakarta, Indonesia, 978-1-6654-1641-2, 102, 10.1109/ICT-PEP53949.2021.9600983 |
City | Population (million) | Land Area (km2) | Private Transport | Public Transport | Para Transit | Cycle | Walk |
Mumbai | 12.5 | 603 | 15 | 45 | 7 | 6 | 27 |
Delhi | 11 | 431 | 19 | 42 | 6 | 12 | 21 |
Bengaluru | 8.4 | 226 | 25 | 35 | 7 | 7 | 26 |
Ahmedabad | 5.6 | 281 | 42 | 16 | 6 | 14 | 22 |
Pollution Parameter Fuel | CO in g/250 km/day | NOx in g/250 km/day | PM in g/250 km/day |
Diesel | 2.4 × 250 = 600 g/day | 21 × 250 = 5250 g/day | 0.38 × 250 = 95 g/day |
CNG | 0.4 × 250 = 100 g/day | 8.9 × 250 = 2225 g/day | 0.012 × 250 = 3 g/day |
Percentage reduction of pollution levels | |||||
Percentage migration to electric buses | 10% | 20% | 30% | 50% | |
Reduction of pollution/emissions | 12.93 % | 25.86 % | 38.77 % | 64.63% |
Route | Distance km | Travel Time | Trips in Scenario 1 | Trips in Scenario 2 |
KIAS 4 | 46 | 1:55 | 5 | 8 |
KIAS 5 | 49.7 | 2:00 | 5 | 8 |
KIAS 6 | 64.76 | 2:10 | 3 | 8 |
KIAS 7 | 50 | 1:55 | 5 | 8 |
KIAS 7A | 50 | 2:00 | 5 | 8 |
KIAS 8 | 66 | 2:45 | 3 | 6 |
KIAS 8C | 73.5 | 3:00 | 3 | 5 |
KIAS 9 | 34.5 | 1:15 | 7 | 12 |
KIAS 10 | 52.2 | 2:10 | 4 | 8 |
KIAS 12 | 50 | 2:00 | 5 | 8 |
Route No | Distance km | No. of stops | Additional km |
KIAS 4 | 46 | 24 | 15 |
KIAS 5 | 49.7 | 46 | 30 |
KIAS 6 | 64.76 | 20 | 12 |
KIAS 7 | 50 | 26 | 16 |
KIAS 7A | 50 | 24 | 15 |
KIAS 8 | 66 | 46 | 29 |
KIAS 8C | 73.5 | 48 | 31 |
KIAS 9 | 34.5 | 11 | 6 |
KIAS 10 | 52.2 | 30 | 19 |
KIAS 12 | 50 | 33 | 21 |