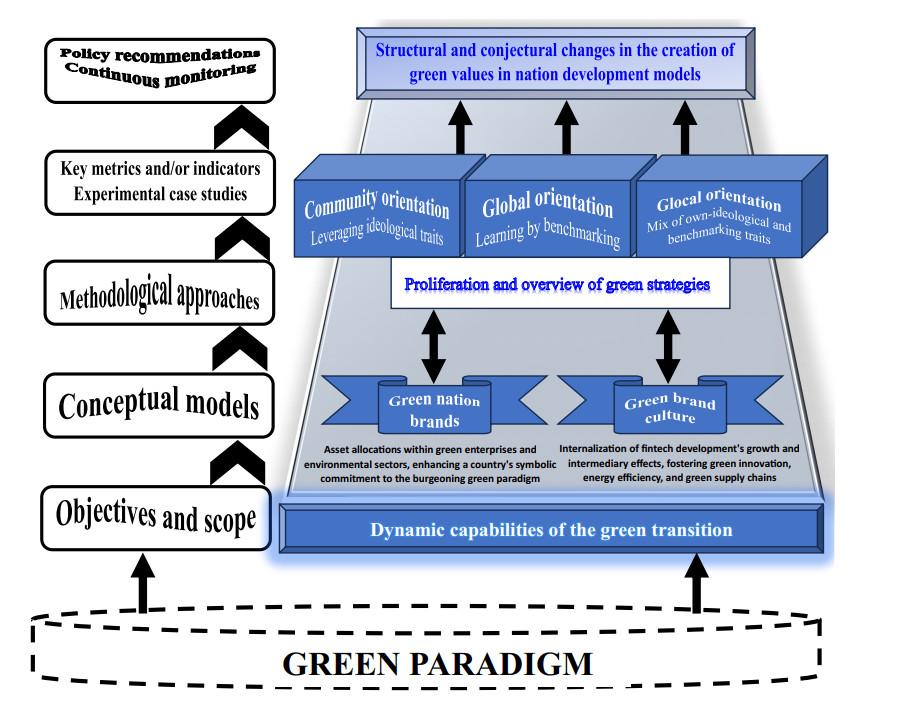
This study reviews the literature focused on nation brands and brand culture through the innovative combination of latent Dirichlet allocation with a multinomial and unordered discrete choice analysis. Unlike a narrow perspective of bibliometric work, which confines itself to reviewing existing literature within a specific research domain, a broader viewpoint leverages bibliometric analysis to pinpoint potential research opportunities indicative of emerging trends in related fields. Adopting this comprehensive paradigm, the current study scrutinizes 60 articles spanning the timeframe from 1992 to 2021. The analysis discerns six prospective marketing strategies instrumental in propelling a country to global brand prominence: the synergistic integration of country-of-origin and city brands, consumption branding, materialistic branding, green branding, ideological branding, and scientific branding. Notably, environmental branding has assumed a pivotal global role post–2015, while ideological branding represents a more recent trend centered on diligent efforts to invigorate national identity systems. Empirical insights underscore the need of a multidisciplinary approach in the creation of nation brands, suggesting that distinct strategies need not be mutually exclusive. Quantitatively, it is found evidence that covering one additional environmental topic in a study increases (decreases) its likelihood of belonging to the consumption (ideology) cluster by 50.8 (50.6) percentage points, respectively. Strategic recommendations for future national endeavors emphasize the significance of becoming a Stackelberg leader in the race to generate added value. Collectively, these findings underscore that the bibliometric analysis employed to elucidate the evolution of nation brands and brand culture, typically associated with international marketing, unveils two promising niche areas for future research in green finance: green nation brands and green brand culture. The former pertains to asset allocations within green enterprises and environmental sectors, enhancing a country's symbolic commitment to the burgeoning green paradigm. Meanwhile, the later delves into the internalization of fintech development's growth and intermediary effects, fostering green innovation, energy efficiency, and green supply chains. This bottom-up approach is geared towards meeting community-based needs and presents valuable avenues for future exploration in the field of green finance.
Citation: Vitor Miguel Ribeiro. Pioneering paradigms: unraveling niche opportunities in green finance through bibliometric analysis of nation brands and brand culture[J]. Green Finance, 2024, 6(2): 287-347. doi: 10.3934/GF.2024012
This study reviews the literature focused on nation brands and brand culture through the innovative combination of latent Dirichlet allocation with a multinomial and unordered discrete choice analysis. Unlike a narrow perspective of bibliometric work, which confines itself to reviewing existing literature within a specific research domain, a broader viewpoint leverages bibliometric analysis to pinpoint potential research opportunities indicative of emerging trends in related fields. Adopting this comprehensive paradigm, the current study scrutinizes 60 articles spanning the timeframe from 1992 to 2021. The analysis discerns six prospective marketing strategies instrumental in propelling a country to global brand prominence: the synergistic integration of country-of-origin and city brands, consumption branding, materialistic branding, green branding, ideological branding, and scientific branding. Notably, environmental branding has assumed a pivotal global role post–2015, while ideological branding represents a more recent trend centered on diligent efforts to invigorate national identity systems. Empirical insights underscore the need of a multidisciplinary approach in the creation of nation brands, suggesting that distinct strategies need not be mutually exclusive. Quantitatively, it is found evidence that covering one additional environmental topic in a study increases (decreases) its likelihood of belonging to the consumption (ideology) cluster by 50.8 (50.6) percentage points, respectively. Strategic recommendations for future national endeavors emphasize the significance of becoming a Stackelberg leader in the race to generate added value. Collectively, these findings underscore that the bibliometric analysis employed to elucidate the evolution of nation brands and brand culture, typically associated with international marketing, unveils two promising niche areas for future research in green finance: green nation brands and green brand culture. The former pertains to asset allocations within green enterprises and environmental sectors, enhancing a country's symbolic commitment to the burgeoning green paradigm. Meanwhile, the later delves into the internalization of fintech development's growth and intermediary effects, fostering green innovation, energy efficiency, and green supply chains. This bottom-up approach is geared towards meeting community-based needs and presents valuable avenues for future exploration in the field of green finance.

| [1] |
Aaker DA (1996) Measuring brand equity across products and markets. Calif Manag Rev 38: 102–120. http://dx.doi.org/10.2307/41165845 doi: 10.2307/41165845

|
| [2] |
Abramo G, D'Angelo CA (2011) Evaluating research: from informed peer review to bibliometrics. Scientometrics 87: 499–514. https://doi.org/10.1007/s11192-011-0352-7 doi: 10.1007/s11192-011-0352-7
|
| [3] |
Adriaanse LS, Rensleigh C (2013) Web of Science, Scopus and Google Scholar: A content comprehensiveness comparison. The Electronic Library 31: 727–744. https://doi.org/10.1108/EL-12-2011-0174 doi: 10.1108/EL-12-2011-0174
|
| [4] |
Aguilar-Moreno JA, Palos-Sanchez PR, Pozo-Barajas R (2024). Sentiment analysis to support business decision-making. A bibliometric study. AIMS Mathematics 9: 4337–4375. https://doi.org/10.3934/math.2024215 doi: 10.3934/math.2024215
|
| [5] | Aldridge S, Halpern D, Fitzpatrick S (2002) Social capital: A discussion paper. Cabinet Office, London. https://ntouk.files.wordpress.com/2020/07/socialcapital.pdf |
| [6] |
Alserhan BA, Halkias D, Boulanouar AW, et al. (2015) Expressing herself through brands: the arab woman's perspective. J Res Mark Entrep 17: 36–53. https://doi.org/10.1108/JRME-09-2014-0024 doi: 10.1108/JRME-09-2014-0024
|
| [7] | Anderson B (1983) Imagined communities: Reflections on the origin and spread of nationalism Verso books. Available from: https://www.taylorfrancis.com/chapters/edit/10.4324/9781003060963-46/imagined-communities-benedict-anderson. |
| [8] | Anholt S (2002) Nation branding: A continuing theme. J Brand Manag 10: 59–59. Available from: https://www.elibrary.ru/item.asp?id = 6247609. |
| [9] |
Anholt S (2005) Anholt nation brands index: how does the world see America? J Advertising Res 45: 296–304. https://doi.org/10.1017/S0021849905050336 doi: 10.1017/S0021849905050336
|
| [10] |
Appio FP, Martini A, Massa S, et al. (2016) Unveiling the intellectual origins of social media-based innovation: insights from a bibliometric approach. Scientometrics 108: 355–388. https://doi.org/10.1007/s11192-016-1955-9 doi: 10.1007/s11192-016-1955-9
|
| [11] |
Appio FP, Cesaroni F, Minin AD (2014) Visualizing the structure and bridges of the intellectual property management and strategy literature: A document co-citation analysis. Scientometrics 101: 623–661. https://doi.org/10.1007/s11192-014-1329-0 doi: 10.1007/s11192-014-1329-0
|
| [12] |
Aria M, Cuccurullo C (2017) bibliometrix: An R-tool for comprehensive science mapping analysis. J Informetr 11: 959-975. https://doi.org/10.1016/j.joi.2017.08.007 doi: 10.1016/j.joi.2017.08.007
|
| [13] |
Aria M, Misuraca M, Spano M (2020) Mapping the evolution of social research and data science on 30 years of Social Indicators Research. Soc Indic Res 149: 803–831. https://doi.org/10.1007/s11205-020-02281-3 doi: 10.1007/s11205-020-02281-3
|
| [14] |
Aria M, Cuccurullo C, D'Aniello L, et al. (2022) Thematic Analysis as a New Culturomic Tool: The Social Media Coverage on COVID-19 Pandemic in Italy. Sustainability 14: 3643. https://doi.org/10.3390/su14063643 doi: 10.3390/su14063643
|
| [15] | Aronczyk M (2008) Living the brand: Nationality, globality, and the identity strategies of nation branding consultants. Int J Commun 2: 25. https://ijoc.org/index.php/ijoc/article/view/218 |
| [16] |
Bartikowski B, Fastoso F, Gierl H (2021) How nationalistic appeals affect foreign luxury brand reputation: A study of ambivalent effects. J Bus Ethics 169: 261–277. https://doi.org/10.1007/s10551-020-04483-8 doi: 10.1007/s10551-020-04483-8
|
| [17] |
Batra R (2019) Creating brand meaning: a review and research agenda. J Consum Psychol 29: 535–546. https://doi.org/10.1002/jcpy.1122 doi: 10.1002/jcpy.1122
|
| [18] | Belk RW (1984) Three scales to measure constructs related to materialism: Reliability, validity, and relationships to measures of happiness. ACR North Am Adv 1: 1-14. Available from: https://www.jrconsumers.com/academic_articles/issue_1/Belk_.pdf. |
| [19] |
Bellostas A, Del Río C, González-Álvarez K (2023) Cultural context, organizational performance and Sustainable Development Goals: A pending task. Green Financ 5: 211–239. https://doi.org/10.3934/GF.2023009 doi: 10.3934/GF.2023009
|
| [20] |
Benneworth P, Charles D (2005) University spin-off policies and economic development in less successful regions: Learning from two decades of policy practice. Eur Plan Stud 13: 537–557. https://doi.org/10.1080/09654310500107175 doi: 10.1080/09654310500107175
|
| [21] |
Bennink H (2023) Prospects of green financing in democratic societies. Green Financ 5: 154–194. https://doi.org/10.3934/GF.2023007 doi: 10.3934/GF.2023007
|
| [22] |
Bilkey WJ, Nes E (1982) Country-of-origin effects on product evaluations. J Int Bus Stud 13: 89–100. https://doi.org/10.1057/palgrave.jibs.8490539 doi: 10.1057/palgrave.jibs.8490539
|
| [23] | Blei DM, Ng AY, Jordan MI (2003) Latent dirichlet allocation. J Mach Learn Res 3: 993–1022. Available from: https://www.jmlr.org/papers/volume3/blei03a/blei03a.pdf?ref = https://githubhelp.com. |
| [24] | Boell SK, Cecez-Kecmanovic D (2015) On being 'systematic' in literature reviews. Formulating Research Methods for Information Systems, 48–78. Available from: https://link.springer.com/chapter/10.1057/9781137509888_3. |
| [25] |
Bulmer S, Buchanan-Oliver M (2010) Experiences of brands and national identity. Australas Mark J 18: 199–205. https://doi.org/10.1016/j.ausmj.2010.07.002 doi: 10.1016/j.ausmj.2010.07.002
|
| [26] | Caffrey J, Isaacs HH (1971) Estimating the impact of a college or university on the local economy. EXXON Education Foundation, New York. Available from: https://eric.ed.gov/?id = ED252100. |
| [27] |
Carlsen L (2023) The state of the 'Prosperity' pillar by 2022: A partial ordering-based analysis of the sustainable development goals 7–11. Green Financ 5: 89–101. https://doi.org/10.3934/GF.2023005 doi: 10.3934/GF.2023005
|
| [28] |
Chabowski BR, Samiee S, Hult GTM (2013) A bibliometric analysis of the global branding literature and a research agenda. J Int Bus Stud 44: 622-634. https://doi.org/10.1057/jibs.2013.20 doi: 10.1057/jibs.2013.20
|
| [29] |
Chappin EJL, Ligtvoet A (2014) Transition and transformation: A bibliometric analysis of two scientific networks researching socio-technical change. Renew Sust Energ Rev 30: 715–723. https://doi.org/10.1016/j.rser.2013.11.013 doi: 10.1016/j.rser.2013.11.013
|
| [30] |
Clayton R, Pontusson J (1998) Welfare-state retrenchment revisited: entitlement cuts, public sector restructuring, and inegalitarian trends in advanced capitalist societies. World Polit 51: 67–98. https://doi.org/10.1017/S0043887100007796 doi: 10.1017/S0043887100007796
|
| [31] |
Clifton N (2014) Towards a holistic understanding of county of origin effects? branding of the region, branding from the region. J Destin Mark Manage 3: 122–132. https://doi.org/10.1016/j.jdmm.2014.02.003 doi: 10.1016/j.jdmm.2014.02.003
|
| [32] |
Cohen J (1992) Statistical power analysis. Curr Dir Psychol Sci 1: 98–101. https://doi.org/10.1111/1467-8721.ep10768783 doi: 10.1111/1467-8721.ep10768783
|
| [33] | Connor W (1978) A nation is a nation, is a state, is an ethnic group is a... Ethnic Racial Stud 1: 377–400. https://doi.org/10.1080/01419870.1978.9993240 |
| [34] |
Cobo MJ, Lopez-Herrera AG, Herrera-Viedma E, et al. (2011) An approach for detecting, quantifying, and visualizing the evolution of a research field: A practical application to the fuzzy sets theory field. J Informetr 5: 146-166. https://doi.org/10.1016/j.joi.2010.10.002 doi: 10.1016/j.joi.2010.10.002
|
| [35] |
D'Angelo CA, Giuffrida C, Abramo G (2011) A heuristic approach to author name disambiguation in bibliometrics databases for large-scale research assessments. J Am Soc Inf Sci Tec 62: 257–269. https://doi.org/10.1002/asi.21460 doi: 10.1002/asi.21460
|
| [36] |
De Nooy W (2011) Networks of action and events over time: a multilevel discrete-time event history model for longitudinal network data. Soc Networks 33: 31–40. https://doi.org/10.1016/j.socnet.2010.09.003 doi: 10.1016/j.socnet.2010.09.003
|
| [37] |
Demangeot C, Broderick AJ, Craig CS (2015) Multicultural marketplaces: New territory for international marketing and consumer research. Int Market Rev 32: 118—140. https://doi.org/10.1108/IMR-01-2015-0017 doi: 10.1108/IMR-01-2015-0017
|
| [38] |
Demir G, Chatterjee P, Pamucar D (2024) Sensitivity analysis in multi-criteria decision making: A state-of-the-art research perspective using bibliometric analysis. Expert Syst Appl 237: 121660. https://doi.org/10.1016/j.eswa.2023.121660 doi: 10.1016/j.eswa.2023.121660
|
| [39] |
Demir G, Chatterjee P, Zakeri S, et al. (2024) Mapping the Evolution of Multi-Attributive Border Approximation Area Comparison Method: A Bibliometric Analysis. Decis Making Appl Manag Eng 7: 290-314. https://doi.org/10.31181/dmame7120241037 doi: 10.31181/dmame7120241037
|
| [40] |
Desalegn G (2023) Insuring a greener future: How green insurance drives investment in sustainable projects in developing countries? Green Financ 5: 195–210. https://doi.org/10.3934/GF.2023008 doi: 10.3934/GF.2023008
|
| [41] |
Dinnie K (2004a) Place branding: Overview of an emerging literature. Place Branding 1: 106–110. https://doi.org/10.1057/palgrave.pb.5990010 doi: 10.1057/palgrave.pb.5990010
|
| [42] |
Dinnie K (2004b) Country-of-origin 1965-2004: A literature review. J Customer Behav 3: 165–213. https://doi.org/10.1362/1475392041829537 doi: 10.1362/1475392041829537
|
| [43] |
Dinnie K, Melewar TC, Seidenfuss KU, et al. (2010) Nation branding and integrated marketing communications: an ASEAN perspective. Int Market Rev 27: 388–403. https://doi.org/10.1108/02651331011058572 doi: 10.1108/02651331011058572
|
| [44] |
Donato H, Donato M (2019) Etapas na condução de uma revisão sistemática. Acta Médica Port 32: 227–235. https://doi.org/10.20344/amp.11923 doi: 10.20344/amp.11923
|
| [45] |
Druckman D (1994) Nationalism, patriotism, and group loyalty: A social psychological perspective. Mershon Int Stud Rev 38: 43–68. https://doi.org/10.2307/222610 doi: 10.2307/222610
|
| [46] |
Ductor L (2015) Does co‐authorship lead to higher academic productivity?. Oxf B Econ Stat 77: 385–407. https://doi.org/10.1111/obes.12070 doi: 10.1111/obes.12070
|
| [47] | Dwivedi Y, Williams MD, Lal B, et al. (2008) Profiling adoption, acceptance and diffusion research in the information systems discipline. ECIS 2008 Proceedings, 112. Available from: http://aisel.aisnet.org/ecis2008/112. |
| [48] |
Dzhengiz T (2020) Bridging the gap: organisational value frames and sustainable alliance portfolios. Dzhengiz, T. Bridging the Gap: Organisational Value Frames and Sustainable Alliance Portfolios. Green Financ 2: 323–343. https://doi.org/10.3934/GF.2020018 doi: 10.3934/GF.2020018
|
| [49] | Everett DH, Whitton WI (1952) A general approach to hysteresis. Trans Faraday Soc 48: 749–757. Available from: https://pubs.rsc.org/en/content/articlelanding/1952/tf/tf9524800749/unauth. |
| [50] |
Ezuma REMR, Matthew NK (2022) The perspectives of stakeholders on the effectiveness of green financing schemes in Malaysia. Green Financ 4: 450–473. https://doi.org/10.3934/GF.2022022 doi: 10.3934/GF.2022022
|
| [51] |
Failler P, Li Z (2019) Welcome to Green Finance: A new open access journal for sustainable research professionals. Green Financ 1: 1–3. https://doi.org/10.3934/GF.2019.1.1 doi: 10.3934/GF.2019.1.1
|
| [52] |
Falagas ME, Pitsouni EI, Malietzis GA, et al. (2008) Comparison of Pubmed, Scopus, Web of Science, and Google Scholar: strengths and weaknesses. FASEB J 22: 338–342. https://doi.org/10.1096/fj.07-9492LSF doi: 10.1096/fj.07-9492LSF
|
| [53] |
Fan Y (2010) Branding the nation: Towards a better understanding. Place Branding Publi 6: 97–103. https://doi.org/10.1057/pb.2010.16 doi: 10.1057/pb.2010.16
|
| [54] |
Fetscherin M (2010) The determinants and measurement of a country brand: the country brand strength index. Int Market Rev 27: 466–479. https://doi.org/10.1108/02651331011058617 doi: 10.1108/02651331011058617
|
| [55] |
Foscht T, Maloles C, Swoboda B, et al. (2008) The impact of culture on brand perceptions: a six-nation study. J Prod Brand Manag 17: 131–142. https://doi.org/10.1108/10610420810875052 doi: 10.1108/10610420810875052
|
| [56] | Frankenberger-Graham KD, Smith MC, Kahle LR, et al. (2015) Exploring the relations between consumer perceptions of marketing, materialism and life satisfaction. Proceedings of the 1993 Academy of Marketing Science (AMS) Annual Conference Springer, 15–19. Available from: https://link.springer.com/chapter/10.1007/978-3-319-13159-7_4. |
| [57] |
Freeman LC (1977) A set of measures of centrality based on betweenness. Sociometry 40: 35–41. https://doi.org/10.2307/3033543 doi: 10.2307/3033543
|
| [58] | Friedman M, Friedman R (1980) Free to Choose: A Personal Statement. London, Secker and Warburg. Available from: https://www.proglocode.unam.mx/sites/proglocode.unam.mx/files/docencia/Milton%20y%20Rose%20Friedman%20-%20Free%20to%20Choose.pdf. |
| [59] |
Gaggiotti H, Cheng P, Yunak O (2008) City brand managemen (CBM): The case of Kazakhstan. Place Branding Publi 4: 115–123. https://doi.org/10.1057/palgrave.pb.6000081 doi: 10.1057/palgrave.pb.6000081
|
| [60] |
Gan C, Wang W (2015) Research characteristics and status on social media in China: A bibliometric and co-word analysis. Scientometrics 105: 1167–1182. https://doi.org/10.1007/s11192-015-1723-2 doi: 10.1007/s11192-015-1723-2
|
| [61] |
Geary D (2013) Incredible India in a global age: The cultural politics of image branding in tourism. Tourist Stud 13: 36–61. https://doi.org/10.1177/1468797612471105 doi: 10.1177/1468797612471105
|
| [62] | Gellner E (1994) Encounters with nationalism. Philos Quart 47. Available from: https://www.wiley.com/en-cn/Encounters+with+Nationalism-p-9780631194811. |
| [63] |
Gielens K, Steenkamp J-BEM (2019) Branding in the era of digital (dis) intermediation. Int J Res Mark 36: 367–384. https://doi.org/10.1016/j.ijresmar.2019.01.005 doi: 10.1016/j.ijresmar.2019.01.005
|
| [64] |
Gong W, Stump RL, Li ZG (2014) Global use and access of social networking web sites: a national culture perspective. J Res Interact Mark 8: 37–55. https://doi.org/10.1108/JRIM-09-2013-0064 doi: 10.1108/JRIM-09-2013-0064
|
| [65] |
Gorelick J, Walmsley N (2020) The greening of municipal infrastructure investments: Technical assistance, instruments, and city champions. Green Financ 2: 114–134. https://doi.org/10.3934/GF.2020007 doi: 10.3934/GF.2020007
|
| [66] |
Gössling S, Humpe A (2020) The global scale, distribution and growth of aviation: Implications for climate change. Global Environ Chang 65: 102194. https://doi.org/10.1016/j.gloenvcha.2020.102194 doi: 10.1016/j.gloenvcha.2020.102194
|
| [67] |
Gould M, Skinner H (2007) Branding on ambiguity? place branding without a national identity: Marketing northern Ireland as a post-conflict society in the USA. Place Branding Publi 3: 100–113. https://doi.org/10.1057/palgrave.pb.6000051 doi: 10.1057/palgrave.pb.6000051
|
| [68] |
Griffiths TL, Steyvers M (2004) Finding scientific topics. P Natl Acad Sci 101: 5228–5235. https://doi.org/10.1073/pnas.030775210 doi: 10.1073/pnas.030775210
|
| [69] |
Grimson A (2010) Culture and identity: two different notions. Soc Ident 16: 61–77. https://doi.org/10.1080/13504630903465894 doi: 10.1080/13504630903465894
|
| [70] |
Gupta N (2011) Globalization does lead to change in consumer behavior: An empirical evidence of impact of globalization on changing materialistic values in Indian consumers and its aftereffects. Asia Pac J Market Lo 23: 251–269. https://doi.org/10.1108/13555851111143204 doi: 10.1108/13555851111143204
|
| [71] | Guzman F (2005). A brand building literature review. ICFAI J Brand Manag 2: 30–48. https://pt.scribd.com/document/137034169/A-Brand-Building-Literature-Review. |
| [72] |
Haas R, Ajanovic A, Ramsebner J, et al. (2021) Financing the future infrastructure of sustainable energy systems. Green Financ 3: 90–118. https://doi.org/10.3934/GF.2021006 doi: 10.3934/GF.2021006
|
| [73] | Hahn ED, Soyer R (2005) Probit and logit models: Differences in the multivariate realm. J R Stat Soc Series B: 1–12. Available from: https://citeseerx.ist.psu.edu/document?repid = rep1 & type = pdf & doi = c45e142a45851c8b4da074ac38fd56bb5ff78749. |
| [74] |
Hao A W, Paul J, Trott S, Guo C, Wu HH (2021). Two decades of research on nation branding: A review and future research agenda. Int Market Rev 38: 46–69. https://doi.org/10.1108/IMR-01-2019-0028 doi: 10.1108/IMR-01-2019-0028
|
| [75] |
Hanson K, O'Dwyer E (2019) Patriotism and nationalism, left and right: A methodology study of American national identity. Polit Psychol 40: 777–795. https://doi.org/10.1111/pops.12561 doi: 10.1111/pops.12561
|
| [76] |
He J, Wang CL, Wu Y (2021) Building the connection between nation and commercial brand: an integrative review and future research directions. Int Market Rev 38: 19–35. https://doi.org/10.1108/IMR-11-2019-0268 doi: 10.1108/IMR-11-2019-0268
|
| [77] |
Hewett K, Hult GTM, Mantrala MK, Nim N, Pedada K (2022) Cross-border marketing ecosystem orchestration: A conceptualization of its determinants and boundary conditions. Int J Res Mark 39: 619–638. https://doi.org/10.1016/j.ijresmar.2021.09.003 doi: 10.1016/j.ijresmar.2021.09.003
|
| [78] |
Hicks D (1999) The difficulty of achieving full coverage of international social science literature and the bibliometric consequences. Scientometrics 44: 193–215. https://doi.org/10.1007/BF02457380 doi: 10.1007/BF02457380
|
| [79] |
Hill MO (1973) Diversity and evenness: a unifying notation and its consequences. Ecology 54: 427–432. https://doi.org/10.2307/1934352 doi: 10.2307/1934352
|
| [80] |
Hong ST, Wyer Jr RS (1989) Effects of country-of-origin and product-attribute information on product evaluation: An information processing perspective. J Consum Res16: 175–187. https://doi.org/10.1086/209206 doi: 10.1086/209206
|
| [81] |
Hsieh MH, Lindridge A (2005) Universal appeals with local specifications. J Prod Brand Manag 14: 14–28. https://doi.org/10.1108/10610420510583716 doi: 10.1108/10610420510583716
|
| [82] |
Huang Y, Yu K, Huang C (2023) Green finance engagement: An empirical study of listed companies on Chinese main board. Green Financ 5: 1–17. https://doi.org/10.3934/GF.2023001 doi: 10.3934/GF.2023001
|
| [83] | Hutcheson K (1970) A test for comparing diversities based on the Shannon formula. J Theor Biol 29: 151–154. Available from: https://cir.nii.ac.jp/crid/1571135650903988352. |
| [84] |
Ilić B, Stojanovic D, Djukic G (2019) Green economy: mobilization of international capital for financing projects of renewable energy sources. Green Financ 1: 94–109. https://doi.org/10.3934/GF.2019.2.94 doi: 10.3934/GF.2019.2.94
|
| [85] |
Johansson JK, Douglas SP, Nonaka I (1985) Assessing the impact of country of origin on product evaluations: a new methodological perspective. J Marketing Res 22: 388–396. https://doi.org/10.1177/002224378502200404 doi: 10.1177/002224378502200404
|
| [86] |
Kalamova MM, Konrad KA (2010) Nation brands and foreign direct investment. Kyklos 63: 400–431. https://doi.org/10.1111/j.1467-6435.2010.00480.x doi: 10.1111/j.1467-6435.2010.00480.x
|
| [87] |
Karrh JA (1998) Brand placement: A review. J Curr Iss Res Ad 20: 31–49. https://doi.org/10.1080/10641734.1998.10505081 doi: 10.1080/10641734.1998.10505081
|
| [88] |
Kaufmann HR, Durst S (2008) Developing inter-regional brands. Euromed J Bus 3: 38–62. https://doi.org/10.1108/14502190810873812 doi: 10.1108/14502190810873812
|
| [89] |
Keillor BD, Hult TGM (1999) A five-country study of national identity: Implications for international marketing research and practice. Int Market Rev 16: 65–84. https://doi.org/10.1108/02651339910257656 doi: 10.1108/02651339910257656
|
| [90] |
Kemfert C, Schmalz S (2019) Sustainable finance: Political challenges of development and implementation of framework conditions. Green Financ 1: 237–248. https://doi.org/10.3934/GF.2019.3.237 doi: 10.3934/GF.2019.3.237
|
| [91] |
Khasseh AA, Soheili F, Moghaddam HS, et al. (2017) Intellectual structure of knowledge in metrics: A co-word analysis. Inform Process Manag 53: 705–720. https://doi.org/10.1016/j.ipm.2017.02.001 doi: 10.1016/j.ipm.2017.02.001
|
| [92] |
Kirloskar-Steinbach M (2019) Diversifying philosophy: The art of non-domination. Educ Philos Theory 51: 1490–1503. https://doi.org/10.1080/00131857.2018.1562850 doi: 10.1080/00131857.2018.1562850
|
| [93] | Klein LR (1978) The supply side. Am Econ Rev 68: 1–7. https://www.jstor.org/stable/1809682 |
| [94] |
Klein JG, Ettensoe R (1999) Consumer animosity and consumer ethnocentrism: An analysis of unique antecedents. J Int Consum Mark 11: 5–24. https://doi.org/10.1300/J046v11n04_02 doi: 10.1300/J046v11n04_02
|
| [95] |
Kosterman R, Feshbach S (1989) Toward a measure of patriotic and nationalistic attitudes. Polit Psychol 10: 257–274. https://doi.org/10.2307/3791647 doi: 10.2307/3791647
|
| [96] |
Kotler P, Gertner D (2002) Country as brand, product, and beyond: A place marketing and brand management perspective. J Brand Manag 9: 249–261. https://doi.org/10.1057/palgrave.bm.2540076 doi: 10.1057/palgrave.bm.2540076
|
| [97] | Lantz G, Loeb S (1998) An examination of the community identity and purchase preferences using the social identity approach. ACR North Am Adv 25: 486–491.Available from: https://www.acrwebsite.org/volumes/8199/volumes/v25/NA-25. |
| [98] |
Lewison G (1998) New bibliometric techniques for the evaluation of medical schools. Scientometrics 41: 5–16. https://doi.org/10.1007/bf02457962 doi: 10.1007/bf02457962
|
| [99] |
Li WK, Wyer Jr RS (1994) The role of country of origin in product evaluations: Informational and standard-of-comparison effects. J Consum Psychol 3: 187–212. https://doi.org/10.1016/S1057-7408(08)80004-6 doi: 10.1016/S1057-7408(08)80004-6
|
| [100] |
Loo T, Davies G (2006) Branding China: The ultimate challenge in reputation management? Corp Reput Rev 9: 198–210. https://doi.org/10.1057/palgrave.crr.1550025 doi: 10.1057/palgrave.crr.1550025
|
| [101] |
Maciel FA, Rocha A, Silva JF (2013) Brand personality of global quick-service restaurants in emerging and developed markets: A comparative study in Brazil and the US. Latin Am Bus Rev 14: 139–161. https://doi.org/10.1080/10978526.2013.808950 doi: 10.1080/10978526.2013.808950
|
| [102] | Magurran AE (1988) Why diversity? Ecological Diversity and its Measurement Princeton University Press. Available from: https://link.springer.com/book/10.1007/978-94-015-7358-0. |
| [103] | Magurran AE, McGill BJ (2011) Biological diversity: frontiers in measurement and assessment Oxford University Press. Available from: https://www.journals.uchicago.edu/doi/abs/10.1086/666756. |
| [104] |
Maheswaran D (1994) Country of origin as a stereotype: Effects of consumer expertise and attribute strength on product evaluations. J Consum Res 21: 354–365. https://doi.org/10.1086/209403 doi: 10.1086/209403
|
| [105] | Margalef R (1972) Homage to Evelyn Hutchinson, or why there is an upper limit to diversity, Connecticut Academy of Arts and Sciences. Available from: https://digital.csic.es/handle/10261/166281. |
| [106] | Marino-Romero JA, Palos-Sanchez PR, Velicia-Martin FA (2023) Evolution of digital transformation in SMEs management through a bibliometric analysis. Technol Forecast Soc 199: 123014. http://doi.org/10.1016/j.techfore.2023.123014 |
| [107] |
Martínez NM (2016) Towards a network place branding through multiple stakeholders and based on cultural identities. J Place Manag Dev 9: 73–90. https://doi.org/10.1108/JPMD-11-2015-0052 doi: 10.1108/JPMD-11-2015-0052
|
| [108] |
Matzler K, Strobl A, Stokburger-Sauer N, et al. (2016) Brand personality and culture: The role of cultural differences on the impact of brand personality perceptions on tourists' visit intentions. Tourism Manage 52: 507–520. https://doi.org/10.1016/j.tourman.2015.07.017 doi: 10.1016/j.tourman.2015.07.017
|
| [109] | May RM (1979) Patterns of species abundance and diversity. Ecol Evol Communities 1: 81–120. https://cir.nii.ac.jp/crid/1573668924704110208 |
| [110] |
McFadden D (1974) The measurement of urban travel demand. J Public Econ 3: 303–328. https://doi.org/10.1016/0047-2727(74)90003-6 doi: 10.1016/0047-2727(74)90003-6
|
| [111] | McFadden D, Tye WB, Train K (1977) An application of diagnostic tests for the independence from irrelevant alternatives property of the multinomial logit model. Institute of Transportation Studies, University of California Berkeley, CA. Available from: https://onlinepubs.trb.org/Onlinepubs/trr/1977/637/637-007.pdf. |
| [112] | Mohan K, Ahlemann F (2011) What methodology attributes are critical for potential users? understanding the effect of human needs. In: Mouratidis, H., Rolland, C. (eds) Advanced Information Systems Engineering. CAiSE 2011. Lecture Notes in Computer Science, 6741. Springer, Berlin, Heidelberg. https://doi.org/10.1007/978-3-642-21640-4_24 |
| [113] |
Mooij M (2003) Convergence and divergence in consumer behaviour: implications for global advertising. Int J Advert 22: 183–202. https://doi.org/10.1080/02650487.2003.11072848 doi: 10.1080/02650487.2003.11072848
|
| [114] |
Moura J, Soares I (2023) Financing low-carbon hydrogen: The role of public policies and strategies in the EU, UK and USA. Green Financ 5: 265–297. https://doi.org/10.3934/GF.2023011 doi: 10.3934/GF.2023011
|
| [115] | Nielsen K (1999) Cosmopolitan nationalism. Monist 82: 446–468. https://www.jstor.org/stable/27903647 |
| [116] |
Norris M, Oppenheim C (2007) Comparing alternatives to the web of science for coverage of the social sciences' literature. J Informetr 1: 161–169. https://doi.org/10.1016/j.joi.2006.12.001 doi: 10.1016/j.joi.2006.12.001
|
| [117] |
Osareh F (1996) Bibliometrics, citation analysis and co-citation analysis: A review of literature. Libri 46: 149–158. https://doi.org/10.1515/libr.1996.46.3.149 doi: 10.1515/libr.1996.46.3.149
|
| [118] |
Ouellet JF (2007) Consumer racism and its effects on domestic cross-ethnic product purchase: An empirical test in the United States, Canada, and France. J Marketing 71: 113–128. https://doi.org/10.1509/jmkg.71.1.113 doi: 10.1509/jmkg.71.1.113
|
| [119] |
Özsomer A (2012) The interplay between global and local brands: A closer look at perceived brand globalness and local iconness. J Int Marketing 20: 72–95. https://doi.org/10.1509/jim.11.0105 doi: 10.1509/jim.11.0105
|
| [120] |
Özsomer A, Batra R, Chattopadhyay A, et al. (2012) A global brand management roadmap. Int J Res Mark 29: 1–4. https://doi.org/10.1016/j.ijresmar.2012.01.001 doi: 10.1016/j.ijresmar.2012.01.001
|
| [121] |
Papadopoulos N (2004) Place branding: Evolution, meaning and implications. Place Branding 1: 36–49. https://doi.org/10.1057/palgrave.pb.5990003 doi: 10.1057/palgrave.pb.5990003
|
| [122] |
Papadopoulos N, Hamzaoui-Essoussi L, El Banna A (2016) Nation branding for foreign direct investment: an Integrative review and directions for research and strategy. J Prod Brand Manag 25: 615–628. https://doi.org/10.1108/JPBM-09-2016-1320 doi: 10.1108/JPBM-09-2016-1320
|
| [123] |
Papadopoulos N, Cleveland M, Bartikowski B, et al. (2018) Of countries, places and product/brand place associations: an inventory of dispositions and issues relating to place image and its effects. J Prod Brand Manag 27: 735–753. https://doi.org/10.1108/JPBM-09-2018-2035 doi: 10.1108/JPBM-09-2018-2035
|
| [124] |
Pato ML, Teixeira AAC (2016) Twenty years of rural entrepreneurship: A bibliometric survey. Sociol Ruralis 56: 3–28. https://doi.org/10.1111/soru.12058 doi: 10.1111/soru.12058
|
| [125] |
Pearson D, Pearson T (2017) Branding food culture: UNESCO creative cities of gastronomy. J Food Prod Mark 23: 342–355. https://doi.org/10.1080/10454446.2014.1000441 doi: 10.1080/10454446.2014.1000441
|
| [126] | Perez ME, Padgett D, Burgers W (2011) Intergenerational influence on brand preferences. J Prod Brand Manag 20: 5–13. https://doi.org/10.1108/10610421111107978 |
| [127] |
Peterson RA, Jolibert AJP (1995) A meta-analysis of country-of-origin effects. J Int Bus Stud 26: 883–900. https://doi.org/10.1057/palgrave.jibs.8490824 doi: 10.1057/palgrave.jibs.8490824
|
| [128] | Pielou EC (1969) An introduction to mathematical ecology. Queen's University, Kigston, Ontario, Canada. Available from: https://www.cabdirect.org/cabdirect/abstract/19729701428. |
| [129] |
Ribeiro HCM, Cirani CBS (2013) Análise da produção científica da Revista de Administração e Inovação. Revista De Administração e Inovação 10: 208–228. https://doi.org/10.5773/rai.v10i4.1139 doi: 10.5773/rai.v10i4.1139
|
| [130] |
Ribeiro VM, Correia‐da‐Silva J, Resende J (2016) Nesting vertical and horizontal differentiation in two‐sided markets. B Econ Res 68: 133–145. https://doi.org/10.1111/boer.12084 doi: 10.1111/boer.12084
|
| [131] |
Rojas-Méndez J (2016) The nation brand molecule. J Prod Brand Manag 131: 891–941. https://doi.org/10.1093/qje/qjw005 doi: 10.1093/qje/qjw005
|
| [132] |
Rojas-Méndez J, Khoshnevis M (2023) Conceptualizing nation branding: the systematic literature review. J Prod Brand Manag 32: 107–123. https://doi.org/10.1108/JPBM-04-2021-3444 doi: 10.1108/JPBM-04-2021-3444
|
| [133] | Roztocki N, Weistroffer HR (2008) Event studies in information systems research: a review, Proceedings of the Fourteenth Americas Conference on Information Systems 1: 1–11. Available from: https://papers.ssrn.com/sol3/papers.cfm?abstract_id = 1235562. |
| [134] |
Samiee S (1994) Customer evaluation of products in a global market. J Int Bus Stud 25: 579–604. https://doi.org/10.1057/palgrave.jibs.8490213 doi: 10.1057/palgrave.jibs.8490213
|
| [135] |
Schwarz C (2018) ldagibbs: A command for topic modeling in stata using latent dirichlet allocation. Stata J 18: 101–117. https://doi.org/10.1177/1536867X1801800107 doi: 10.1177/1536867X1801800107
|
| [136] | Seo J (2008) The politics of historiography in China: Contextualizing the Koguryo controversy. Asian Perspect 32: 39–58. https://www.jstor.org/stable/42704640 |
| [137] |
Seo J (2021) Diagnosing Korea–Japan relations through thick description: Revisiting the national identity formation process. Third World Q 1: 1–16. https://doi.org/10.1080/01436597.2021.1937098 doi: 10.1080/01436597.2021.1937098
|
| [138] |
Shimp TA, Sharma S (1987) Consumer ethnocentrism: Construction and validation of the cetscale. J Marketing Res 24: 280–289. https://doi.org/10.1177/002224378702400304 doi: 10.1177/002224378702400304
|
| [139] |
Shugurov M (2023) International cooperation on climate research and green technologies in the face of sanctions: The case of Russia. Green Financ 5: 102–153. https://doi.org/10.3934/GF.2023006 doi: 10.3934/GF.2023006
|
| [140] |
Silva ST, Teixeira AAC (2009) On the divergence of evolutionary research paths in the past 50 years: a comprehensive bibliometric account. J Evol Econ 19: 605–642. https://doi.org/10.1007/s00191-008-0121-9 doi: 10.1007/s00191-008-0121-9
|
| [141] |
Smith PM, West CD (1994) The globalization of furniture industries/markets. J Glob Mark 7: 103–132. https://doi.org/10.1300/J042v07n03_06 doi: 10.1300/J042v07n03_06
|
| [142] |
Södergren J (2021) Brand authenticity: 25 Years of research. Int J Consum Stud 45: 645–663. https://doi.org/10.1111/ijcs.12651 doi: 10.1111/ijcs.12651
|
| [143] |
Song YA, Sung Y (2013) Antecedents of nation brand personality. Corp Reput Rev 16: 80–94. https://doi.org/10.1057/crr.2012.24 doi: 10.1057/crr.2012.24
|
| [144] | Stalnaker S (2002) Hub culture: The next wave of urban consumers Wiley. Available from: https://cir.nii.ac.jp/crid/1130282269900840704. |
| [145] |
Steenkamp J-BEM (2019) Building strong nation brands. Int Market Rev 38: 6–18. https://doi.org/10.1108/IMR-10-2019-0253 doi: 10.1108/IMR-10-2019-0253
|
| [146] |
Steenkamp J-BEM, Hofstede FT, Wedel M (1999) A cross-national investigation into the individual and national cultural antecedents of consumer innovativeness. J Marketing 63: 55–69. ttps://doi.org/10.1177/002224299906300204 doi: 10.1177/002224299906300204
|
| [147] |
Steenkamp J-BEM, Heerde HJ, Geyskens I (2010) What makes consumers willing to pay a price premium for national brands over private labels? J Marketing Res 47: 1011–1024. https://doi.org/10.1509/jmkr.47.6.1011 doi: 10.1509/jmkr.47.6.1011
|
| [148] | Tajfel H, Turner J (1979) An integrative theory of intergroup conflict, Oxford Management Readers. Available from: https://psycnet.apa.org/record/2010-11535-008. |
| [149] |
Teixeira AAC, Vieira PC, Abreu AP (2017) Sleeping beauties and their princes in innovation studies. Scientometrics 110: 541–580. https://doi.org/10.1007/s11192-016-2186-9 doi: 10.1007/s11192-016-2186-9
|
| [150] |
Therkelsen A, Gram M (2010) Branding Europe–between nations, regions and continents. Scand J Hosp Tour 10: 107–128. https://doi.org/10.1080/15022250903561903 doi: 10.1080/15022250903561903
|
| [151] | Tuan YF (1990) Topophilia: A study of environmental perception, attitudes, and values Columbia University Press. Available from: https://www.harvard.com/book/topophilia_a_study_of_environmental_perception_attitudes_and_values/. |
| [152] | Turner G (1994a) Making it national: Australian nationalism and popular culture. https://doi.org/10.4324/9781003116363 |
| [153] | Turner G (1994b) Whatever happened to national identity?: Film and the nation in the 1990s. Metro Magazine: Media and Education Magazine 1: 32–35. Available from: https://search.informit.org/doi/abs/10.3316/ielapa.153836366722575. |
| [154] |
Eck NJV, Waltman L (2009) How to normalize cooccurrence data? an analysis of some well-known similarity measures. J Am Soc Inf Sci Tec 60: 1635–1651. https://doi.org/10.1002/asi.21075 doi: 10.1002/asi.21075
|
| [155] |
Eck NJV, Waltman L (2010) Software survey: VosViewer, a computer program for bibliometric mapping. Scientometrics 84: 523–538. https://doi.org/10.1007/s11192-009-0146-3 doi: 10.1007/s11192-009-0146-3
|
| [156] | Eck NJV, Waltman L (2011) Text mining and visualization using VosViewer. arXiv preprint arXiv. https://arXiv.org/abs/1109.2058 |
| [157] |
Verlegh PWJ, Steenkamp J-BEM (1999) A review and meta-analysis of country-of-origin research. J Econ Psychol 20: 521–546. https://doi.org/10.1016/S0167-4870(99)00023-9 doi: 10.1016/S0167-4870(99)00023-9
|
| [158] | Volcic Z (2009) Television in the Balkans: The rise of commercial nationalism. Television studies after TV Routledge. Available from: https://research.monash.edu/en/publications/volcic-z-television-in-the-balkans-the-rise-of-commercial-nationa. |
| [159] | Volcic Z, Andrejevic M (2011) Nation branding in the era of commercial nationalism. Int J Commun 5: 21. https://ijoc.org/index.php/ijoc/article/view/849 |
| [160] |
Wakkee I, Sijde PV, Vaupell C, et al. (2019) The university's role in sustainable development: Activating entrepreneurial scholars as agents of change. Technol Forecast Soc 141: 195–205. https://doi.org/10.1016/j.techfore.2018.10.013 doi: 10.1016/j.techfore.2018.10.013
|
| [161] |
Wallström A, Steyn P, Pitt L (2010) Expressing herself through brands: a comparative study of women in six Asia-Pacific nations. J Brand Manag 18: 228–237. https://doi.org/10.1057/bm.2010.45 doi: 10.1057/bm.2010.45
|
| [162] |
Waltman L, Eck NJV, Noyons ECM (2010) A unified approach to mapping and clustering of bibliometric networks. J Informetr 4: 629–635. https://doi.org/10.1016/j.joi.2010.07.002 doi: 10.1016/j.joi.2010.07.002
|
| [163] |
Wang Y, Liu J, Yang X, et al. (2023) The mechanism of green finance's impact on enterprises' sustainable green innovation. Green Financ 5: 452–478. https://doi.org/10.3934/GF.2023018 doi: 10.3934/GF.2023018
|
| [164] |
White L (2009) The man from Snowy River: Australia's bush legend and commercial nationalism. Tour Rev Int 13: 139–146. https://doi.org/10.3727/154427209789604633 doi: 10.3727/154427209789604633
|
| [165] |
White GO, Guldiken O, Hemphill TA, et al. (2016) Trends in international strategic management research from 2000 to 2013: Text mining and bibliometric analyses. Manage Int Rev 56: 35–65. https://doi.org/10.1007/s11575-015-0260-9 doi: 10.1007/s11575-015-0260-9
|
| [166] |
Wilson JAJ, Hollensen S (2010) Saipa Group, Iran–using strategic brand extensions to build relationships. J Islamic Mark 1: 177–188. https://doi.org/10.1108/17590831011055905 doi: 10.1108/17590831011055905
|
| [167] |
Winit W, Gregory G, Cleveland M, et al. (2014) Global vs local brands: how home country bias and price differences impact brand evaluations. Int Market Rev 31: 102–128. https://doi.org/10.1108/IMR-01-2012-0001 doi: 10.1108/IMR-01-2012-0001
|
| [168] | Wodak R, Cillia R, Reisigl M (1999) The discursive construction of national identities. Discourse Soc 10: 149–173. https://eprints.lancs.ac.uk/id/eprint/1726/ |
| [169] |
Wolfswinkel JF, Furtmueller E, Wilderom CP (2013) Using grounded theory as a method for rigorously reviewing literature. Eur J Inform Syst 22: 45–55. https://doi.org/10.1057/ejis.2011.51 doi: 10.1057/ejis.2011.51
|
| [170] |
Zong QJ, Shen HZ, Yuan QJ, et al. (2013) Doctoral dissertations of library and information science in China: A co-word analysis. Scientometrics 94: 781–799. https://doi.org/10.1007/s11192-012-0799-1 doi: 10.1007/s11192-012-0799-1
|
Figures(15) / Tables(5)

Vitor Miguel Ribeiro. Pioneering paradigms: unraveling niche opportunities in green finance through bibliometric analysis of nation brands and brand culture[J]. Green Finance, 2024, 6(2): 287-347. doi: 10.3934/GF.2024012


 DownLoad: