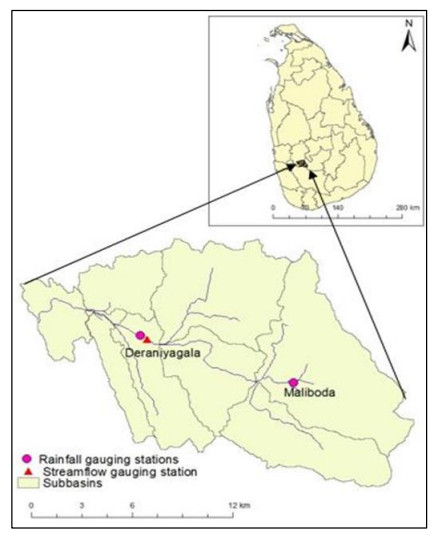
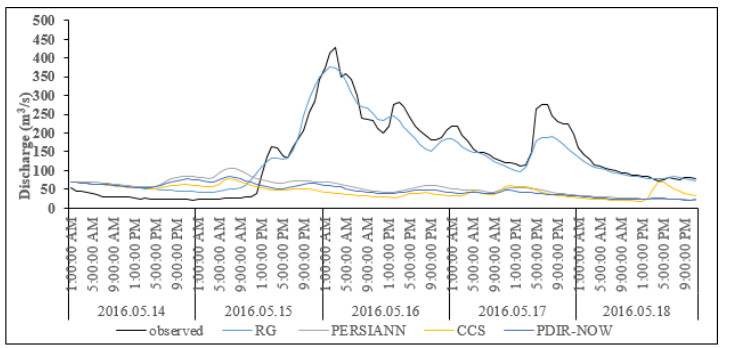
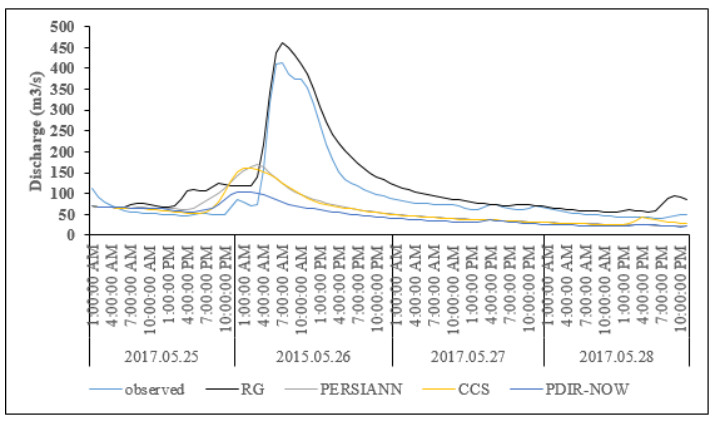
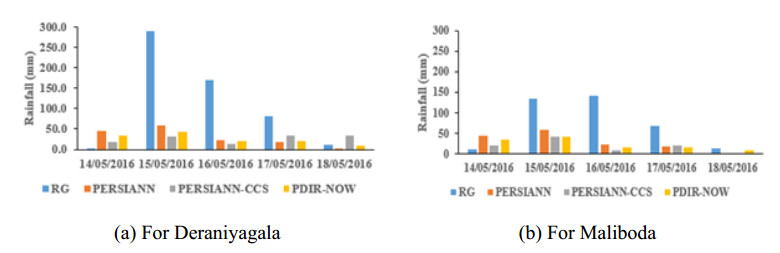
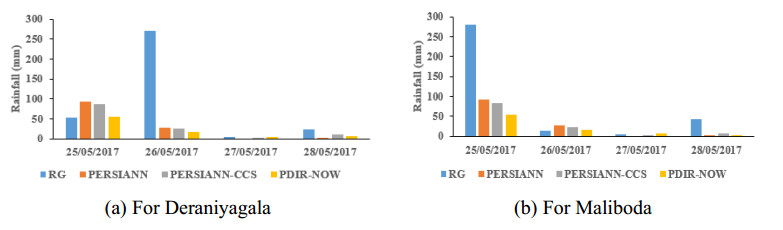
1.
Introduction
Many complex problems in real life are composed of conflicting and influential objectives, they need to be optimized simultaneously as much as possible in given constraints, that is, multi-objective optimization. These problems are very complex, difficult, but also very important. Multi-objective optimization is common and significant in actual life, and it is widely used in production and engineering design [1], job scheduling [2], management and decision-making [3], etc. In the multi-objective optimization problem, each objective restricts each other, it is impossible to have a solution that can make all the objectives achieve the optimal performance. Therefore, for the multi-objective optimization problem, the optimal solution is usually a set of non-inferior solutions, namely Pareto optimal solution set [4]. Therefore, the main tasks of multi-objective optimization are as follows: 1) Finding a set of solutions as close as possible to the Pareto front; 2) Finding a set of solutions as different as possible [4,5].
Meta-heuristic methods have powerful global search capabilities, which design iterative equations by simulating the behavioral characteristics of biological groups or the development and structural characteristics of physical things. Therefore, they are more appropriate for settling complex multi-objective optimization problems [6]. At present, a large number of Meta-heuristic methods have been proposed and improved to solve multi-objective optimization problems, such as, monarch butterfly optimization (MBO) which simplifies and simulates the migration process of monarch butterfly [7], slime mould algorithm (SMA) which is proposed based on the oscillation mode of slime mould in nature [8], Moth search algorithm (MSA) [9] which is a new kind of metaheuristic algorithm inspired by the phototaxis and Lévy flights of the moths, Harris hawks optimization (HHO) which simulates the predatory behavior of Harris hawk [10].
Meta-heuristic methods include two contradictory processes: exploration and exploitation, which need to establish a balance between them [11,12]. When exploitation is enhanced, randomization of the search is increased, which is helpful to avert falling into the local optimal solution in the process of optimization and improve the convergence accuracy. Conversely, when exploration is enhanced, local search capability of the meta-heuristic algorithm is more powerful, and the convergence speed is faster, but the approach is easier to fall into local optimum, especially the diversity of the obtained solutions becomes worse [13,14]. Meta-heuristic methods are population-based search and optimization methods whose efficacy mainly depends on a fine balance between exploration and exploitation [15]. Therefore, the balance between exploration and exploitation has been widely studied in meta-heuristic optimization algorithms [15,16,17,18,19,20].
The meta-heuristic optimization algorithms should be equipped with special control parameters to adjust exploration and exploitation in different stages of optimization. The control parameters should be designed and adjusted according to the specific optimization problems. Generally, there are two ways to design the control parameters. One is the constant control strategy [21], that is, to keep the control parameters unchanged in the whole iterative search process. Another way is to dynamically adjust the value of control parameters in the iterative search process to achieve the balance between exploration and exploitation [22]. The first way is simple and easy to implement, but it is very difficult to clearly identify the exploration and exploitation phases. It is generally considered that the strategy of more exploration in the early phase and more exploitation in the later phase is usually employed in the whole search process, such as linear control strategy [1,14], and nonlinear control strategy [22,23]. Therefore, the method of dynamically adjusting the value of control parameters is widely employed in meta-heuristic optimization algorithms. As discussed in [24], a proper balance between exploration and exploitation may drive the search process towards better performance. The balance between exploration and exploitation is critical to the performance of a meta-heuristic optimization method. However, a scheme of adjusting control parameters that performs better in problem A might not work effectively in problem B. How to balance the relationship between exploration and exploitation in complex optimization problems has become the goal of meta-heuristic algorithms design or improvement, which is still an open question. For this problem, the solution in this paper is that different values of the same parameters can be employed to different subpopulations of a meta-heuristic optimization method at the same time to ensure that a suitable value of parameters can be employed for the specific optimization problem.
As one of the dominant modern meta-heuristic optimization algorithms, grasshopper optimization algorithm (GOA) has been successfully applied to various optimization problems in several fields. The good performance of GOA has been proved in [1]. It has one control parameter, which balances between exploration and exploitation. Therefore, its advantages are over the other optimization algorithms, including ease of implementation, speed in searching, and ease of modifying algorithm components [25]. However, it suffers from slow convergence and is prone to getting stuck in local optima [25,26]. To resolve the issues above, a multi-group and co-evolution framework was proposed to improve GOA and apply to multi-objective optimization problems, which draws on the idea of co-evolution strategy in [24]. In order to achieve population diversity and evolutionary adaptability, each subpopulation of GOA is assigned a different parameter c, including linear adaptation, cosine adaption, arc adaption, etc. At the same time, the subpopulation is dynamically updated in the optimization process.
The main contributions of this research are as follows:
1) A multi-group and co-evolution framework is proposed to archive a fine balance between exploration and exploitation of swarm intelligence algorithm
2) Multi-objective grasshopper optimization algorithm base on the multi-group and co-evolution framework is developed to improve the convergence and diversity of optimal solutions.
3) Detailed experiments are designed on several benchmark functions to demonstrate the effectiveness of the proposed methods.
The rest of this paper is organized as follows. Section 2 introduces the related work about multi-objective optimization problems. Section 3 describes the definition of the multi-objective optimization problem to be solved in this paper. In Section 4, the multi-group and co-evolution framework, and the multi-objective grasshopper optimization algorithm based on this framework are illustrated in detail. Section 5 includes presentation and analysis of outcomes on test functions. Finally, Section 6 concludes the main work of this paper and suggests the next step of research work.
2.
Related works
Multi-objective optimization problems do not have a globally unique optimal solution, but to discover a cluster of optimal solutions. Therefore, the key to solving multi-objective optimization problems is to find a set of non-inferior solutions in the solution space, that is, the Pareto front. The approaches for settling multi-objective optimization problems can be divided into 5 categories [5]: decomposition methods [27,28], interactive methods [29,30], fuzzy methods [31,32], decision aid methods [33,34], and methods using meta-heuristics [35,36].
The meta-heuristic is an iterative generation progress that combines different heuristic algorithms to explore the search space. These algorithms are applied to settle complex optimization problems where traditional heuristics and optimization methods are not capable of being effective and efficient [37]. Constructing a dynamic balance mechanism between diversification and intensification is a key step. Diversification can explore the broader search space, while intensification is an in-depth exploitation of specific areas by using the accumulated experience in the previous search process. Meta-heuristic methods can quickly explore the areas containing high-quality solutions in the search space, meanwhile, they do not waste time to exploit areas that have been exploit before or can not find high-quality solutions. There are three meta-heuristic strategies: a dominance-based approach, an indicator-based alternative, and an adaptive proposal that incorporates both multi-objective strategies (dynamically allocating more resources to the most successful strategy during the execution) [38]. Meta-heuristic methods have widespread applications. The Non-dominated Sorting Genetic Algorithm (NSGA-II) is applied to settle the multi-objective optimization problem of telecommunication network, and then use the Choquet integral measure based on utility function to make the final choice [39]. A meta-heuristic method for RNA inverse folding problem is designed by Tian et al. [40], in which RNA inverse folding problem is defined as a multi-objective optimization problem, and the similarity between the target structure and the predicted structure is employed as a constraint. In [41], a novel flexible job shop scheduling problem based on linear programming model is built to schedule the spool fabrication activities. Then priority dispatching rules based heuristic scheduling approach is utilized to settle the problem. In [42], an extended Multi-row facility layout problem (MRFLP) has been studied, and the genetic algorithm is applied to resolve the optimization problem.
Recently, many meta-heuristic nature-inspired algorithms are proposed. They are nature-inspired and population-based optimization algorithms, which have been developing and adapting in varying ways, such as learner performance based behavior algorithm (LPB) [43], Dragonfly Algorithm (DA) [44], cat swarm optimization (CSO) [45], Backtracking search optimization algorithm (BSA) [46], Donkey and Smuggler Optimization Algorithm (DSO) [47], Fitness Dependent Optimizer (FDO) [48] and IFDO [49], Particle Swarm Optimization Algorithm(PSO) [50], Firefly Algorithm (FA) [51], Grasshopper Optimization Algorithm (GOA) [1], and several hybrid algorithm of different nature-inspired algorithms including A hybrid of Shuffled Frog Leaping Algorithm and Genetic Algorithm (SFGA) [52], WOAGWO [53] hybridizing Whale optimization algorithm (WOA) [54] with Grey wolf optimization (GWO) [55], and a many-objective multi-agent coordination optimization algorithm (MOMCO) [56] hybridizing with EA.
Swarm intelligence is an important meta-heuristic optimization method, which has been widely used in different fields as a very important optimization technology. Swarm intelligence optimization algorithm is a combination of randomness and some rules to solve the optimization problem, through the simulation of natural phenomena. This kind of algorithm has a general optimization process: firstly, the population is initialized randomly, and then the search direction of every individual in the population is guided according to the rules. Then when termination conditions are met (such as, the maximum number of iterations is reached), the algorithm stops, and the final solution is the global optimal solution. Therefore, the composition of their computational complexity is similar, which is composed of three main parts: population initialization, population individual updating and fitness calculation. Generally, it is closely related to the number of iterations M, the size of the population N, the dimension of the decision space D, the complexity of updating function f1(x) of the individual and the complexity of the fitness function f2(x). Therefore, the computational complexity of swarm intelligence can be presented as O(N)+O(MND)×O(f1(x))+O(MN)×O(f2(x)), where the big oh notation is used to show the computation complexity. O(N) is computational complexity of population initializing, O(MND)×O(f1(x)) is the computational complexity of population updating, and O(MN)×O(f2(x)) is the computational complexity of fitness calculation. Such as the computational complexity of PSO [50] is O(N)+O(MND)×O(N)+O(MN)×O(N) ), which takes O(MN2D); the computational complexity of WOA [54] and GOA [1] is also takes O(MN2D) respectively.
Among these swarm intelligence algorithms, GOA has been proved to have good performance in literature [1]. Therefore, there is a lot of literature on GOA based improvements and related applications. A comprehensive survey of the GOA is summarized in [25], which analyzes several modified versions of GOA and its applications in different fields in detail. For the purpose of ameliorating the optimization performance, GOA_jDE [57] which combines GOA and jDE [58] is proposed. GOA_jDE can greatly improve the convergence efficiency, convergence speed and calculation precision on the benchmark test in [57]. The chaos theory is also introduced into the optimization process of GOA, which employs chaotic maps to keep the exploration and exploitation progress balance of GOA and accelerate its global convergence speed [59]. A multi-objective grasshopper optimization algorithm for robot path planning in static environments was proposed to optimize several indexes such as cost, distance, energy or time [60].
In these GOA based optimization methods, the control parameter c is a significant parameter to maintain a balance between exploration and exploitation. The adjustment of parameter c can be divided into linear control strategy (LCS) and nonlinear control strategy (NCS), according to the classification method in [22]. In the original GOA, the linear control strategy is adopted for the control parameter c, which linearly decreases from the maximum value to the minimum value with the increase of the number of iterations. LSC transits linearly from the exploration phase to the exploitation phase. However, in order to balance exploration and exploitation more reasonably, some nonlinear control strategies (NCS) are proposed, such as cosine adaption, arc adaption, etc. A comprehensive table of adjustment methods of parameter c in GOA is presented in Table 1.
In the optimization process of meta-heuristic methods, how to find a fine balance between exploration and development is critical. Each specific balance control strategy has a good performance in a certain kind of optimization problems, but how to select the appropriate balance control strategy for specific complex optimization problem is very difficult, and it needs a very deep understanding of the optimization problem. In order to solve the above issues, a framework is designed in this paper, which integrates a variety of balance control strategies to achieve adaptive selection of the appropriate balance and improve the optimization effect.
3.
Multi-objective optimization problem description
The ordinary form of multi-objective optimization problem definition is as follows [4]:
where x=[x1,x2,…,xD] is a point in the D-dimensional decision space (search space), f=[f1,f2,…,fM] is an objective space with M optimization objectives.
The solutions of multi-objective optimization problems are usually a group of non-inferior solutions called Pareto optimal solutions. The Pareto front is the boundary defined by the set of all point mapped from Pareto optimal solutions. Equations (2) and (3) define the set of Pareto optimal solutions Ps and Pareto front Pf separately [4]:
In multi-objective optimization problems, the sub-objective functions may be uncorrelated or conflicting. It is not possible to have a certain solution that can make all the sub-objectives achieve optimal performance. Therefore, the primary task of all multi-objective optimization algorithms is to seek out as many Pareto optimal solutions as possible [5]. The proposed method of this paper has two objects: 1) finding a set of solutions f(x′) which converge to the Pareto front Pf as close as possible, as shown in Eq (4); 2) finding a group of solutions as diverse as possible, as shown in Eq (5).
In this paper, the multi-group and co-evolution framework of swarm intelligence algorithm is designed to further achieve these two objects. By grouping the entire population into different subpopulations, the proposed framework increases the diversity of population and the randomness of search, to meet the requirements of Eq (5). In the iterative process, the co-evolution mechanism between subpopulations is established to ameliorate the convergence speed and accuracy of swarm intelligence algorithm, satisfying the requirements of Eq (4) as much as possible. The solution space of multi-objective optimization problem is transformed into the search space of the swarm intelligence algorithm, and the metrics of x′ is also transformed into the search conditions and evolution criterions of the swarm intelligence algorithm. So, in the multi-objective optimization problems, the convergence speed refers to the number of iterations t needed to find several solutions satisfying Eq (4). The convergence accuracy is determined by ϵ in Eq (4), the smaller ϵ is, the higher the convergence accuracy is. The diversity of Pareto optimal solutions is determined by Eq (5). Each solution should keep a certain difference or distance. In the experiment, this paper does not directly and independently determine the parameters ϵ and σ, but indirectly chooses the multi-objective optimal solutions according to the overall performance of their convergence and diversity on the real Pareto front.
4.
MOGOA based on the multi-group and co-evolution framework
Firstly, the multi-group and co-evolution framework of swarm intelligence algorithm is presented in Section 4.1, including the design of the grouping strategy of the population, the co-evolution strategy among subpopulations, and the selection strategy of key parameters. In Section 4.2, we first briefly introduce GOA, and then illustrate how to integrate GOA into the framework in detail. MOGOA based on the multi-group and co-evolution framework is described in Section 4.3.
4.1. The multi-group and co-evolution framework
The multi-group and co-evolution framework is an optimization mechanism of swarm intelligence algorithm. It can keep the exploration and exploitation balance in the search process and ameliorate the speed and accuracy of convergence by building variety of subpopulations and establishing information interaction mode between subpopulations. As shown in Figure 1, the multi-group and co-evolution framework of a swarm intelligence algorithm is divided into two key components: the grouping mechanism and the co-evolution mechanism. The grouping mechanism includes two steps: population division and parameter setting. The co-evolution mechanism includes two steps also: communication and feedback between subpopulations.
4.1.1. Grouping mechanism
When the optimization objective is determined, the swarm intelligence algorithm will select and determine the population size, control variables and other key parameters of the population to search the optimization space. Depending on the parameter change mechanism in the search process, the exploration and exploitation of the swarm intelligence algorithm are constantly compromised. A commonly used method is: in the incipient stage of search, the exploration is more important which make the search agent cover more search space; and then the exploitation is gradually emphasized with the iterative process of the algorithm, the optimal solution is searched in the local space [4]. After the population is determined, the search agents start to work according to the established search strategies in the whole search iteration process. Therefore, all search agents in the population and their search strategies lack difference. For the purpose of increasing the difference and diversity of search agents, this paper proposes a grouping mechanism, which divides the entire population into different subpopulations. Each subpopulation can be set different key parameters and search strategies.
The entire population can be divided into different subpopulations in different ways. According to the size of subpopulation, there are average divisions, random divisions and so on; the setting of the initial parameters and search strategy of each subpopulation can also be achieved by random or fixed assignment. Based on GOA, this paper focuses on the research and implementation of two grouping mechanisms: fixed and random assignment of parameters under the condition of average population division.
4.1.2. Co-evolution mechanism
Different subpopulations have different optimization paths, and different search agents also produce different search information in each subpopulation. The proposed co-evolution mechanism is used to determine the interaction pattern of this information, including those within and between subpopulations. After different subpopulations have completed the search in parallel, they can share the information of the optimal solution and the worst solution found in the current iteration, and constantly adjust the search strategy. Meanwhile, the performance of different subpopulations is feed back to the grouping mechanism, and then the size and some key parameters of subpopulations are updated according to the feed information to further improve the efficiency of the swarm intelligence algorithm.
4.2. GOA based on the multi-group and co-evolution framework
The idea of grasshopper optimization algorithm is briefly described firstly, then the implementation of GOA with the grouping and co-evolution mechanism is described in detail, and the pseudo code of GOA based on the multi-group and co-evolution framework is also given.
4.2.1. Grasshopper optimization algorithm
Following is presenting the mathematical model employed to simulate the swarming behavior of grasshoppers [1]:
where Xi represents the position of the i-th grasshopper, Si signifies social interaction, Gi defines the gravity force on the i-th grasshopper, Ai shows the wind advection. random numbers r1, r2 and r3 selected from [0, 1] are used to provide random behaviors.
Si is an important component of the model [1], as follows:
where dij represents the distance between i-th and j-th grasshopper, N is the number of grasshoppers.
In Eq (7), the function s(r) signifies the social forces [1], as follows:
where f defines the intensity of attraction and l indicates the attractive length scale.
Gi is calculated as follows [1]:
where g is a constant which is used to adjust the effect of gravity and eg is a unity vector towards the center of earth.
Ai is calculated as follows [1]:
where u is a constant which is used to adjust the effect of drift and ew is a unity vector determining the direction of wind.
So, Eq (6) can be rewritten as follows [1]:
To solve optimization problems, Gi is omitted and Ai is replaced by optimization target as the wind direction in Grasshopper Optimization Algorithm (GOA) [1]. The above model is adjusted as follows:
where ubd and lbd are the upper and lower boundary of the D-dimensional search space separately. Td is the optimal solution of the objective function in the current iteration as the wind direction. c is a key parameter in GOA, which is proportional to the amount of iterations. The parameter c helps to balance the value of repulsion/gravitation between grasshoppers dynamically [1].
If the parameter c decreases too fast in the inchoate stage of GOA, it will make an insufficient exploration. Conversely, if the parameter c decreases too slowly in the later stage of GOA, the exploitation of GOA will be insufficient. For the purpose of keeping the exploration and exploitation balance of GOA, this paper ingrates GOA into the multi-group and co-evolution framework to effectively balance local and global search ability of GOA.
4.2.2. Grouping algorithm
Grouping algorithm for GOA includes two key parameters setting: subpopulation number and the parameter c of GOA.
● The initial subpopulation number and size
There are several ways to divide population of GOA into different groups, such as average division, dynamic division and random division. This paper adopts the average division method, which facilitates the comparison of the final results during the iterative update process, such as Eq (13). The number and the size of subpopulation are related to the specific optimization problem.
where the whole population S are divided into ns subpopulations, each of which have the same size.
● Settings of the parameter c of GOA
In this paper, three forms are selected to set the parameter c of GOA [10,57], as follows:
where c1, c2 and c3 are three different forms of parameter c, c1is a linear adaptation form of LCS, c2 is a cosine adaption form of NCS, c3 is an arc adaption form of NCS; cmax means the maximum, cmin means the minimum, m is the current iteration number, M is the maximum iteration number, in this paper, cmax and cmin are set to 1 and 0.00001, respectively.
We use a fixed assignment strategy and an equal probability random assignment strategy to allocate different parameter c to each subpopulation in this paper.
The fixed assignment strategy adopts the following methods:
where Si presents the i-th subpopulation, cSi is the form of parameter c of the i-th subpopulation, n is the number of parameters c, cj is one of n different forms of parameter c.
Before the search process starting, each subpopulation Si fixedly chooses a corresponding parameter cj which remains unchanged in the whole optimization process.
The random assignment strategy adopts the following methods:
where r is a random integer between 1 and n, n is the number of parameters c that can be chosen.
In each iteration, every subpopulation can choose a different form of parameter c with equal probability according to the calculated random number in Eq (18). The Grouping algorithm not only enhances the diversity of GOA's population, but also avoids GOA from falling into a local optimum. The multiplicity of population also increases the adaptability of the algorithm to solve optimization problems with different characteristics.
4.2.3. Co-evolutionary algorithm
The co-evolutionary algorithm builds connections between the different subpopulations, realizes the information interaction between subpopulations, and then adjusts the evolution direction of GOA. Before running the next iteration, we compare the advantages and disadvantages of the optimal solution obtained from each subpopulation in the current iteration, in order that update the optimal solution of the entire population. The optimal solution is assigned to each subpopulation as the new evolution direction of GOA. Therefore, after each iteration, all subpopulations determine a new evolution direction again based on the results of the previous information interaction. In the frequent iterative process, subpopulations constantly exchange information to achieve the purpose of co-evolution. The co-evolutionary algorithm increases the probability that the population converges to the optimal solution. The optimal solution obtained is more intensification in each independent running.
4.2.4. GOA based on multi-group and co-evolution
The pseudo code of GOA based on the multi-group and co-evolution framework (GOA-MC) is shown in Figure 2. According to grouping algorithm, the group operation first divides the entire population into ns subpopulations. In the co-evolutionary operation, the evolution direction of entire population is updated according to the optimal solutions of all subpopulations in each iteration. Then using Eq (12) update the position of all grasshoppers according to the direction of evolution. In each iteration, the parameter c of subpopulations can change using Eq (18). The update of positions of grasshoppers runs until the termination condition is met. Finally, the optimal fitness and position of the objective function are given.
4.3. MOGOA based on the multi-group and co-evolution framework
Results of the experiment in Section 5.1 verify that there is a remarkable enhancement in convergence speed and accuracy of GOA-MC algorithm compared to the initial GOA algorithm. Therefore, a MOGOA-MC method is proposed which integrate MOGOA [29] into the multi-group and co-evolution framework, as shown in Figure 3. Using the same structure as MOGOA, this paper also constructs an external archive to keep optimal solutions from all subpopulations in each iteration and chooses the first n best performing optimal solutions as the final Pareto solution set in lines 5–6. Using the idea of co-evolutionary operation in algorithm 1, the evolutionary direction of all subpopulations is updated in line 7.
The final results of the multi-objective optimization problem are a group of solutions, which can not be directly compared with each other to get one optimal solution. So, we construct an external archive to store the optimal solution set, then compare and update the archives of all subpopulations together to obtain a global optimal solution set by adopting the elitist scheme in line 6. When the total amount of optimization solutions searched is greater than the size defined by the external archive, the average distance between each solution and all other solutions is figured using Eq (19), and the distances are sorted. The top n solutions with the largest average distance are selected and kept in the archive. Each new solution obtained from the next iteration needs to be compared with the average distance of other solutions in the archive, so as to constantly update the archive.
where A_dist(xi) refers to the average distance between optimal solution xi and all other solutions, K is the size of the external archive.
This method of selecting the optimal solutions has a disadvantage: in the process of archive updating, it can not guarantee that the final selected optimization solutions are those with the largest average distance among all searched optimal solutions. In other words, among all the optimal solutions obtained, the solutions with larger average distance may be deleted in the update process. This disadvantage can be improved by increasing the size of external archive, but the increase of capacity will increase the cost of optimal solutions ranking. The size of external archive is related to the specific optimization objectives, and a balance needs to be made between the cost of computation and the diversity of optimal solutions.
5.
Results on test functions
This section first benchmark the performance of the proposed GOA-MC algorithm to verify the effectiveness of the multi-group and co-evolution framework in Section 5.1. Then in Section 5.2, several standard multi-objects test functions with different characteristics are applied to verify the performance of MOGOA-MC algorithm. The details of test functions employed in this work are presented in Tables A1–A6 of the Appendix. For the purpose of verifying the outcomes, GOA [1] and MOGOA [14] which have very good performance in the literatures of optimization problems are employed to compare with GOA-MC and MOGOA-MC respectively. All the experiments were carried out in this PC Configuration: System, Windows 10; CPU, 3.00 GHz; RAM, 16.00 GB; Language, Matlab 2016.
5.1. Quantitative results and discussion of GOA-MC
For the purpose of verifying the improvement of convergence accuracy, convergence speed and search ability by the multi-group and co-evolution framework, a series of test functions [1,67] with different characteristics are applied, where test functions F1–F7 are unimodal benchmark functions, F9–F13 are multimodal benchmark functions, and F14–F19 are composite benchmark functions. Then the sensitivity analysis of the main parameters is carried out to verify the effectiveness of this framework.
5.1.1. Discussion of computational results
We compared and analyzed the performance of GOA with three different forms of parameter c and the GOA-MC with two different strategies. GOA-1, GOA-2, and GOA-3 are the original grasshopper optimization algorithm without using the multi-group and co-evolution framework. GOA-1, GOA-2, and GOA-3 respectively use the linear self-adaptive, cosine self-adaptive, and arc self-adaptive parameter c in Eqs (14)–(16). GOA-F and GOA-R are based on the multi-group and co-evolution framework respectively using fixed and randomly assigned parameter c in Eqs (14)–(16). For the sake of fairness, the main control parameters used in these algorithms refer to the parameter settings in [1] and [14], which are displayed in Table 2. Except for the number of subpopulations, other parameter settings are the same.
Each test function runs 20 times independently for generating the statistical results in Table 3 and Figure 4. The average convergence curve of F1–F19 are presented in Figure 4. The steeper the curve descends, the faster the convergence rate will be. The closer the curve is to the x-axis, the better the convergence accuracy is. Compared with GOA-1, GOA-2 and GOA-3, GOA-F and GOA-R have significant performance improvement for most benchmark test functions. The way regulating the balance mechanism of exploration and exploitation is different by different forms of parameter c, such as LCS or NCS. In the GOA-F and GOA-R, subpopulations with different forms of parameter c search the optimal value at the same time. Therefore, in the process of searching the optimal value, a variety of balance mechanisms are used, then the search information exchange among subpopulations is completed through the co-evolution mechanism, which improves the ability of GOA to find the optimal value quickly and accurately. These results in Table 3 also prove that the optimization capability of GOA can be effectively improved by the multi-group and co-evolution framework.
For unimodal benchmark test functions F1–F7 which have only one global optimum, the outcomes in Table 3 and Figure 4 prove that the multi-group and co-evolution framework significantly improves convergence accuracy and speed of GOA. On the multimodal benchmark functions F8–F13 with several local optimal solutions, except for F9, GOA-F and GOA-R outperform others. The results of F8–F13 in Figure 4 also show the superiority of the multi-group and co-evolution framework in convergence speed. Due to the existence of local optimal solutions, the optimization algorithm needs to further balance exploration and exploitation and jumps out of local optimum through exploration. Therefore, the comprehensive performance in the multimodal benchmark functions shows that the grouping mechanism of the framework can further improve the exploration capacity of the algorithm, and the co-evolution mechanism simultaneously ensures the exploitation ability.
Composite benchmark functions are more complex than other general multimodal benchmark functions. According to the composite benchmark functions F14–F19 in Table 3, it can be observed that all the algorithms have generated the same best results. In the process of calculation, we found an interesting phenomenon: all five algorithms will converge to the same optimal value after a certain amount of iterations, even if we adjust the parameters in Table 2 by a large margin. But in the convergence speed, they are still quite different. As can be observed from Figure 4, GOA-F and GOA-R have faster convergence speed than GOA-1, GOA-2 and GOA-3 on F14-F19. Because each subpopulation has different form of parameter c, GOA-F and GOA-R can simultaneously strengthen the ability of exploration and exploitation in different stages of the optimization process to accelerate convergence.
5.1.2. Sensitivity analysis
In this section, the sensitivity analysis of main parameters is discussed in detail. The size of subpopulation and the number of groups are two main parameters affecting the performance of the multi-group and co-evolution framework. The impact on convergence accuracy and speed of proposed approach is examined by a series of experiments on test functions F1–F19. Table 4 presents the settings of the main parameters for sensitivity analysis. The size of the subpopulation has 5 different scales. The number of groups has 10 levels. Therefore, on each test function, 50 different groups of experiments of GOA-R are run 10 times independently to conduct a comprehensive sensitivity analysis.
The results can be observed in Figure 5 in detail. The x-axis means the population size, and the numbers 1–5 indicate the population size of 10, 40, 70,100 and 130 respectively. The y-axis means the number of subpopulations. The z-axis represents the average of the optimal values obtained by each group after 10 independently runs. It should be noted that the results are normalized between 0 and 1 for facilitating the sensitivity analysis. The optimization results will not be significantly improved with the increasing number and size of subpopulations, but sometimes gets worse, such as the results of F2, F5, F8, F11, F15 and F19 in Figure 5. Similar results are also found on other test functions. The search agent of GOA appears to attract each other frequently on the unimodal test functions and have high repulsion rate between each other when settling multi-modal and composite test functions [1]. Therefore, when the size of subpopulation increases, the high repulsion rate will have negative influence on the convergence. Moreover, when the size of population continues to increase, this influence will gradually offset the performance improvement brought by the multi-group and co-evolution framework.
As shown in Figure 6, with the increase in the population size and the number of subpopulations, the running time increases as well on test function F1. The similar results are also found on other test functions. The increase of the number of subpopulations increases the amount of information interaction between subpopulations, and the increase of population size enhances the amount of information interaction within subpopulations.
It can be seen from the above analysis that excessive grouping and large population size can not improve the convergence accuracy, but will significantly increase the running time. A practicable suggestion is that the size of subpopulation should be controlled between 40 and 100, and the number of groups should be controlled between 3 and 5.
5.2. Quantitative results and discussion of MOGOA-MC
In this section, several standard multi-objective tests functions with different features are applied to verify the performance of the presented approach in multi-objective optimization. These standard test functions are used in many literatures on multi-objective optimization: ZDT [68], DTLZ [69], and CEC2009 [70].
For the purpose of intuitively assess the performance of MOGOA-MC in convergence, accuracy, and diversity of optimal solutions, two performance indicators are employed: generation distance (GD) and inverse generation distance (IGD) [14]. IGD metric calculates the Euclidean distance between the obtained Pareto optimal solution and the true Pareto optimal solution in the reference set, which can measure the convergence and diversity of the algorithm.
The smaller the value of IGD is, the better the overall performance of the algorithm is.
where P is the Pareto optimal solution acquired by the algorithm, P* is a group of uniformly distributed reference points sampled from the true Pareto optimal solutions, and dist (x, y) refer to the Euclidean distance.
As a convergence evaluation indicator, GD metric measures the closeness between the obtained Pareto optimal solutions and the true Pareto optimal solutions. The closer GD is to 0, the better the convergence is.
where the definitions of P, P*, and dist (x, y) are the same as those in IGD.
Similar to GOA-MC, for the purpose of verifying the advantage of the multi-group and co-evolution framework in settling multi-objective optimization problems, we designed a comparative experiment between the MOGOA combined with the multi-group and co-evolution framework (MOGOA-MC) and the original MOGOA. The original MOGOA separately adopts three different forms of parameter c, which are MOGOA-1 using the parameter c in Eq (14), MOGOA-2 using the parameter c in Eq (15) and MOGOA-3 using the parameter c in Eq (16). MOGOA-MC separately adopts two different assignment strategies of parameter c, which are MOGOA-F and MOGOA-R. MOGOA-F adopts fixed assignment strategy to assign a fixed parameter c to each subpopulation from Eq (17). MOGOA-R using random assignment strategy to randomly assign a parameter c for each subpopulation from Eq (18). Other parameters are set uniformly as follows: the amount of population is set to 120, the maximum numbers of iterations is set to 100, the number of subpopulations is 3, cmax and cmin are set to 1 and 0.00001 respectively.
5.2.1. Results on ZDT and DTLZ
The quantitative results on ZDT and DTLZ are presented in Tables 5–7. All algorithms are run independently 20 times. The average, standard deviation, best, and worst values of IGD are presented in Table 5, and the values of GD are presented in Table 6. The obtained Pareto fronts are qualitatively illustrated in Figures 7 and 8.
Each benchmark test function has its own characteristics, and different settings of key parameters will have an impact on the performance of algorithms. Such as, on ZDT1, ZDT2 and ZDT4, MOGOA-2 utilizing the parameter c with cosine adaption form of NCS have better performance than MOGOA-1 and MOGOA-3; On ZDT3 which has a nonconvex and discontinuous Pareto front, MOGOA-1 utilizing the parameter c with line adaption form of LCS have better performance than MOGOA-2 and MOGOA-3. However, in practical application, it is very difficult to choose the appropriate parameter settings when the optimization problem is not well understood. Therefore, in this paper, in order to solve the problem of parameter selection and setting, a variety of different settings of one key parameter are comprehensively applied in the optimization search process. The effectiveness of the proposed method is also proved by the results in Table 5. Such as, IGD values of MOGOA-F and MOGOA-R are significantly better than MOGOA-1, MOGOA-2 and MOGOA-3 on ZDT1, ZDT3 and ZDT4. On ZDT2, compared with the best algorithm MOGOA-2, MOGOA-F and MOGOA-R also show strong competitiveness.
Through the co-evolution mechanism, the optimization information can be exchanged between subpopulations, so that all search individuals can converge to the true Pareto front as soon as possible. Therefore, the global optimization solutions can be found faster and more accurately. The conclusions can be drawn from the values of GD in Table 6, MOGOA-F and MOGOA-R have significantly better performance than others.
Practical optimization problems usually involve more than two objectives. The more objectives there are, the more complex the optimization problem is, so it is difficult to get its Pareto front and to visualize it. In order to verify the effectiveness of the method in the multi-objective optimization problem with more than two objectives, we benchmark it on DTLZ1. DTLZ1 has three objectives that need to be optimized at the same time, and its Pareto front is a hyperplane. The quantitative results in Table 7 also show the good IGD and GD performance of MOGOA-F and MOGOA-R on DTLZ1. Although the performance improvement is not as good as ZDT series test functions, the effect is still significant.
The quantitative results in Tables 5–7 verify the superiority of the algorithms with the multi-group and co-evolution framework and prove that the framework can significantly improve the diversity and convergence of Pareto optimal solutions. The qualitative distribution presentation of best Pareto optimal fronts in Figures 7 and 8 also supports this conclusion. In our method, different subpopulations have different settings of key parameters, and the optimization mechanism of search individuals is also different. Therefore, more diverse optimization solutions can be found, and the distribution of optimization schemes is more uniform. The Pareto optimal fronts obtained from MOGOA-F and MOGOA-R are more equally distributed in the true Pareto optimal fronts than that of MOGOA-1, which also prove that the multi-group and co-evolution framework improves the diversity of Pareto optimal solutions.
5.2.2. Results on CEC2009 test functions
In this section, the CEC2009 test functions are applied to further confirm the performance of the proposed methods. UF1–UF7 test functions are bi-objective, UF8–UF10 test functions are tri-objective. The results on CEC2009 test functions are presented in Tables 8 and 9.
The conclusions on CEC2009 test functions are consistent with those of ZDT series test functions and DTLZ test functions. The multi-group mechanism in the multi-group and co-evolution framework gives more differences to the search individuals, which can help to search more diverse optimization solutions; the co-evolution mechanism makes the subpopulations with better performance can transmit information to the whole population, so as to speed up the convergence speed and improve the search efficiency and convergence accuracy.
The IGD values in Table 8 show that the performance of MOGOA-F and MOGOA-R are also better than that of MOGOA-1, MOGOA-2 and MOGOA-3 on the CEC2009 test suite. The GD values in Table 9 also verify that the proposed algorithms have better convergence than original MOGOA. However, on UF5, UF6 and UF10, although the proposed method is very competitive, it does not show the best performance. Since the Pareto fronts of UF5 and UF6 are discontinuous, and the metric of GD measures the average Euclidean distance from each solution obtained from algorithm to the solution on the nearest true Pareto front, the performance of the proposed methods on this kind of optimization problems are not significant.
In terms of overall performance, these outcomes in Tables 8 and 9 can affirm that the multi-group and co-evolution framework is able to ameliorate the diversity and the convergence of the Pareto optimal solutions.
The average, standard deviation, maximum, and minimum in the previous tables are obtained from the results of 20 independent runs. They reflect the average performance of the algorithm. To show that the outcomes were not acquired accidentally, the Wilcoxon rank-sum test is employed. The p-values are the results of the Wilcoxon rank-sum test. When p-values are less than 0.05, it shows that rank sum rejects the null hypothesis of equal medians at the default 5% significance level. The higher the p value, the more competitive the algorithm is, even if it is not the best one. The p-values of the algorithm with the best average performance in each test function is "N/A". Then the best performing algorithm is chosen to test with other algorithms in pairs. The p-values in Table 10 show that MOGOA-F and MOGOA-R based on the multi-group and co-evolution framework performs well on most of the test functions. The p-values between MOGOA-F and MOGOA-R are all greater than 0.05 on GD and IGD, which indicates that the two algorithms are highly competitive with each other. While MOGOA-1, MOGOA-2 or MOGOA-3 are not the algorithm with the best average performance, their p-values are less than 0.05 in most test functions, so they are not competitive.
In general, the above experimental outcomes indicate that the improvement of the multi-group and co-evolution framework to the diversity and convergence of MOGOA is very significant. Although MOGOA has proved its superiority in reference [14], which are compared with other competitive multi-objective optimization algorithms, such as MOPSO, MOEA/D. The proposed methods are greatly effective for settling optimization problems with multiple objectives. This is mainly attributed to these two features of the framework: firstly, the grouping of subpopulations with different evolutionary mechanisms increases the diversity of search agents and strengthens the exploration capability of the optimization algorithm; secondly, the co-evolution mechanism between subpopulations ensures the convergence of the algorithm, and accelerates the convergence speed.
6.
Conclusions
In this paper, a multi-group and co-evolution framework for meta-heuristic methods is proposed, which is employed to improve the performance of GOA. With the fast convergence and high accuracy, the promising performance of the framework is verified on the benchmark test functions. The sensitivity of the main parameters is analyzed to check the feasibility and validation of the proposed framework. For the multi-objective optimization problems, the proposed framework was used to extend the MOGOA algorithm. To evaluate the performance improvement brought by the proposed framework, the numerical evaluations were also conducted by comparing with the original MOGOA on a series of test suits. GD and IGD were calculated to prove the advancement of diversity and accuracy of solutions by the proposed framework. Moreover, the Wilcoxon rank-sum tests were also conducted to show the statistically significant. It could be said that these improvements were due to the modifications in the difference and interaction of search agents, which led to more convenient exploration and more active exploitation. The proposed methods in this paper can find a fine balance between exploration and exploitation, which is particularly important in solving multimodal search space and large-scale optimization problems without deep understanding, such as feature selection and neural network training in machine learning, job-shop scheduling and control of power systems in engineering applications. Experimental results show the effectiveness of the proposed method, but there are still some limitations. Because of no free lunch theorem in the optimization domain, the proposed method needs further adjustment and modification to adapt to the actual specific problems, such as binary, dynamic, discrete, and others. Due to the existence of co-evolution among subpopulations, the proposed method spends more time than original algorithm in the optimization process. The multi-group and co-evolution framework is only applicable to the same kind of swarm intelligence algorithm at present. Therefore, for future research, it is suggested to further improve the multi-group and co-evolution framework for integrating various swarm intelligence algorithms. The settings of key parameters should also be quantitatively explained according to specific problems in this framework. It will be focused on the applications on more complex engineering problems.
Acknowledgments
This work is partially supported by the Natural Science Foundation of China under Grant (31771679, 31671589), the Anhui Foundation for Science and Technology Major Project, China, under Grant (16030701092, 18030901034, 201904e01020006), the Key Laboratory of Agricultural Electronic, Commerce, Ministry of Agriculture of China under Grant (AEC2018003, AEC2018006), the 2019 Anhui University collaborative innovation project (GXXT-2019-013), the Hefei Major Research Project of Key Technology (J2018G14), Natural Science Research Project of Anhui Provincial Department of Education (KJ2020A0107).
Conflicts of interest
The authors declare no conflict of interest.
Appendix
Test functions utilized in this paper.