Citation: Lucy McMullen, Steven T Leach, Daniel A Lemberg, Andrew S Day. Current roles of specific bacteria in the pathogenesis of inflammatory bowel disease[J]. AIMS Microbiology, 2015, 1(1): 82-91. doi: 10.3934/microbiol.2015.1.82
| [1] | Tru Tran, Stephanie N. Dawrs, Grant J. Norton, Ravleen Virdi, Jennifer R. Honda . Brought to you courtesy of the red, white, and blue–pigments of nontuberculous mycobacteria. AIMS Microbiology, 2020, 6(4): 434-450. doi: 10.3934/microbiol.2020026 |
| [2] | Ana M. Castañeda-Meléndrez, José A. Magaña-Lizárraga, Marcela Martínez-Valenzuela, Aldo F. Clemente-Soto, Patricia C. García-Cervantes, Francisco Delgado-Vargas, Rodolfo Bernal-Reynaga . Genomic characterization of a multidrug-resistant uropathogenic Escherichia coli and evaluation of Echeveria plant extracts as antibacterials. AIMS Microbiology, 2024, 10(1): 41-61. doi: 10.3934/microbiol.2024003 |
| [3] | Telma Sousa, Marta Costa, Pedro Sarmento, Maria Conceição Manso, Cristina Abreu, Tim J. Bull, José Cabeda, Amélia Sarmento . DNA-based detection of Mycobacterium avium subsp. paratuberculosis in domestic and municipal water from Porto (Portugal), an area of high IBD prevalence. AIMS Microbiology, 2021, 7(2): 163-174. doi: 10.3934/microbiol.2021011 |
| [4] | Helene Nalini Chinivasagam, Wiyada Estella, Damien Finn, David G. Mayer, Hugh Rodrigues, Ibrahim Diallo . Broiler farming practices using new or re-used bedding, inclusive of free-range, have no impact on Campylobacter levels, species diversity, Campylobacter community profiles and Campylobacter bacteriophages. AIMS Microbiology, 2024, 10(1): 12-40. doi: 10.3934/microbiol.2024002 |
| [5] | Amira ElBaradei, Dalia Ali Maharem, Ola Kader, Mustafa Kareem Ghareeb, Iman S. Naga . Fecal carriage of ESBL-producing Escherichia coli in Egyptian patients admitted to the Medical Research Institute hospital, Alexandria University. AIMS Microbiology, 2020, 6(4): 422-433. doi: 10.3934/microbiol.2020025 |
| [6] | Ogueri Nwaiwu, Chiugo Claret Aduba . An in silico analysis of acquired antimicrobial resistance genes in Aeromonas plasmids. AIMS Microbiology, 2020, 6(1): 75-91. doi: 10.3934/microbiol.2020005 |
| [7] | Jorge Barriuso . Quorum sensing mechanisms in fungi. AIMS Microbiology, 2015, 1(1): 37-47. doi: 10.3934/microbiol.2015.1.37 |
| [8] | Sunarno Sunarno, Nelly Puspandari, Fitriana Fitriana, Uly Alfi Nikmah, Hasta Handayani Idrus, Novaria Sari Dewi Panjaitan . Extended spectrum beta lactamase (ESBL)-producing Escherichia coli and Klebsiella pneumoniae in Indonesia and South East Asian countries: GLASS Data 2018. AIMS Microbiology, 2023, 9(2): 218-227. doi: 10.3934/microbiol.2023013 |
| [9] | Andrew S Day . The impact of exclusive enteral nutrition on the intestinal microbiota in inflammatory bowel disease. AIMS Microbiology, 2018, 4(4): 584-593. doi: 10.3934/microbiol.2018.4.584 |
| [10] | Mohammed M. M. Abdelrahem, Mohamed E. Abouelela, Nageh F. Abo-Dahab, Abdallah M. A. Hassane . Aspergillus-Penicillium co-culture: An investigation of bioagents for controlling Fusarium proliferatum-induced basal rot in onion. AIMS Microbiology, 2024, 10(4): 1024-1051. doi: 10.3934/microbiol.2024044 |
The first European offshore wind farm, Horns Rev I with a capacity of 160 MW, was built in 2002. Since then/to date several others have been added, mainly in northern European waters, bringing the total offshore capacity in Europe to around 1.3 GW [1] by 2016. The near-future expectations were even higher; WindEurope reports that between 2017–2020 the capacity will rise to 11.6 GW, reaching 24% of the future installed capacity worldwide [2].
The reasons to move to offshore sites are primarily three; (ⅰ) better wind resources [3,4] thus higher capacity factors and 75% more energy production [5] (ⅱ) less complex terrain and (ⅲ) higher public acceptance. Although, it seems like a natural choice to move offshore in wind energy invest- ments, there are also major challenges for offshore wind energy. Firstly, the foundation cost is one of the main considerations, because in order to create a feasible investment, places with a sea depth¡60m are needed [4,6,7]. In recent years, the development of floating wind turbine designs is opening the potential to overcome such depth constraints, thereby enlarging the area suitable for offshore wind farms [7,8,9]. A second major challenge is the unknown wind resources at offshore locations. Making conventional measurements at offshore locations is much more expensive compared to onshore sites. Nevertheless, the latest developments in satellite wind measurement techniques enable us to at least make a pre-investigation of the resource and find the best possible mast location before embarking on any measurement campaign [10,11,12]. Satellite derived Same datasets can also be used to validate large scale and numerical wind atlas studies [13,14].
Offshore sites are not only rich with wind but also with underground fossil fuel resources. These energy sources were investigated much earlier than wind energy and have been exploited since the 19th century [15]. The basic energy resource extraction method involves an in-situ platform, where the energy source is reached via a drilling process under the seabed. A platform is erected with an average of 40 years of structural life-time capacity. These platforms become non-feasible if the energy source is no longer sufficiently profitable to extract at the current drilling depth or when the platform reaches its end-of-life. In the first case, a possible use of such a platform is to alter the energy source from gas/oil to wind energy by simply erecting a wind turbine on the platform and produce in-situ electric energy and transfer to the land. The idea is being discussed since 1993, mostly for California offshore locations and Mexican Gulf installations of the USA where the first oil rig was decommissioned in 1996 [16]. At the time, several environmental and economic/financial studies were undertaken in order to understand if the idea was feasible, but the conclusions were negative (insert references somewhere here) due to several reasons. The main reason was the production capacity. Platforms have rather small surface areas and the separation between turbines should be at least 2 rotor diameters not to get effected from each other. As a result, one could only allocate a single turbine on each platform which was not enough to make profit from the investment at the begging of the millennium, when turbine capacities were around 2 MW. Nevertheless, in the USA, the Energy Policy Act of 2005 authorized the alternative use of existing oil and natural gas platforms for marine energy renewable projects [17]. At that time the biggest designed capacity of turbine was 4.5 MW and averaged standard turbine was 1.5MW. This step shows a general interest in using platforms for other purposes. There is no such similar act in Europe but in 2009 there was an attempt to convert several offshore rigs into wind energy platforms [18] around Scotland which shows the revival of the interest on the subject with the new generation wind turbines that can reach up to 10 MW capacity.
In this study, three new generation offshore wind turbines are used to create a scenario of converting a gas platform into an offshore wind turbine base. The results are compared in terms of Levelized Cost of Energy (LCOE) and total profit rate, based on the local feed-in-tariff. The core aim of the study is to identify the minimum turbine capacity that renders conversion of existing offshore platforms feasible and how low the Return of Investment (ROI) and LCOE can be.
In Turkey, Turkish Petroleum Cooperation* (TPAO) which is a state investment with public shareholders is focused on gas and oil investments and has license for offshore exploration and production. The company has erected 5 platforms in the last 60 years.
*In Turkish-Türkiye Petrolleri Anonim Ortaklıǧı-http://www.tpao.gov.tr
TPAO first built the North Marmara† in
†"Kuzey Marmara" in Turkish and official documentation
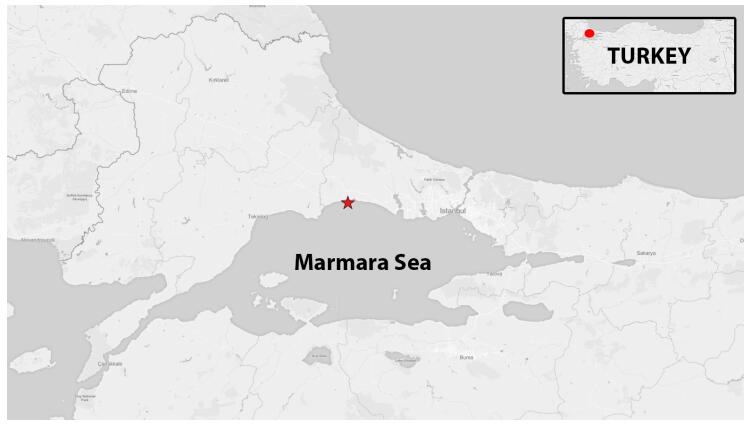 Figure 1. The location of the North Marmara gas platform at Marmara Sea across the village of Silivri.
In recent years, several institutes and companies have published their conceptual design for wind turbines with capacity equal to or bigger than 5 MW. The aim of these theoretical studies is to overcome common problems of the wind turbines due to the growing sizes. The design criteria of these, so-called "reference", turbines were determined for offshore locations, due to the three positive points mentioned in the introduction of this article thus reducing the number of challenges to deal with at the same time. The most well-known concept wind turbines are designed by 1) the National Renewable Energy Laboratories (NREL) of USA [19], 2) the FP7 funded EU project Logistic Efficiencies And Naval architecture for Wind Installations with Novel Developments LEANWIND (LW) (based on Vestas V164) [20,21] and 3) the Technical University of Denmark (DTU) of Denmark [22,23]; the design capacities are 5 MW, 8 MW and 10 MW respectively. Power and thrust curves of these turbines are publicly available and have been used in previous studies (Figure 2).
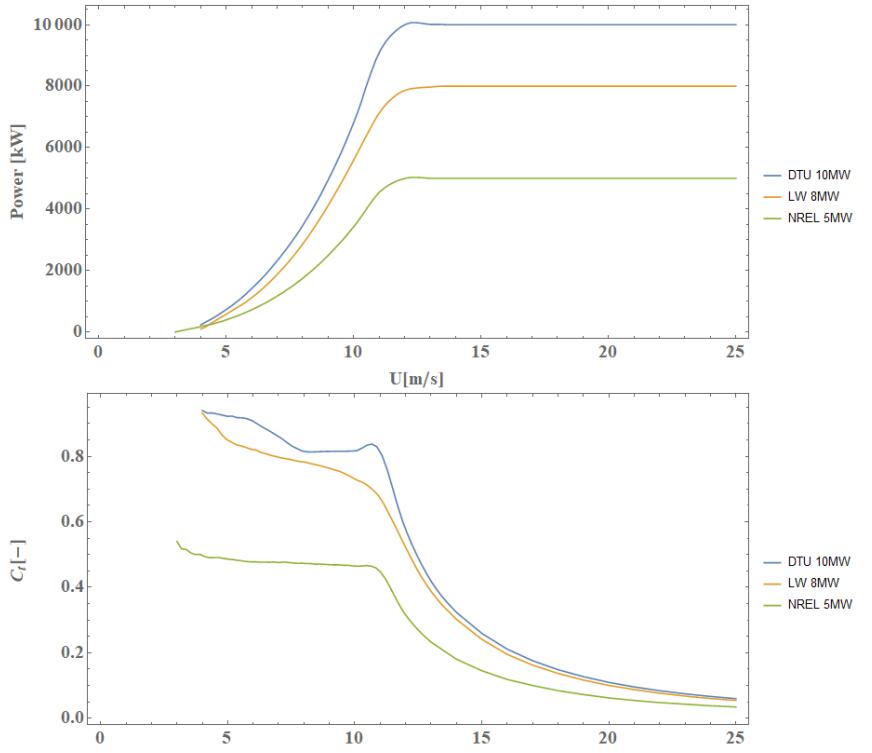 Figure 2. Power (top) and thrust coefficient (bottom) curves of 3 reference turbines; taken from [23].
| NREL | LW | DTU | |
| Rated Power [MW] | 5 | 8 | 10 |
| Rotor Diameter [m] | 126 | 164 | 178.3 |
| Hub Height [m] | 90 | 110 | 119 |
| Cut-in [m/s] | 3 | 4 | 4 |
| Cut-off [m/s] | 25 | 25 | 25 |
| Total Mass [tones] | 662 | 968 | 1198 |
 DownLoad: CSV
In-situ meteorological mast measurements are needed in any wind farm project development process. A minimum yearly dataset gives a good average of the wind energy density at the location and can be used to predict annual energy production (AEP) with industry standard applications.
At offshore locations, such as North Marmara, a mast installation costs much more than on onshore locations, therefore other available techniques are employed for initial assessment studies. If the initial studies give expectant results one can erect a mast on the location and collect data for at least 1-year. There are several options that can be used for pre-assessment wind data but the most common ones are based on remote sensing measurement instruments. In the last two decades, satellite wind measurement technologies are developed with Synaptic Aperture Radar (SAR) [24] and Scatterometer (SCAT) [25] techniques. The data is mostly open source but difficult to process and of low quality due to high uncertainty (±2 m/s). Several studies imrpoved our knowledge on offshore wind profiles [26,27,28,29]. An even newer technology, Light Detection and Ranging (LiDAR) has also showed promising signs for offshore measurements [30]. Newly designed floating lidar platforms make it possible to measure anywhere within a reasonable depth range [31]. It is also possible to use long range lidars and scan the near-shore areas from the coast up to 4 km distance [32].
It should also be stated at this point that current international wind farm development standards only require in-situ measurement with conventional mast. Therefore, the TPAO was invited to this study to give access to the platform and its structural information but the company did not show any interest in erecting a mast on the platform or participating in the study. When in-situ measurements were precluding it was also not feasible to try any other remote sensing technique which would need TPAO's consensus and partnership. Nevertheless, one other trustworthy option for wind resources, the Global Wind Atlas (GWA) version 2 was finalized in November 2017 is used in the study. In GWA the whole globe is modeled with
The North Marmara gas platform is located at
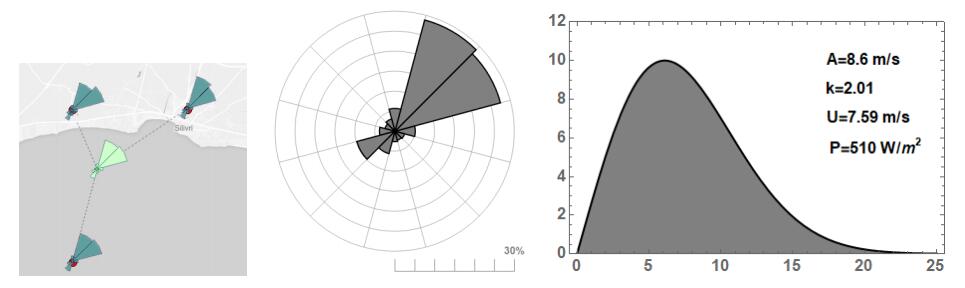 Figure 3. LEFT: Sectoral frequencies of the closest 3 nodes and MIDDLE: their interpolation to the platform location at around center of triangle, RIGHT: Weibull fit for the 100 m a.s.l. at the interpolation location.
The atlas data has been downscaled by means of the industry standard software WAsP ‡ is used. There are several other methods and commercial application for the purpose, using linear or non-linear flow model solvers. The choice has been made based on avalibility, being most exercised by the author and specially because it includes Charnock's theorem [34] which makes seperate calculations for wind over the sea.
‡WAsP Version 11.4 http://www.WAsP.dk
The application uses Wind Atlas Methodology [35] and requires elevation and roughness information of the area. The digital elevation model dataset, SRTM version 4.1§ [36], was used for the elevation information above sea level and for the coastline (Figure 4). The roughness of the surroundings is characterized by open area, short trees on the land not very close to the shoreline, and patches of forest with trees of approximately 5–12 m height at some coastline locations. There is also a village at the main wind direction of
§Available from the CGIAR-CSI SRTM 90m Database (http://srtm.csi.cgiar.org).
¶European Environment Agency (EEA), the Copernicus programme https://land.copernicus.eu/pan-european/corine-land-cover/clc-2012/view.
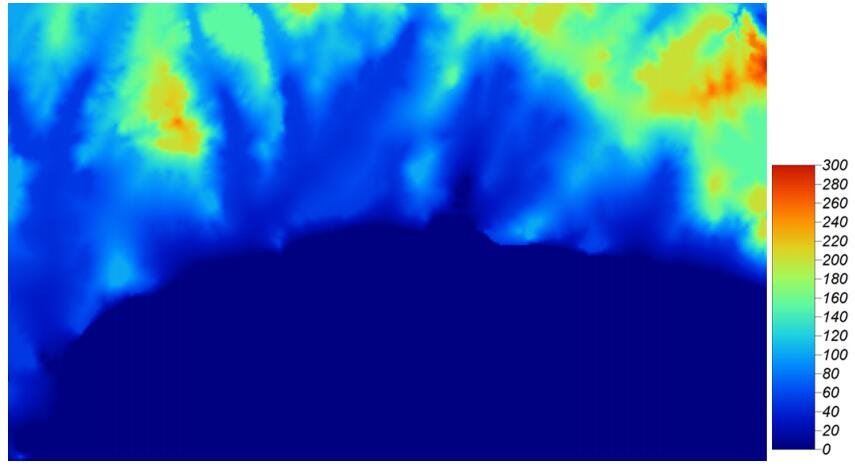 Figure 4. Elevation map of the area. Highest location a.s..l. is 300 m.
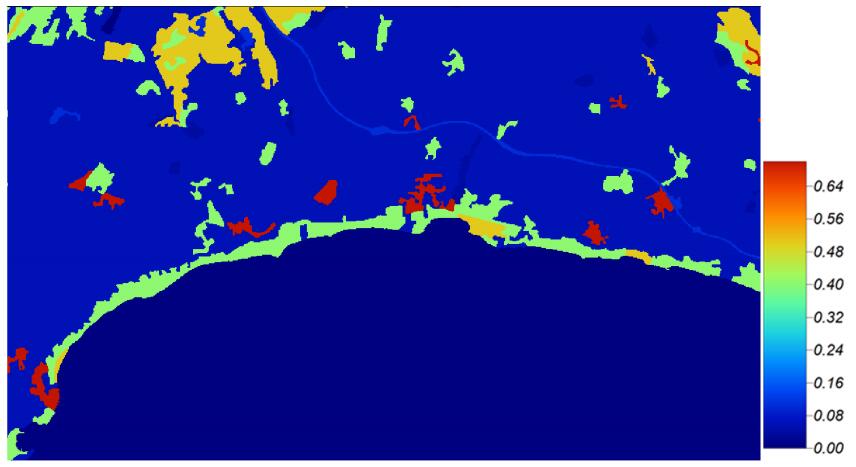 Figure 5. Roughness classes of area. Highest roughness is at a city of 0.7 m.
| Turbine | A[m/s] | k[-] | U[m/s] | P[W/km | AEP[MWh] | CF[%] |
| NREL (5MW) | 8.0 | 2.13 | 7.07 | 388 | 15010 | 34.3 |
| LW (8MW) | 8.4 | 2.14 | 7.47 | 456 | 26595 | 38.0 |
| DTU (10MW) | 8.6 | 2.15 | 7.66 | 491 | 34761 | 39.7 |
DownLoad: CSVAfter getting the AEP values, it is possible to predict the income of the power plant and the trans- mission costs. The other cost units are applied from the study of [37]. The study breaks down the cost into operational expenditure (OPEX) and capital expenditure (CAPEX) parts with linear equations as a function of the relative variable of each case (e.g. sea depth, distance to shore, installed capacity). In some cases, adjustment to local market was necessary and was applied in this study. The following assumptions and adjustments were made:
● It was assumed that the platform does not need extra structural support to bear any of the reference turbines. Thus, the cost of the turbine and its installation were kept as onshore costs in CAPEX but with additional offshore O & M in OPEX. This assumption is further discussed in the Results section.
● No substation was planned because the platform is 2 km away from the shore and the cabling can easily reach an onshore substation with minimal transportation loss.
● Standard Turkish transmission costs were applied to the cost model because the suggested European cost is significantly higher than the national prices. The cost per kWh is set yearly by the state and depends on the installed capacity and the energy production which are around €3600/MW and €0.02/kWh, respectively, for the year 2018.
● Production losses due to the maintenance and electrical array are common in any wind farm and 10% of total loss was added to the calculation at "income" item but no other losses were applied to the final cost.
The cost of an offshore wind turbine or wind farm installation are not unknown and it is well studied in Europe. Nevertheless, same conditions are not available in Turkey. There is not any offshore wind turbine in Turkey as the date of this study is published. Therefore, a latest study [37] has been chosen to be the main data source on cost in every stage of the development; only minor change has been made to the feed-in-tariff. Ebenhoch et. al uses several data sources for different items of the cost and O & M and fit these statistical data into linear function, which makes it easy to apply and derive cost based on distance to the shore, size of the turbine and depth of the sea.
When the cost model is applied to the three different cases, the 20 years OPEX costs are seen to be around 30–35% of the CAPEX cost for each turbine but the revenue increases linearly with wind turbine capacity 6). 8MW seems to be the minimum turbine capacity to make revenue from such a project as the net profit only goes positive after such installed capacity. When the ROI of each scenario is calculated, a minimum of 8 years is needed for the return of investment even with the assumption of no extra structural upgrade for the platform. Furthermore, the LCOE is very similar for the 8 MW and 10 MW scenarios (Table 3). As a last step, the AEP for each turbine had been calculated as well as the return of investment (ROI) and the capacity factors (Table 3).
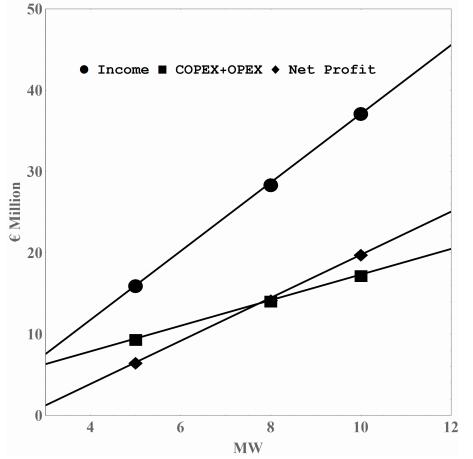 Figure 6. Life time expenditure for different size wind turbines (points) and linearized trends for each parameter.
| Turbine | NREL | LW | DTU |
| Size[MW] | 5 | 8 | 10 |
| CAPEX | |||
| Project Development | €1 076 438 | €1 076 438 | €1 076 438 |
| Turbine | €4 734 366 | €7 746 636 | €9 826 336 |
| Cables and Installation | €1 170 000 | €1 872 000 | €2 340 000 |
| TOTAL | €6 980 804 | €10 695 074 | €13 242 774 |
| OPEX (20 years) | |||
| Project Management | €1 101 072 | €1 101 072 | €1 101 072 |
| O & M | €266 250 | €347 520 | €369 000 |
| Transmission | €1 117 089 | €2 049 363 | €2 625 429 |
| TOTAL | €2 484 411 | €3 497 955 | €4 095 501 |
| PRODUCTION (20 years) | |||
| AEP [GWh] | 300.2 | 531.9 | 695.22 |
| Income | €16 075 710 | €28 483 245 | €37 229 031 |
| Capacity Factor | 34.3% | 37.9% | 39.7% |
| Net Profit | €6 610 495 | €14 290 216 | €19 890 756 |
| ROI | 10.3 years | 8.6 years | 8 years |
| LCOE [cent/kWh] | 2.20 | 2.69 | 2.86 |
DownLoad: CSVIn this study, a feasibility analysis of offshore gas platform conversion was undertaken, combining an up-to-date calculation method of energy yield assessment and a cost model adapted for local conditions. The WAsP software with digital elevation and roughness model were used, with wind characteristics of the location extracted from GWA version 2. The cost model for offshore and onshore installations developed in a previous study was adapted for the unique case of the study and altered for Turkish market where necessary. There are important points to be considered before making any conclusions. First, in this study, two important and unknown costs are present; (ⅰ) the necessary upgrade cost of the platform to make it suitable to bear/withstand the operational forces of a wind turbine of 8 MW or more (ⅱ) the financial cost due to the commercial loan. It was not possible to take these two important costs into account for the calculations because no information regarding the structural requirements of the platform was shared by the owner and it is not certain what can be the interest rate for such an investment loan in Turkey. On the other hand, the current calculation gives the figure for the best-case scenario and an indication of what should be investigated for further improvement. The combination of models gives a clear outlook of feasibility for suggested scenario and the results indicated that 8 MW or above wind turbine can create a feasible and low-cost energy investment. With a 20 MW turbine the ROI can be further lowered to 6 years (Figure 7).
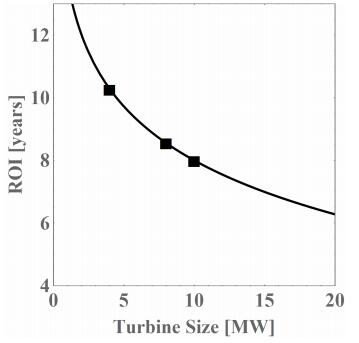 Figure 7. Logarithmic trend-line for ROI throughout the years for different turbine sizes.
Wind Atlas Data is obtained from the Global Wind Atlas 2.0, a free, web-based application developed, owned and operated by the Technical University of Denmark (DTU) in partnership with the World Bank Group, utilizing data provided by Vortex, with funding provided by the Energy Sector Management Assistance Program (ESMAP). For future information: https://globalwindatlas.info.
The author declares that there are no conflicts of interest in the paper.
| [1] |
Rigsbee L, Agans R, Shankar V, et al. (2012) Quantitative profiling of gut microbiota of children with diarrhea-predominant irritable bowel syndrome. Am J Gastroenterol 107: 1740-1751. doi: 10.1038/ajg.2012.287

|
| [2] |
Brown K, DeCoffe D, Molcan E, et al. (2012) Diet-induced dysbiosis of the intestinal microbiota and the effects on immunity and disease. Nutrients 4: 1095-1119. doi: 10.3390/nu4081095
|
| [3] |
Scaldaferri F, Pizzoferrato M, Pecere S, et al. (2012) Bacterial flora as a cause or treatment of chronic diarrhea. Gastroenterol Clin North Am 41: 581-602. doi: 10.1016/j.gtc.2012.06.002
|
| [4] |
Geier MS, Butler RN, Howarth GS (2007) Inflammatory bowel disease: current insights into pathogenesis and new therapeutic options; probiotics, prebiotics and synbiotics. Int J Food Microbiol 115: 1-11. doi: 10.1016/j.ijfoodmicro.2006.10.006
|
| [5] | Aster JC, Robbins SL, Kumar V, et al. (2013) Robbins Basic Pathology: Elsevier/Saunders. |
| [6] | Fujita H, Eishi Y, Ishige I, et al. (2002) Quantitative analysis of bacterial DNA from Mycobacteria spp., Bacteroides vulgatus, and Escherichia coli in tissue samples from patients with inflammatory bowel diseases. J Gastroenterol 37: 509-516. |
| [7] |
De Cruz P, Prideaux L, Wagner J, et al. (2012) Characterization of the gastrointestinal microbiota in health and inflammatory bowel disease. Inflamm Bowel Dis 18: 372-390. doi: 10.1002/ibd.21751
|
| [8] |
Sartor RB (2008) Microbial influences in inflammatory bowel diseases. Gastroenterology 134: 577-594. doi: 10.1053/j.gastro.2007.11.059
|
| [9] |
Eckburg PB, Relman DA (2007) The role of microbes in Crohn's disease. Clin Infect Dis 44: 256-262. doi: 10.1086/510385
|
| [10] |
Bibiloni R, Mangold M, Madsen KL (2006) The bacteriology of biopsies differs between newly diagnosed, untreated, Crohn's disease and ulcerative colitis patients. J Med Microbiol 55: 1141-1149. doi: 10.1099/jmm.0.46498-0
|
| [11] |
Darfeuille-Michaud A, Neut C, Barnich N (1998) Presence of adherent Escherichia coli strains in ileal mucosa of patients with Crohn's disease. Gastroenterology 115: 1405-1413. doi: 10.1016/S0016-5085(98)70019-8
|
| [12] |
Swidsinski A, Ladhoff A, Pernthaler A (2002) Mucosal flora in inflammatory bowel disease. Gastroenterology 122: 44-54. doi: 10.1053/gast.2002.30294
|
| [13] |
Rolhion N, Darfeuille-Michaud A (2007) Adherent-invasive Escherichia coli in inflammatory bowel disease. Inflamm Bowel Dis 13: 1277-1283. doi: 10.1002/ibd.20176
|
| [14] | Barnich N, Carvalho FA, Glasser AL, et al. (2007) CEACAM6 acts as a receptor for adherent-invasive E. coli, supporting ileal mucosa colonization in Crohn disease. J Clin Invest 117: 1566-1574. |
| [15] |
Pineton de Chambrun G, Colombel JF, Poulain D, et al. (2008) Pathogenic agents in inflammatory bowel diseases. Curr Opin Gastroenterol 24: 440-447. doi: 10.1097/MOG.0b013e3283023be5
|
| [16] |
Giaffer M, Holdsworth C, Duerden B (1992) Virulence properties of Escherichia coli starins isolated from patients with inflammatory bowel disease. Gut 33: 646-650. doi: 10.1136/gut.33.5.646
|
| [17] |
Chiba M, Komatsu M, Iizuka M, et al. (1998) Microbiology of the intestinal lymph follicle: a clue to elucidate causative microbial agent(s) in Crohn's disease. Med Hypotheses 51: 421-427. doi: 10.1016/S0306-9877(98)90039-1
|
| [18] |
Neut C, Bulois P, Desreumaux P, et al. (2002) Changes in the bacterial flora of the neoterminal ileum after ileocolonic resection for Crohn's disease. Am J Gastroenterol 97: 939-946. doi: 10.1111/j.1572-0241.2002.05613.x
|
| [19] |
Darfeuille-Michaud A, Boudeau J, Bulois P, et al. (2004) High prevalence of adherent-invasive Escherichia coli associated with ileal mucosa in Crohn's disease. Gastroenterology 127: 412-421. doi: 10.1053/j.gastro.2004.04.061
|
| [20] | Kallinowski F, Wassmer A, Hofmann MA, et al. (1998) Prevalence of enteropathogenic bacteria in surgically treated chronic inflammatory bowel disease. Hepato-Gastroenterology 45: 1552-1558. |
| [21] |
Fava F, Danese S (2011) Intestinal microbiota in inflammatory bowel disease: friend of foe? World J Gastroenterol 17: 557-566. doi: 10.3748/wjg.v17.i5.557
|
| [22] |
Abubakar I, Myhill D, Aliyu SH, et al. (2008) Detection of Mycobacterium avium subspecies paratuberculosis from patients with Crohn's disease using nucleic acid-based techniques: a systematic review and meta-analysis. Inflamm Bowel Dis 14: 401-410. doi: 10.1002/ibd.20276
|
| [23] |
Sartor RB (2005) Does Mycobacterium avium subspecies paratuberculosis cause Crohn's disease? Gut 54: 896-898. doi: 10.1136/gut.2004.055889
|
| [24] |
Behr M, Schurr E (2006) Mycobacteria in Crohn's disease: a persistent hypothesis. Inflamm Bowel Dis 12: 1000-1004. doi: 10.1097/01.mib.0000228183.70197.dd
|
| [25] |
Autschbach F, Eisold S, Hinz U, et al. (2005) High prevalence of Mycobacterium avium subspecies paratuberculosis IS900 DNA in gut tissues from individuals with Crohn's disease. Gut 54: 944-949. doi: 10.1136/gut.2004.045526
|
| [26] |
Kirkwood CD, Wagner J, Boniface K, et al. (2009) Mycobacterium avium subspecies paratuberculosis in children with early-onset Crohn's disease. Inflamm Bowel Dis 15: 1643-1655. doi: 10.1002/ibd.20967
|
| [27] |
Sechi LA, Scanu AM, Molicotti P, et al. (2005) Detection and Isolation of Mycobacterium avium subspecies paratuberculosis from intestinal mucosal biopsies of patients with and without Crohn's disease in Sardinia. Am J Gastroenterol 100: 1529-1536. doi: 10.1111/j.1572-0241.2005.41415.x
|
| [28] | Sechi LA, Gazouli M, Ikonomopoulos J, et al. (2005) Mycobacterium avium subsp. paratuberculosis, genetic susceptibility to Crohn's disease, and Sardinians: the way ahead. J Clin Microbiol 43: 5275-5277. |
| [29] |
Naser SA, Ghobrial G, Romero C (2004) Culture of Mycobacterium avium subspecies paratuberculosis from the blood of patients with Crohn's disease. Lancet 364: 1039-1044. doi: 10.1016/S0140-6736(04)17058-X
|
| [30] |
Selby W, Pavli P, Crotty B (2007) Two-year combination antibiotic therapy with clarithromycin, rifabutin and clofazimine for Crohn's disease. Gastroenterology 132: 2313-2319. doi: 10.1053/j.gastro.2007.03.031
|
| [31] |
Kuehbacher T, Rehman A, Lepage P, et al. (2008) Intestinal TM7 bacterial phylogenies in active inflammatory bowel disease. J Med Microbiol 57: 1569-1576. doi: 10.1099/jmm.0.47719-0
|
| [32] |
Brinig MM, Lepp PW, Ouverney CC, et al. (2003) Prevalence of bacteria of division TM7 in human subgingival plaque and their association with disease. Appl Environ Microbiol 69: 1687-1694. doi: 10.1128/AEM.69.3.1687-1694.2003
|
| [33] |
Kumar PS, Griffen AL, Barton JA, et al. (2003) New bacterial species associated with chronic periodontitis. J Dental Res 82: 338-344. doi: 10.1177/154405910308200503
|
| [34] |
Ouverney CC, Armitage GC, Relman DA (2003) Single-cell enumeration of an uncultivated TM7 subgroup in the human subgingival crevice. Appl Environ Microbiol 69: 6294-6298. doi: 10.1128/AEM.69.10.6294-6298.2003
|
| [35] | Newman A, Lambert J (1980) Campylobacter jejuni causing flare-up in inflammatoty bowel disease. Lancet 2: 919-919. |
| [36] | Zhang L, Man SM, Day AS, et al. (2009) Detection and isolation of Campylobacter species other than C. jejuni from children with Crohn's disease. J Clin Microbiol 47: 453-455. |
| [37] |
Man SM, Zhang L, Day AS, et al. (2010) Campylobacter concisus and other Campylobacter species in children with newly diagnosed Crohn's disease. Inflamm Bowel Dis 16: 1008-1016. doi: 10.1002/ibd.21157
|
| [38] |
Mukhopadhya I, Thomson JM, Hansen R, et al. (2011) Detection of Campylobacter concisus and other Campylobacter species in colonic biopsies from adults with ulcerative colitis. PLoS One 6: e21490. doi: 10.1371/journal.pone.0021490
|
| [39] |
Deshpande NP, Kaakoush NO, Mitchell H, et al. (2011) Sequencing and validation of the genome of a Campylobacter concisus reveals intra-species diversity. PLoS One 6: e22170. doi: 10.1371/journal.pone.0022170
|
| [40] |
Kovach Z, Kaakoush NO, Lamb S, et al. (2011) Immunoreactive proteins of Campylobacter concisus, an emergent intestinal pathogen. FEMS Immunol Med Microbiol 63: 387-396. doi: 10.1111/j.1574-695X.2011.00864.x
|
| [41] |
Man SM (2011) The clinical importance of emerging Campylobacter species. Nat Rev Gastroenterol Hepatol 8: 669-685. doi: 10.1038/nrgastro.2011.191
|
| [42] |
Setoyama H, Imaoka A, Ishikawa H, et al. (2003) Prevention of gut inflammation by Bifidobacterium in dextran sulfate-treated gnotobiotic mice associated with Bacteroides strains isolated from ulcerative colitis patients. Microb Infect 5: 115-122. doi: 10.1016/S1286-4579(02)00080-1
|
| [43] | Onderdonk BW (2000) Intestinal microflora and inflammatory bowel disease; Krisner JB, editor. Philadelphia, USA: Saunders. |
| [44] |
Rath HC, Herfath HH, Ikeda JS, et al. (1996) Normal luminal bacteria, especially Bacteroides species, mediate chronic colitis, gastritis, and arthritis in HLA-B27/human β2 microglobulin transgenic rats. J Clin Invest 98: 945-953. doi: 10.1172/JCI118878
|
| [45] |
Lamps LW, Madhusudhan KT, Havens JM, et al. (2003) Pathogenic Yersinia DNA is detected in bowel and mesenteric lymph nodes from patients with Crohn's disease. Am J Surg Pathol 27: 220-227. doi: 10.1097/00000478-200302000-00011
|
| [46] |
Saebo A, Vik E, Lange OJ, et al. (2005) Inflammatory bowel disease associated with Yersinia enterocolitica O:3 infection. Eur J Inter Med 16: 176-182. doi: 10.1016/j.ejim.2004.11.008
|
| [47] |
Knosel T, Schewe C, Petersen N, et al. (2009) Prevalence of infectious pathogens in Crohn's disease. Pathol Res Pract 205: 223-230. doi: 10.1016/j.prp.2008.04.018
|
| [48] |
Farrell RJ, LaMont JT (2002) Microbial factors in inflammatory bowel disease. Gastroenterol Clin North Am 31: 41-62. doi: 10.1016/S0889-8553(01)00004-8
|
| [49] |
Liu Y, Van Kruinigen HJ, West AB, et al. (1995) Immunocytochemical evidence of Listeria, Eschericha coli, and Streptococcus antigen in Crohn's disease. Gastroenterology 108: 1396-1404. doi: 10.1016/0016-5085(95)90687-8
|
| [50] |
Chen W, Dong L, Paulus B, et al. (2000) Detection of Listeria monocytogenes by polymerase chain reaction in intestinal mucosal biopsies from patients with inflammatory bowel disease and controls. J Gastroenterol Hepatol 15: 1145-1150. doi: 10.1046/j.1440-1746.2000.02331.x
|
| [51] |
Chow J, Tang H, Mazmanian SK (2011) Pathobionts of the gastrointestinal microbiota and inflammatory disease. Curr Opin Immunol 23: 473-480. doi: 10.1016/j.coi.2011.07.010
|
| [52] | Cahill RJ, Foltz CJ, Fox JG, et al. (1997) Inflammatory bowel disease: An immunity-mediated condition triggered by bacterial infection with Helicobacter hepaticus.Infect Immun 65: 3126-3131. |
| [53] | Chin EY, Dangler CA, Fox JG, et al. (2000) Helicobacter hepaticus infection triggers inflammatory bowel disease in T cell receptor alpha/beta mutant mice. Compar Med 50: 586-594. |
| [54] |
Dieleman LA, Arends A, Tonkonogy SL (2000) Helicobacter hepaticus does not induce or potentiate colitis in interleukin-10-deficient mice. Infect Immun 68: 5107-5113. doi: 10.1128/IAI.68.9.5107-5113.2000
|
| [55] | Calza L, Manfredi R, Chiodo F (2003) Stenotrophomonas (Xanthomas) maltophilia as an emerging oppurtunistic pathogen in association with HIV infection: a 10-year surveillance study. Infection: 155-161. |
| [56] | Denton M, Kerr KG (1998) Microbilogical and clinical aspects of infection associated with Stenotrophomonas maltophilia. Clin Microbiol Rev: 57-80. |
| [57] |
Thompson-Chagoyan OC, Maldonado J, Gil A (2005) Aetiology of inflammatory bowel disease (IBD): role of intestinal microbiota and gut-associated lymphoid tissue immune response. Clin Nutr 24: 339-352. doi: 10.1016/j.clnu.2005.02.009
|
| 1. | Maria Conceição A. Leite, Nikola P. Petrov, Ensheng Weng, Stationary distributions of semistochastic processes with disturbances at random times and with random severity, 2012, 13, 14681218, 497, 10.1016/j.nonrwa.2011.02.025 | |
| 2. | Spiros Dimou, Antonis Economou, Demetrios Fakinos, The single server vacation queueing model with geometric abandonments, 2011, 141, 03783758, 2863, 10.1016/j.jspi.2011.03.010 | |
| 3. | Antonis Economou, Stella Kapodistria, Synchronized abandonments in a single server unreliable queue, 2010, 203, 03772217, 143, 10.1016/j.ejor.2009.07.014 | |
| 4. | B Goncalves, T Huillet, A generating function approach to Markov chains undergoing binomial catastrophes, 2021, 2021, 1742-5468, 033402, 10.1088/1742-5468/abdfcb | |
| 5. | Jesús R. Artalejo, 2011, Chapter 26, 978-3-642-20852-2, 379, 10.1007/978-3-642-20853-9_26 | |
| 6. | Spiros Dimou, Antonis Economou, The Single Server Queue with Catastrophes and Geometric Reneging, 2013, 15, 1387-5841, 595, 10.1007/s11009-011-9271-6 | |
| 7. | Nitin Kumar, U. C. Gupta, A Renewal Generated Geometric Catastrophe Model with Discrete-Time Markovian Arrival Process, 2020, 22, 1387-5841, 1293, 10.1007/s11009-019-09768-8 | |
| 8. | Stella Kapodistria, Tuan Phung-Duc, Jacques Resing, LINEAR BIRTH/IMMIGRATION-DEATH PROCESS WITH BINOMIAL CATASTROPHES, 2016, 30, 0269-9648, 79, 10.1017/S0269964815000297 | |
| 9. | Carlo Lancia, Gianluca Guadagni, Sokol Ndreca, Benedetto Scoppola, Asymptotics for the late arrivals problem, 2018, 88, 1432-2994, 475, 10.1007/s00186-018-0643-3 | |
| 10. | Nitin Kumar, U. C. Gupta, Analysis of a population model with batch Markovian arrivals influenced by Markov arrival geometric catastrophes, 2019, 0361-0926, 1, 10.1080/03610926.2019.1682166 | |
| 11. | Antonis Economou, Demetris Fakinos, Alternative Approaches for the Transient Analysis of Markov Chains with Catastrophes, 2008, 2, 1559-8608, 183, 10.1080/15598608.2008.10411870 | |
| 12. | Valdivino Vargas Junior, Fábio Prates Machado, Alejandro Roldán-Correa, Dispersion as a Survival Strategy, 2016, 164, 0022-4715, 937, 10.1007/s10955-016-1571-3 | |
| 13. | Tao Jiang, Baogui Xin, Baoxian Chang, Liwei Liu, Analysis of a queueing system in random environment with an unreliable server and geometric abandonments, 2018, 52, 0399-0559, 903, 10.1051/ro/2018021 | |
| 14. | Ivo Adan, Antonis Economou, Stella Kapodistria, Synchronized reneging in queueing systems with vacations, 2009, 62, 0257-0130, 1, 10.1007/s11134-009-9112-2 | |
| 15. | J.R. Artalejo, A. Economou, M.J. Lopez-Herrero, On the number of recovered individuals in the SIS and SIR stochastic epidemic models, 2010, 228, 00255564, 45, 10.1016/j.mbs.2010.08.006 | |
| 16. | J. R. Artalejo, A. Economou, M. J. Lopez-Herrero, Stochastic epidemic models revisited: analysis of some continuous performance measures, 2012, 6, 1751-3758, 189, 10.1080/17513758.2011.552737 | |
| 17. | J.R. Artalejo, M.J. Lopez-Herrero, Quasi-stationary and ratio of expectations distributions: A comparative study, 2010, 266, 00225193, 264, 10.1016/j.jtbi.2010.06.030 | |
| 18. | Antonis Economou, Stella Kapodistria, Jacques Resing, The Single Server Queue with Synchronized Services, 2010, 26, 1532-6349, 617, 10.1080/15326349.2010.519670 | |
| 19. | Stella Kapodistria, The M/M/1 queue with synchronized abandonments, 2011, 68, 0257-0130, 79, 10.1007/s11134-011-9219-0 | |
| 20. | Nitin Kumar, U. C. Gupta, Analysis of batch Bernoulli process subject to discrete-time renewal generated binomial catastrophes, 2020, 287, 0254-5330, 257, 10.1007/s10479-019-03410-z | |
| 21. | Fábio P. Machado, Alejandro Roldán-Correa, Valdivino V. Junior, Colonization and Collapse on Homogeneous Trees, 2018, 173, 0022-4715, 1386, 10.1007/s10955-018-2161-3 | |
| 22. | Antonis Economou, Stella Kapodistria, q-SERIES IN MARKOV CHAINS WITH BINOMIAL TRANSITIONS, 2009, 23, 0269-9648, 75, 10.1017/S0269964809000084 | |
| 23. | F. P. Barbhuiya, Nitin Kumar, U. C. Gupta, Batch Renewal Arrival Process Subject to Geometric Catastrophes, 2019, 21, 1387-5841, 69, 10.1007/s11009-018-9643-2 | |
| 24. | Valdivino Vargas Junior, Fábio Prates Machado, Alejandro Roldán-Correa, Evaluating Dispersion Strategies in Growth Models Subject to Geometric Catastrophes, 2021, 183, 0022-4715, 10.1007/s10955-021-02759-5 | |
| 25. | Branda Goncalves, Thiery E. Huillet, Keeping random walks safe from extinction and overpopulation in the presence of life-taking disasters, 2022, 29, 0889-8480, 128, 10.1080/08898480.2021.1976476 | |
| 26. | Luiz Renato Fontes, Rinaldo B. Schinazi, Metastability of a random walk with catastrophes, 2019, 24, 1083-589X, 10.1214/19-ECP275 | |
| 27. | Iddo Ben-Ari, Alexander Roitershtein, Rinaldo B. Schinazi, A random walk with catastrophes, 2019, 24, 1083-6489, 10.1214/19-EJP282 | |
| 28. | Nitin Kumar, Umesh Chandra Gupta, Markovian Arrival Process Subject to Renewal Generated Binomial Catastrophes, 2022, 24, 1387-5841, 2287, 10.1007/s11009-022-09929-2 | |
| 29. | Valdivino Vargas Junior, Fábio Prates Machado, Alejandro Roldán-Correa, Extinction time in growth models subject to geometric catastrophes, 2023, 2023, 1742-5468, 043501, 10.1088/1742-5468/acc72e | |
| 30. | Costantino Di Bello, Aleksei V Chechkin, Alexander K Hartmann, Zbigniew Palmowski, Ralf Metzler, Time-dependent probability density function for partial resetting dynamics, 2023, 25, 1367-2630, 082002, 10.1088/1367-2630/aced1d | |
| 31. | Nitin Kumar, A population model with Markovian arrival process and binomial correlated catastrophes, 2023, 0361-0926, 1, 10.1080/03610926.2023.2261059 | |
| 32. | F Duque, V V Junior, F P Machado, A Roldán-Correa, Extinction time in growth models subject to binomial catastrophes * , 2023, 2023, 1742-5468, 103501, 10.1088/1742-5468/acf8bc | |
| 33. | Antonio Di Crescenzo, Antonella Iuliano, Verdiana Mustaro, Gabriella Verasani, On the Telegraph Process Driven by Geometric Counting Process with Poisson-Based Resetting, 2023, 190, 1572-9613, 10.1007/s10955-023-03189-1 | |
| 34. | Nitin Kumar, F. P. Barbhuiya, Transient behavior of a discrete-time renewal population growth model subject to geometric catastrophes, 2024, 0, 1547-5816, 0, 10.3934/jimo.2024012 | |
| 35. | Nitin Kumar, Analysis of a renewal arrival process subject to geometric catastrophe with random batch killing, 2024, 58, 0399-0559, 933, 10.1051/ro/2023171 | |
| 36. | Thierry E. Huillet, On the Balance between Emigration and Immigration as Random Walks on Non-Negative Integers, 2024, 12, 2227-7390, 3198, 10.3390/math12203198 | |
| 37. | A. Logachov, O. Logachova, A. Yambartsev, Processes with catastrophes: Large deviation point of view, 2024, 176, 03044149, 104447, 10.1016/j.spa.2024.104447 |

Lucy McMullen, Steven T Leach, Daniel A Lemberg, Andrew S Day. Current roles of specific bacteria in the pathogenesis of inflammatory bowel disease[J]. AIMS Microbiology, 2015, 1(1): 82-91. doi: 10.3934/microbiol.2015.1.82

| Turbine | A[m/s] | k[-] | U[m/s] | P[W/km | AEP[MWh] | CF[%] |
| NREL (5MW) | 8.0 | 2.13 | 7.07 | 388 | 15010 | 34.3 |
| LW (8MW) | 8.4 | 2.14 | 7.47 | 456 | 26595 | 38.0 |
| DTU (10MW) | 8.6 | 2.15 | 7.66 | 491 | 34761 | 39.7 |
DownLoad: CSV| Turbine | NREL | LW | DTU |
| Size[MW] | 5 | 8 | 10 |
| CAPEX | |||
| Project Development | €1 076 438 | €1 076 438 | €1 076 438 |
| Turbine | €4 734 366 | €7 746 636 | €9 826 336 |
| Cables and Installation | €1 170 000 | €1 872 000 | €2 340 000 |
| TOTAL | €6 980 804 | €10 695 074 | €13 242 774 |
| OPEX (20 years) | |||
| Project Management | €1 101 072 | €1 101 072 | €1 101 072 |
| O & M | €266 250 | €347 520 | €369 000 |
| Transmission | €1 117 089 | €2 049 363 | €2 625 429 |
| TOTAL | €2 484 411 | €3 497 955 | €4 095 501 |
| PRODUCTION (20 years) | |||
| AEP [GWh] | 300.2 | 531.9 | 695.22 |
| Income | €16 075 710 | €28 483 245 | €37 229 031 |
| Capacity Factor | 34.3% | 37.9% | 39.7% |
| Net Profit | €6 610 495 | €14 290 216 | €19 890 756 |
| ROI | 10.3 years | 8.6 years | 8 years |
| LCOE [cent/kWh] | 2.20 | 2.69 | 2.86 |
DownLoad: CSV| NREL | LW | DTU | |
| Rated Power [MW] | 5 | 8 | 10 |
| Rotor Diameter [m] | 126 | 164 | 178.3 |
| Hub Height [m] | 90 | 110 | 119 |
| Cut-in [m/s] | 3 | 4 | 4 |
| Cut-off [m/s] | 25 | 25 | 25 |
| Total Mass [tones] | 662 | 968 | 1198 |
| Turbine | A[m/s] | k[-] | U[m/s] | P[W/km | AEP[MWh] | CF[%] |
| NREL (5MW) | 8.0 | 2.13 | 7.07 | 388 | 15010 | 34.3 |
| LW (8MW) | 8.4 | 2.14 | 7.47 | 456 | 26595 | 38.0 |
| DTU (10MW) | 8.6 | 2.15 | 7.66 | 491 | 34761 | 39.7 |
| Turbine | NREL | LW | DTU |
| Size[MW] | 5 | 8 | 10 |
| CAPEX | |||
| Project Development | €1 076 438 | €1 076 438 | €1 076 438 |
| Turbine | €4 734 366 | €7 746 636 | €9 826 336 |
| Cables and Installation | €1 170 000 | €1 872 000 | €2 340 000 |
| TOTAL | €6 980 804 | €10 695 074 | €13 242 774 |
| OPEX (20 years) | |||
| Project Management | €1 101 072 | €1 101 072 | €1 101 072 |
| O & M | €266 250 | €347 520 | €369 000 |
| Transmission | €1 117 089 | €2 049 363 | €2 625 429 |
| TOTAL | €2 484 411 | €3 497 955 | €4 095 501 |
| PRODUCTION (20 years) | |||
| AEP [GWh] | 300.2 | 531.9 | 695.22 |
| Income | €16 075 710 | €28 483 245 | €37 229 031 |
| Capacity Factor | 34.3% | 37.9% | 39.7% |
| Net Profit | €6 610 495 | €14 290 216 | €19 890 756 |
| ROI | 10.3 years | 8.6 years | 8 years |
| LCOE [cent/kWh] | 2.20 | 2.69 | 2.86 |


