
Citation: Yohei Matsunaga, Tsuyoshi Kawano. The C. elegans insulin-like peptides (ILPs)[J]. AIMS Biophysics, 2018, 5(4): 217-230. doi: 10.3934/biophy.2018.4.217
[1] | Tongmeng Jiang, Pan Jin, Guoxiu Huang, Shi-Cheng Li . The function of guanylate binding protein 3 (GBP3) in human cancers by pan-cancer bioinformatics. Mathematical Biosciences and Engineering, 2023, 20(5): 9511-9529. doi: 10.3934/mbe.2023418 |
[2] | Xiaoyu Hou, Baoshan Ma, Ming Liu, Yuxuan Zhao, Bingjie Chai, Jianqiao Pan, Pengcheng Wang, Di Li, Shuxin Liu, Fengju Song . The transcriptional risk scores for kidney renal clear cell carcinoma using XGBoost and multiple omics data. Mathematical Biosciences and Engineering, 2023, 20(7): 11676-11687. doi: 10.3934/mbe.2023519 |
[3] | Yong Luo, Xiaopeng Liu, Jingbo Lin, Weide Zhong, Qingbiao Chen . Development and validation of novel inflammatory response-related gene signature to predict prostate cancer recurrence and response to immune checkpoint therapy. Mathematical Biosciences and Engineering, 2022, 19(11): 11345-11366. doi: 10.3934/mbe.2022528 |
[4] | Sufang Wu, Hua He, Jingjing Huang, Shiyao Jiang, Xiyun Deng, Jun Huang, Yuanbing Chen, Yiqun Jiang . FMR1 is identified as an immune-related novel prognostic biomarker for renal clear cell carcinoma: A bioinformatics analysis of TAZ/YAP. Mathematical Biosciences and Engineering, 2022, 19(9): 9295-9320. doi: 10.3934/mbe.2022432 |
[5] | Yujia Xi, Liying Song, Shuang Wang, Haonan Zhou, Jieying Ren, Ran Zhang, Feifan Fu, Qian Yang, Guosheng Duan, Jingqi Wang . Identification of basement membrane-related prognostic signature for predicting prognosis, immune response and potential drug prediction in papillary renal cell carcinoma. Mathematical Biosciences and Engineering, 2023, 20(6): 10694-10724. doi: 10.3934/mbe.2023474 |
[6] | Yutao Wang, Qian Shao, Shuying Luo, Randi Fu . Development of a nomograph integrating radiomics and deep features based on MRI to predict the prognosis of high grade Gliomas. Mathematical Biosciences and Engineering, 2021, 18(6): 8084-8095. doi: 10.3934/mbe.2021401 |
[7] | Yan He, Nannan Cao, Yanan Tian, Xuelin Wang, Qiaohong Xiao, Xiaojuan Tang, Jiaolong Huang, Tingting Zhu, Chunhui Hu, Ying Zhang, Jie Deng, Han Yu, Peng Duan . Development and validation of two redox-related genes associated with prognosis and immune microenvironment in endometrial carcinoma. Mathematical Biosciences and Engineering, 2023, 20(6): 10339-10357. doi: 10.3934/mbe.2023453 |
[8] | Peiyuan Li, Gangjie Qiao, Jian Lu, Wenbin Ji, Chao Gao, Feng Qi . PVT1 is a prognostic marker associated with immune invasion of bladder urothelial carcinoma. Mathematical Biosciences and Engineering, 2022, 19(1): 169-190. doi: 10.3934/mbe.2022009 |
[9] | Jianpei Hu, Zengnan Mo . Dissection of tumor antigens and immune landscape in clear cell renal cell carcinoma: Preconditions for development and precision medicine of mRNA vaccine. Mathematical Biosciences and Engineering, 2023, 20(2): 2157-2182. doi: 10.3934/mbe.2023100 |
[10] | Alex Viguerie, Sangita Swapnasrita, Alessandro Veneziani, Aurélie Carlier . A multi-domain shear-stress dependent diffusive model of cell transport-aided dialysis: analysis and simulation. Mathematical Biosciences and Engineering, 2021, 18(6): 8188-8200. doi: 10.3934/mbe.2021406 |
Renal cell carcinoma (RCC) is a genitourinary type of carcinoma, accounting for more than 2% of cancer-associated deaths worldwide [1,2]. KIRC is the most common subtype of RCC [3]. Presently, surgical resection is the major therapy of KIRC patients, after which patients with KIRC still have a quite large risk of cancer recurrence and metastasis [4]. In fact, more than 30% of patients who are diagnosed with KIRC experience metastasis, leading to a poor five-year survival rate [5]. It is commonly recognized that the patients with metastatic KIRC have a very dismal prognosis mainly due to the failure of early diagnosis and resistance to chemoradiotherapy [6]. it is urgently needed to find sensitive and reliable biomarkers for individualized prediction of KIRC patients.
Previous studies have reported that specific molecules could serve as survival-associated KIRC hallmarks. For example, Chen et al. suggested that a 3-mRNA predictor was proved to be a useful model for prognostic evaluation and could improve personalized management of KIRC patients [7]. Guan et al. identified a biomarker in KIRC based on miRNA-seq and digital gene expression-seq data [8]. A study revealed the prognostic value of a long non-coding RNA signature in localized clear cell renal cell carcinoma [9]. A previous research reported that fibroblast activation protein predicted prognosis in KIRC [10]. In the process of exploring prognostic markers of cancer, accumulating studies reported that epigenetic modification could affect key cancer-related genes, which implied its significant role in carcinogenesis. For instance, a study suggested that epigenetic therapeutics served as a new weapon in the war against cancer [11]. A previous research revealed their study in the cancer epigenome for therapy [12]. A research reported the interacting cancer machineries: cell signaling, lipid metabolism, and epigenetics [13]. Presently, DNA methylation is significantly involved in epigenetic regulatory mechanism which is intensively studied. Alters in DNA methylation may impact gene expression and interplay with numerous feedback mechanisms [14]. Thus, DNA methylation is a key factor for cancer development and various studies has suggested that DNA methylation may function as a predictor for diagnosis and prognosis of cancer. For instance, Brock et al. revealed DNA methylation markers in stage I lung cancer [15]. Shen et al. suggested that seven-DNA methylation CpG-based prognostic signature coupled with gene expression may predict survival of oral squamous cell carcinoma [16]. Gündert et al. indicated that genome-wide DNA methylation analysis revealed a prognostic classifier for non-metastatic colorectal cancer [17]. It has been reported that DNA methylation profiling is highly accurate and reproducible even using small specimens and poor quality material [18]. Therefore, the analysis of DNA methylation is promising to uncover novel biomarkers for predicting prognosis of cancer. However, few studies have explored the ability of DNA methylation for prognostic prediction in patients with KIRC. It's very promising to build a methylomics-related signature for predicting prognosis of KIRC.
In present study, an integrative analysis was carried out for the prediction of KIRC patients' prognosis and a 9 DNA methylation signature-based classifier was developed using univariate, LASSO, and multivariate Cox regression model. Next, we used Kaplan-Meier analysis, ROC analysis to assess and validate the prediction accuracy of the classifier in internal validation set, external validation set and entire TCGA set. In addition, a high prognostic predicted power of our nomogram was proved based on the training set and internal validation set.
The KIRC DNA methylation information and relevant clinical information was downloaded from TCGA database by using R TCGAbiolinks package [19]. The KIRC DNA methylation data was measured by using Illumina Infinium HumanMethylation450 BeadChip (450 k) arrays based on the manufacturer's instructions. E-MTAB-3274 was retrieved from ArrayExpress database using ArrayExpress package [20]. The DNA methylation levels were set as β values, computed as M / (M + U + 100), with U standing for an unmethylated signal and M standing for a methylated signal. After removing the patients without survival data, the remaining 282 patients with complete DNA methylation data and clinical information were used for constructing prognostic model. The 282 patients were grouped into a training group (70%, n = 198 samples) to identify a prognostic classifier and an internal validation group (30%, n = 84) to validate the predictive performance of the classifier. On the other hand, the 102 KIRC patients of E-MTAB-3274 from ArrayExpress database were employed as an external validation dataset. LASSO COX regression analysis was employed to further determine the candidate methylation sites involved in KIRC patients' RFS. In addition, LASSO analysis was executed by using 1000 iterations on the basis of a publicly available R package "glmnet" [21].
Pre-processing of the raw data was implemented for the determination of a prognostic classifier of KIRC. First of all, Raw methylation data was filtered for selecting the probes in at least one sample. After that, the normalization of the data was executed with "betaqn" function of wateRmelon package [22]. Subsequently, the total KIRC samples were divided into two cohorts (recurrence and no recurrence cohort) in accordance to recurrence status. The standardized beta was transformed to M value on the basis of the formulation: M = log (β/(1-β)). M value was applied for the elimination of the variance which resulted from multiple probes. Finally, M value was exploited for the determination of the differentially expressed methylation sites between recurrence and no recurrence cluster according to "dmpFinder" function of minfi package [23].
In the training set, the differentially expressed methylation sites were analyzed by a univariate Cox proportional hazards regression analysis to screen the promising sites that were importantly associated with RFS of KIRC patients. Then, those sites with p-values < 0.05 in the univariate Cox proportional hazards regression model were used for the LASSO Cox regression analysis to extract candidate sites tightly related to KIRC patients' RFS. Finally, the multivariate Cox regression analysis was performed by the candidate sites for selecting the methylome-based predictor of KIRC patients' RFS. As a result, 9 DNA methylation sites were employed to develop the methylation-based prognostic predictor. Then a risk-score model was constructed by using the 9-DNA methylation signature to compute risk scores of all of the KIRC patients. According to this risk score tool, we separated patients into high and low-risk groups by using a cutoff risk score of the median risk score. We conducted ROC analysis to assess the power of the 9-DNA methylation signature. AUC value was calculated in ROC analysis to weigh the predicted accuracy of methylome-based predictor for KIRC patients' RFS with the "survivalROC" package [24], the larger of the AUC value, the better for the predicted accuracy of the signature. Kaplan–Meier survival was exploited to compare differences in RFS between high- and low-risk clusters and Kaplan–Meier curves were obtained across the "survival" package [25].
Single sample gene sets enrichment analysis (ssGSEA) was conducted based on TCGA KIRC mRNA dataset with GSVA package [26] to assess the 9-DNA methylation signature-relevant signaling pathways. The most important pathway positively correlated with risk score was measured. According to this risk score model, we separated patients into high and low-risk groups by using a cutoff risk score of the median risk score. A p value of < 0.05 was considered as statistically significant.
The univariate and multivariate Cox proportional hazard analysis were conducted via the methylation risk score and other clinic-related variables. Cox proportional hazard models was exploited to measure hazard ratios (HR) and corresponding 95% confidence interval (CI) of variables. Factors that were significant (P < 0.05) from the multivariate Cox proportional hazard analysis were applied for constructing a nomogram by using the 'rms' R package. The prognostic nomogram was developed in TCGA-KIRC dataset for predicting 1, 3, 5-year's RFS of KIRC patients, respectively. C-index, ROC and calibration plot and decision curve analysis (DCA) were applied to evaluate prognostic nomogram performance. The results of the nomogram were presented in the calibrate curve, and the 45° line refers to the ideal prediction.
Totally, 282 TCGA patients and 102 ArrayExpress database patients who were clinically and pathologically diagnosed as KIRC were included in this study. A flow chart of the study procedure was developed to summarize our study (Figure 1). The clinical feature of KIRC patients from TCGA dataset and ArrayExpress dataset was summarized in Table 1.
Characteristics | Total (n=282) | Training dataset (n=198) | Testing dataset (n=84) |
Gender | |||
FEMALE | 104(36.88) | 73(36.87) | 31(36.9) |
MALE | 178(63.12) | 125(63.13) | 53(63.1) |
Age | |||
≤ 60 | 132(46.81) | 94(47.47) | 38(45.24) |
> 60 | 150(53.19) | 104(52.53) | 46(54.76) |
Stage | |||
Stage I | 147(52.13) | 101(51.01) | 46(54.76) |
Stage II | 29(10.28) | 19(9.6) | 10(11.9) |
Stage III | 68(24.11) | 53(26.77) | 15(17.86) |
Stage IV | 36(12.77) | 23(11.62) | 13(15.48) |
Not Available | 2(0.71) | 2(1.01) | |
M | |||
M0 | 238(84.4) | 168(84.85) | 70(83.33) |
M1 | 34(12.06) | 22(11.11) | 12(14.29) |
Not Available | 10(3.55) | 8(4.04) | 2(2.38) |
T | |||
T1 | 149(52.84) | 101(51.01) | 48(57.14) |
T2 | 37(13.12) | 24(12.12) | 13(15.47) |
T3 | 93(32.98) | 71(35.86) | 22(26.19) |
T4 | 3(1.06) | 2(1.01) | 1(1.19) |
N | |||
N0 | 119(42.2) | 85(42.93) | 34(40.48) |
N1 | 8(2.84) | 6(3.03) | 2(2.38) |
Not Available | 155(54.96) | 107(54.04) | 48(57.14) |
Grade | |||
G1 | 8(2.84) | 7(3.54) | 1(1.19) |
G2 | 122(43.26) | 85(42.93) | 37(44.05) |
G3 | 110(39.01) | 80(40.4) | 30(35.71) |
G4 | 38(13.48) | 23(11.62) | 15(17.86) |
Not Available | 4(1.42) | 3(1.52) | 1(1.19) |
Cancer_Status | |||
TUMOR FREE | 201(71.28) | 144(72.73) | 57(67.86) |
WITH TUMOR | 59(20.92) | 38(19.19) | 21(25) |
Not Available | 22(7.80) | 16(8.08) | 6(7.14) |
Laterality | |||
Bilateral | 1(0.35) | 1(0.51) | |
Left | 130(46.1) | 92(46.46) | 38(45.24) |
Right | 151(53.55) | 105(53.03) | 46(54.76) |
Hemoglobin_result | |||
Elevated | 4(1.42) | 2(1.01) | 2(2.38) |
Low | 132(46.81) | 86(43.43) | 46(54.76) |
Normal | 102(36.17) | 75(37.88) | 27(32.14) |
Not Available | 44(16.60) | 35(17.68) | 9(10.71) |
Platelet_qualitative_result | |||
Elevated | 14(4.96) | 10(5.05) | 4(4.76) |
Low | 30(10.64) | 24(12.12) | 6(7.14) |
Normal | 189(67.02) | 125(63.13) | 64(76.19) |
Not Available | 49(17.38) | 39(19.7) | 10(11.9) |
Serum_calcium_result | |||
Elevated | 4(1.42) | 2(1.01) | 2(2.38) |
Low | 100(35.46) | 65(32.83) | 35(41.67) |
Normal | 79(28.01) | 60(30.3) | 19(22.62) |
Not Available | 99(35.11) | 71(35.86) | 28(33.33) |
White_cell_count_result | |||
Elevated | 77(27.3) | 56(28.28) | 21(25) |
Low | 3(1.06) | 1(0.51) | 2(2.38) |
Normal | 150(53.19) | 100(50.51) | 50(59.52) |
Not Available | 52(18.44) | 41(20.71) | 11(13.09) |
Race_list.race | |||
BLACK OR AFRICAN AMERICAN | 47(16.67) | 34(17.17) | 13(15.48) |
Not Available | 3(1.06) | 1(0.51) | 2(2.38) |
WHITE | 232(82.27) | 163(82.32) | 69(82.14) |
We selected 942 differentially methylated sites between recurrence and no recurrence cohorts for univariate Cox proportional hazard regression analysis. As a result, 403 DNA methylation sites were proved to be strongly involved in KIRC patients' RFS (P < 0.05) (Table S1). After that the above 403 KIRC DNA methylation sites were projected to LASSO Cox regression model and 18 methylation sites were screened as the candidate prognostic sites (Figure 2) which were significantly related to RFS of KIRC patients. Those 18 candidate methylation sites were further analyzed by multivariable Cox analysis in the training set. Finally, 9 methylation sites (P < 0.05) were identified as the independent risk factors tightly associated with RFS of KIRC patients, including cg12009697, cg14207589, cg07990546, cg04094846, cg11132272, ca11955474, cg03010887, cg09217923, cg25206071. These 9 methylation sites were used for building a DNA methylation-based signature to predict the RFS of KIRC patients. Therefore, we constructed the risk score formula as follows: risk score = 2.625*cg14207589 + 4.519*cg09217923 + 2.615*cg11132272 - 2.373*cg12009697 + 2.751*cg03010887 + 1.568*cg07990546 + 1.344*cg04094846 + 1.507*cg11955474 + 2.065*cg25206071. We discovered that, the hypermethylation levels of cg14207589, cg09217923, cg11132272, cg03010887, cg07990546, cg04094846, cg11955474, cg25206071 tended to have poor survival rates. Whereas the hypomethylation levels of cg12009697 tended to have poor survival rates. (Figures 3 and S1).
In order to analyze the predictive capability of this 9 DNA methylation-based signature, we divided the patients in each set into high and low-risk cohorts based on the median risk score. Kaplan–Meier survival analysis was exploited to examine the difference in RFS between the two cohorts. The patients in high- risk cohort generated a significantly unfavorable RFS in internal validation set (p = 3e-04) (Figure 4A), similar results were obtained in external validation set (p = 8e-04) (Figure 4C) and entire TCGA set (p = 2e-13) (Figure 4E). After that, the power of the 9-DNA methylation signature-based indicator for KIRC patients' RFS was explored by using a time-dependent ROC curve. The AUC of the biomarker at 1, 3, 5 years in internal set were 0.859, 0.840, 0.817, respectively (Figure 4B), in external validation set (0.674, 0.739, 0.793, respectively) (Figure 4D) and entire TCGA set (0.834, 0.862, 0.842, respectively) (Figure 4F). We concluded that the 9-DNA methylation signature-related indicator yielded a great power for the prediction of KIRC patients' RFS.
Subsequently, the rank of the patients from entire TCGA set was carried out according to the risk scores (Figure 5A), and the dotplot of the total patients was performed according to their survival status (Figure 5B). We noted that the high-risk cohort generated a worse survival than that in the low-risk cohort. Figure 5C showed the heatmap of 9 methylation sites distribution according to risk score, which supported the previous observation (Figure S2). Then, we performed subgroup analysis by using a few clinical variables containing age, gender, anatomic site, grade and stage. The majority of sub-groups showed a good predictive power of the 9-DNA methylation signature for KIRC patients' RFS (Figures S3–S7).
We separated patients into high and low-risk groups by using a cutoff risk score of the median risk score. Figure 6A showed the top 20 enriched pathways that were more activated in the high-risk cases than that in low-risk cases. The same trend between the enriched pathways and risk score was further addressed in Figure 6B, which proved a good correlation between the pathways and the risk score (Table S2).
We first performed univariate and multivariate Cox tool according to a few clinic-related covariates. Hazard ratios (HRs) manifested that the 9-DNA methylation-related classifier was tightly related to KIRC patients' RFS (P < 0.001, HR 1.47, 95% CI 1.13–1.92) (Table 2 and Figure S8), manifesting that the 9-DNA methylation signature was an independent predictor of KIRC patients' RFS in the entire TCGA set. To further reinforce the prognostic value of the 9-DNA methylation-based signature for KIRC in a quantitative strategy. We developed a nomogram (Figure 7) that integrated the 9-DNA methylation-associated signature and the conventional clinic-associated covariates containing cancer status, grade. The significance between the 9-DNA methylation-based factor and the conventional clinic-associated covariates was described in Figure 8A. The value of the nomogram was weighed on the basis of C-index (0.802, 95%CI: 0.768-0.828), AUC (1, 3, 5-year: 0.912, 0.922, 0.915) (Figure 8B) and calibration plot (Figure 8C–E), proving a good value of the tool. In addition, DCA manifested that the nomogram created more crucial value of clinical utilization as predictor of KIRC patients' RFS than that in treat all or treat none group. Net benefit was available for KIRC patients in 3-year recurrent risks (Figure 8F). We concluded that our nomogram had a great value and may have potential for clinical application.
id | HR | HR.95L | HR.95H | pvalue | HR | HR.95L | HR.95H | pvalue |
Cancer_Status | 6.559682 | 4.597569 | 9.359168 | 3.30E-25 | 4.33397 | 2.931538 | 6.407318 | 1.95E-13 |
Score | 2.718282 | 2.197252 | 3.362863 | 3.24E-20 | 1.469438 | 1.126449 | 1.916862 | 0.004541 |
Grade | 2.196578 | 1.686027 | 2.861731 | 5.53E-09 | 1.330598 | 1.025083 | 1.727169 | 0.031865 |
platelet_qualitative_result | 1.809324 | 1.191503 | 2.747499 | 0.005402 | 1.33846 | 0.878716 | 2.038741 | 0.174536 |
M | 3.279185 | 2.494814 | 4.310164 | 1.68E-17 | 1.32983 | 0.780402 | 2.266071 | 0.294544 |
T | 2.776256 | 2.077911 | 3.709301 | 4.94E-12 | 1.327995 | 0.680582 | 2.591271 | 0.405569 |
Stage | 2.930931 | 2.311473 | 3.7164 | 6.90E-19 | 1.154549 | 0.555477 | 2.399706 | 0.700252 |
White_cell_count_result | 0.654328 | 0.478444 | 0.894871 | 0.007923 | 0.964921 | 0.695044 | 1.339588 | 0.831069 |
Serum_calcium_result | 1.477163 | 1.092262 | 1.997699 | 0.011311 | 1.033513 | 0.745413 | 1.432964 | 0.843271 |
Sex | 1.5336 | 0.9034 | 2.6034 | 0.1132 | ||||
23 | 22 | 33 | 39 | |||||
Laterality | 0.84882 | 0.669924 | 1.07549 | 0.174683 | ||||
Hemoglobin_result | 0.868924 | 0.667948 | 1.130369 | 0.295156 | ||||
N | 1.198348 | 0.761475 | 1.885865 | 0.434147 | ||||
Race | 1.102963 | 0.757493 | 1.605991 | 0.609215 |
The KIRC DNA methylation information and relevant clinical information from TCGA database was analyzed to unearth the predictor of KIRC patients' RFS. Eventually, 9 DNA methylation sites (cg12009697, cg14207589, cg07990546, cg04094846, cg11132272, ca11955474, cg03010887, cg09217923, cg25206071) were found to be strongly associated with RFS of KIRC patients. The above 9 DNA methylation sites were mapped to 4 genes (TLX2, OSBP, TAAR2, IL19). It is interesting to note that, previous researches suggested that most of these 4 genes were correlated with cancer, respectively. For instance, Liu et al. found that methylated COL4A1, COL4A2, TLX2, and ITGA4 demonstrated high accuracy for the detection of colorectal neoplasms in stool and they may be potentially valuable biomarkers for the detection of colorectal cancer [27]. Liao et al. demonstrated that TAT-OSBP-MKK6(E) was a novel artificially designed molecule, which induced apoptosis and selectively targeted human ovarian carcinoma HO8910 cells. Their study provided novel insights that may aid in the development of a new generation of anticancer drugs, which implied the importance of OSBP in cancer [28]. Hsing et al. suggested that upregulated IL-19 in breast cancer promoted tumor progression and affected clinical result [29]. The result manifested that the 3 of the 4 genes involved in the 9 sites played important roles in progression of cancer.
Multiple studies indicated that nomograms may strengthen prognostic predictive accuracy for cancer by integrating several clinical variables in a quantitative method. For example, Wang et al. constructed a nomogram to predict gleason sum upgrading of clinically diagnosed localized prostate cancer among Chinese patients [30]. Lee et al. built a prognostic nomogram to predict progression-free survival in patients with platinum-sensitive recurrent ovarian cancer [31]. Taşkın et al. found a nomogram with potential clinical application to predict lymph node metastasis in endometrial cancer patients diagnosed incidentally by postoperative pathological assessment [32]. However, nomograms for improving predictive ability of KIRC patients' RFS have been rarely reported. In this study, we aimed to develop a nomogram using both methylation risk score and several clinic-associated covariates for predicting 1, 3, 5-year RFS for KIRC patient from the entire TCGA set. The indicators of the C-index, AUC, DCA and calibration curve from the entire TCGA set exhibited that our nomogram had discriminative accuracy and was adopted as the preferred predictive model. Furthermore, we developed the nomogram as a predicator in a quantitative method for the prognosis of KIRC patient, which could predict the accruate survival percentage of KIRC patients. In addition, the key virtues of the nomogram contained clinical applicability and convenient factors, which was readily available according to historical records. On the other hand, DNA methylation profiling is highly accurate and reproducible even using small specimens and poor quality material [18], suggesting that this methylomics-correlated nomogram method had a great advantage to predict prognosis of cancer patients in comparison to other signatures.
Growing researches manifested that LASSO Cox regression model can be employed to unearth markers of multiple cancers, For example, Connell et al. found a four-group urine risk classifier for predicting outcome in prostate cancer patients based on LASSO Cox regression analysis [33]. Zhang et al. identified a new eight-long noncoding RNA molecular signature for breast cancer survival prediction according to the LASSO method, univariate and multivariate Cox analyses [34]. Liu et al. identified an eight-lncRNA prognostic model for breast cancer using WGCNA network analysis and a Cox‑proportional hazards model based on LASSO Cox regression model [35]. Du et al. constructed a diagnostic nomogram of platelet-based score models for hepatic alveolar echinococcosis and atypical liver cancer using LASSO Cox regression model [36]. A significant merit of LASSO is that it has sparse estimates of the regression coefficients which suggests that various components are precisely 0. In other words, LASSO can automatically remove unnecessary variables. LASSO has various preferred properties for regression models with numerous variables, and multiple efficient optimization algorithms are available for linear regression and generalized linear models [37]. To our knowledge, fewer studies have used LASSO regression model for the determination of a prognostic predictor of KIRC. We performed LASSO Cox regression analysis to select candidate methylation sites tightly related to KIRC patients' RFS for filtering the variables between univariate and multivariate Cox analysis, further improving prognostic predicted ability of 9-DNA methylation-associated signature.
There are still a few limitations of this study. Firstly, our study is a retrospective one and the prospective studies including a larger number of samples of various medical centers are needed to verify the outcomes. Secondly, more factors should be mapped into our external validation set to improve the predicted accuracy of the nomogram. Thirdly, the nomograms were developed by using retrospective data from TCGA database, which may be correlated with the potential hazard of selection bias.
We successfully identified a 9-DNA methylation-based signature, which was a useful prognostic predictor for KIRC patients' RFS. A nomogram combining methylation risk score and the conventional clinic-related covariates was helpful in improving the predicted ability of clinical prognosis for KIRC patients.
This work was supported by the National Nature Science Foundation of China (Grant Nos. 82073324).
The authors declare that they have no competing interests.
[1] | Banting FG, Best CH, Collip JB, et al. (1922) Pancreatic extracts in the treatment of diabetes mellitus. Can Med Assoc J 12: 141–146. |
[2] |
Ryle AP, Sanger F, Smith LF, et al. (1955) The disulphide bonds of insulin. Biochem J 60: 541–556. doi: 10.1042/bj0600541
![]() |
[3] | Dodson E, Harding MM, Hodgkin DC, et al. (1966) The crystal structure of insulin. 3. Evidence for a 2-fold axis in rhombohedral zinc insulin. J Mol Biol 16: 227–241. |
[4] |
Mckern NM, Lawrence MC, Streltsov VA, et al. (2006) Structure of the insulin receptor ectodomain reveals a folded-over conformation. Nature 443: 218–221. doi: 10.1038/nature05106
![]() |
[5] | Haeusler RA, Mcgraw TE, Accili D (2018) Biochemical and cellular properties of insulin receptor signalling. Nat Rev Mol Cell Biol 19: 31–44. |
[6] |
Vajdos FF, Ultsch M, Schaffer ML, et al. (2001) Crystal structure of humun insulin-like growth factor-1: Detergent binding inhibits binding protein interactions. Biochemistry 40: 11022–11029. doi: 10.1021/bi0109111
![]() |
[7] |
Hakuno F, Takahashi SI (2018) IGF1 receptor signaling pathways. J Mol Endocrinol 61: T69–T86. doi: 10.1530/JME-17-0311
![]() |
[8] | Fernandez AM, Torres-Aleman I (2012) The many faces of insulin-like peptide signaling in the brain. Nat Rev Neurosci 13: 225–239. |
[9] |
Christie AE, Roncalli V, Lenz PH (2016) Diversity of insulin-like peptide signaling system proteins in Calanus finmarchicus (Crustacea; Copepoda)-possible contributors to seasonal pre-adult diapause. Gen Comp Endocrinol 236: 157–173. doi: 10.1016/j.ygcen.2016.07.016
![]() |
[10] | Lee Y, An SWA, Artan M, et al. (2015) Genes and pathways that influence longevity in Caenorhabditis elegans, In: Aging Mechanisms Mori N., Mook-Jung I, eds, 123–169. |
[11] |
Giannakou ME, Partridge L (2007) Role of insulin-like signalling in Drosophila lifespan. Trends Biochem Sci 32: 180–188. doi: 10.1016/j.tibs.2007.02.007
![]() |
[12] |
Fontana L, Partridge L, Longo VD (2010) Extending healthy life span-from yeast to humans. Science 328: 321–326. doi: 10.1126/science.1172539
![]() |
[13] |
Kenyon CJ (2010) The genetics of ageing. Nature 464: 504–512. doi: 10.1038/nature08980
![]() |
[14] | Nassel DR, Kubrak OI, Liu Y, et al. (2013) Factors that regulate insulin producing cells and their output in Drosophila. Front Physiol 4: 252. |
[15] | Grönke S, Partridge L, (2010) The functions of insulin-like peptides in insects, In: Clemmons D, Robinson I, Christen Y, eds., IGFs: Local repair and survival factors throughout life span, Research and Perspectives in Endocrine Interactions, Springer, Berlin, Heidelberg, 105–124. |
[16] |
Zhang H, Liu J, Li CR, et al. (2009) Deletion of Drosophila insulin-like peptides causes growth defects and metabolic abnormalities. Proc Natl Acad Sci U S A 106: 19617–19622. doi: 10.1073/pnas.0905083106
![]() |
[17] |
Colombani J, Andersen DS, Leopold P (2012) Secreted peptide Dilp8 coordinates Drosophila tissue growth with developmental timing. Science 336: 582–585. doi: 10.1126/science.1216689
![]() |
[18] |
Abreu DAFD, Caballero A, Fardel P, et al. (2014) An insulin-to-insulin regulatory network orchestrates phenotypic specificity in development and physiology. PLoS Genet 10: e1004225. doi: 10.1371/journal.pgen.1004225
![]() |
[19] | Brenner S (1974) The genetics of Caenorhabditis elegans. Genetics 77: 91–94. |
[20] | Consortium CES (1998) Genome sequence of the nematode C. elegans: A platform for investigating biology. Science 282: 2012–2018. |
[21] |
Fire A, Xu S, Montgomery MK, et al. (1998) Potent and specific genetic interference by double-stranded RNA in Caenorhabditis elegans. Nature 391: 806–811. doi: 10.1038/35888
![]() |
[22] |
Zwaal RR, Broeks A, van Meurs J, et al. (1993) Target-selected gene inactivation in Caenorhabditis elegans by using a frozen transposon insertion mutant bank. Proc Natl Acad Sci U S A 90: 7431–7435. doi: 10.1073/pnas.90.16.7431
![]() |
[23] |
Klass MR (1983) A method for the isolation of longevity mutants in the nematode Caenorhabditis elegans and initial results. Mech Ageing Dev 22: 279–286. doi: 10.1016/0047-6374(83)90082-9
![]() |
[24] | Friedman DB, Johnson TE (1988) A mutation in the age-1 gene in Caenorhabditis elegans lengthens life and reduces hermaphrodite fertility. Genetics 118: 75–86. |
[25] |
Friedman DB, Johnson TE (1988) Three mutants that extend both mean and maximum life span of the nematode, Caenorhabditis elegans, define the age-1 gene. J Gerontol Biol Sci 43: 102–109. doi: 10.1093/geronj/43.4.B102
![]() |
[26] |
Johnson TE (1990) Increased life-span of age-1 mutants in Caenorhabditis elegans and lower Gompertz rate of aging. Science 249: 908–912. doi: 10.1126/science.2392681
![]() |
[27] | Kenyon C, Chang J, Gensch E, et al. (1993) A C. elegans mutant that lives twice as long as wild type. Nature 366: 461–464. |
[28] |
Kimura KD, Tissenbaum HA, Liu Y, et al. (1997) daf-2, an insulin receptor-like gene that regulates longevity and diapause in Caenorhabditis elegans. Science 277: 942–946. doi: 10.1126/science.277.5328.942
![]() |
[29] | Murakami S, Johnson TE (1996) A genetic pathway conferring life extension and resistance to UV stress in Caenorhabditis elegans. Genetics 143: 1207–1218. |
[30] |
Cassada RC, Russell RL (1975) The dauerlarva, a post-embryonic developmental variant of the nematode Caenorhabditis elegans. Dev Biol 46: 326–342. doi: 10.1016/0012-1606(75)90109-8
![]() |
[31] |
Riddle DL, Swanson MM, Albert PS (1981) Interacting genes in nematode dauer larva formation. Nature 290: 668–671. doi: 10.1038/290668a0
![]() |
[32] | Vowels JJ, Thomas JH (1992) Genetic analysis of chemosensory control of dauer formation in Caenorhabditis elegans. Genetics 130: 105–123. |
[33] | Gottlieb S, Ruvkun G (1994) daf-2, daf-16 and daf-23: Genetically interacting genes controlling Dauer formation in Caenorhabditis elegans. Genetics 137: 107–120. |
[34] | Ogg S, Ruvkun G (1998) The C. elegans PTEN homolog, DAF-18, acts in the insulin receptor-like metabolic signaling pathway. Mol Cell 2: 887–893. |
[35] |
Gil EB, Malone LE, Liu LX, et al. (1999) Regulation of the insulin-like developmental pathway of Caenorhabditis elegans by a homolog of the PTEN tumor suppressor gene. Proc Natl Acad Sci U S A 96: 2925–2930. doi: 10.1073/pnas.96.6.2925
![]() |
[36] |
Mihaylova VT, Borland CZ, Manjarrez L, et al. (1999) The PTEN tumor suppressor homolog in Caenorhabditis elegans regulates longevity and dauer formation in an insulin receptor-like signaling pathway. Proc Natl Acad Sci U S A 96: 7427–7432. doi: 10.1073/pnas.96.13.7427
![]() |
[37] |
Rouault JP, Kuwabara PE, Sinilnikova OM, et al. (1999) Regulation of dauer larva development in Caenorhabditis elegans by daf-18, a homologue of the tumour suppressor PTEN. Curr Biol 9: 329–332. doi: 10.1016/S0960-9822(99)80143-2
![]() |
[38] | Baugh LR, Sternberg PW (2006) DAF-16/FOXO regulates transcription of cki-1/Cip/Kip and repression of lin-4 during C. elegans L1 arrest. Curr Biol 16: 780–785. |
[39] | Lithgow GJ, White TM, Hinerfeld DA, et al. (1994) Thermotolerance of a long-lived mutant of Caenorhabditis elegans. J Gerontol 49: 270–276. |
[40] |
Lithgow GJ, White TM, Melov S, et al. (1995) Thermotolerance and extended life-span conferred by single-gene mutations and induced by thermal stress. Proc Natl Acad Sci U S A 92: 7540–7544. doi: 10.1073/pnas.92.16.7540
![]() |
[41] |
Babar P, Adamson C, Walker GA, et al. (1999) PI3-kinase inhibition induces dauer formation, thermotolerance and longevity in C. elegans. Neurobiol Aging 20: 513–519. doi: 10.1016/S0197-4580(99)00094-9
![]() |
[42] |
Walker GA, Walker DW, Lithgow GJ (1998) Genes that determine both thermotolerance and rate of aging in Caenorhabditis elegans. Ann N Y Acad Sci 851: 444–449. doi: 10.1111/j.1749-6632.1998.tb09022.x
![]() |
[43] |
Walker GA, White TM, McColl G, et al. (2001) Heat shock protein accumulation is upregulated in a long-lived mutant of Caenorhabditis elegans. J Gerontol A Biol Sci Med Sci 56: B281–B287. doi: 10.1093/gerona/56.7.B281
![]() |
[44] |
Hsu AL, Murphy CT, Kenyon C (2003) Regulation of aging and age-related disease by DAF-16 and heat-shock factor. Science 300: 1142–1145. doi: 10.1126/science.1083701
![]() |
[45] |
Honda Y, Honda S (1999) The daf-2 gene network for longevity regulates oxidative stress resistance and Mn-superoxide dismutase gene expression in Caenorhabditis elegans. FASEB J 13: 1385–1393. doi: 10.1096/fasebj.13.11.1385
![]() |
[46] |
Honda Y, Honda S (2002) Oxidative stress and life span determination in the nematode Caenorhabditis elegans. Ann N Y Acad Sci 959: 466–474. doi: 10.1111/j.1749-6632.2002.tb02117.x
![]() |
[47] | Scott BA, Avidan MS, Crowder CM (2002) Regulation of hypoxic death in C. elegans by the insulin/IGF receptor homolog DAF-2. Science 296: 2388–2391. |
[48] | Lamitina ST, Strange K (2005) Transcriptional targets of DAF-16 insulin signaling pathway protect C. elegans from extreme hypertonic stress. Am J Physiol -Cell Ph 288: C467–C474. |
[49] |
Barsyte D, Lovejoy DA, Lithgow GJ (2001) Longevity and heavy metal resistance in daf-2 and age-1 long-lived mutants of Caenorhabditis elegans. FASEB J 15: 627–634. doi: 10.1096/fj.99-0966com
![]() |
[50] |
Morley JF, Morimoto RI (2004) Regulation of longevity in Caenorhabditis elegans by heat shock factor and molecular chaperones. Mol Biol Cell 15: 657–664. doi: 10.1091/mbc.e03-07-0532
![]() |
[51] |
Cohen E, Bieschke J, Perciavalle RM, et al. (2006) Opposing activities protect against age-onset proteotoxicity. Science 313: 1604–1610. doi: 10.1126/science.1124646
![]() |
[52] |
Keowkase R, Aboukhatwa M, Luo Y (2010) Fluoxetine protects against amyloid-beta toxicity, in part via daf-16 mediated cell signaling pathway, in Caenorhabditis elegans. Neuropharmacology 59: 358–365. doi: 10.1016/j.neuropharm.2010.04.008
![]() |
[53] | Ching TT, Chiang WC, Chen CS, et al. (2011) Celecoxib extends C. elegans lifespan via inhibition of insulin-like signaling but not cyclooxygenase-2 activity. Aging Cell 10: 506–519. |
[54] | Teixeira-Castro A, Ailion M, Jalles A, et al. (2011) Neuron-specific proteotoxicity of mutant ataxin-3 in C. elegans: Rescue by the DAF-16 and HSF-1 pathways. Hum Mol Genet 20: 2996–3009. |
[55] |
Zhang T, Hwang HY, Hao H, et al. (2012) Caenorhabditis elegans RNA-processing protein TDP-1 regulates protein homeostasis and life span. J Biol Chem 287: 8371–8382. doi: 10.1074/jbc.M111.311977
![]() |
[56] |
Nagasawa H, Kataoka H, Isogai A, et al. (1984) Amino-terminal amino acid sequence of the silkworm prothoracicotropic hormone: Homology with insulin. Science 226: 1344–1345. doi: 10.1126/science.226.4680.1344
![]() |
[57] |
Smit AB, Vreugdenhil E, Ebberink RH, et al. (1988) Growth-controlling molluscan neurons produce the precursor of an insulin-related peptide. Nature 331: 535–538. doi: 10.1038/331535a0
![]() |
[58] |
Lagueux M, Lwoff L, Meister M, et al. (1990) cDNAs from neurosecretory cells of brains of Locusta migratoria (Insecta, Orthoptera) encoding a novel member of the superfamily of insulins. Eur J Biochem 187: 249–254. doi: 10.1111/j.1432-1033.1990.tb15302.x
![]() |
[59] |
Chandler JC, Aizen J, Elizur A, et al. (2015) Discovery of a novel insulin-like peptide and insulin binding proteins in the Eastern rock lobster Sagmariasus verreauxi. Gen Comp Endocr 215: 76–87. doi: 10.1016/j.ygcen.2014.08.018
![]() |
[60] |
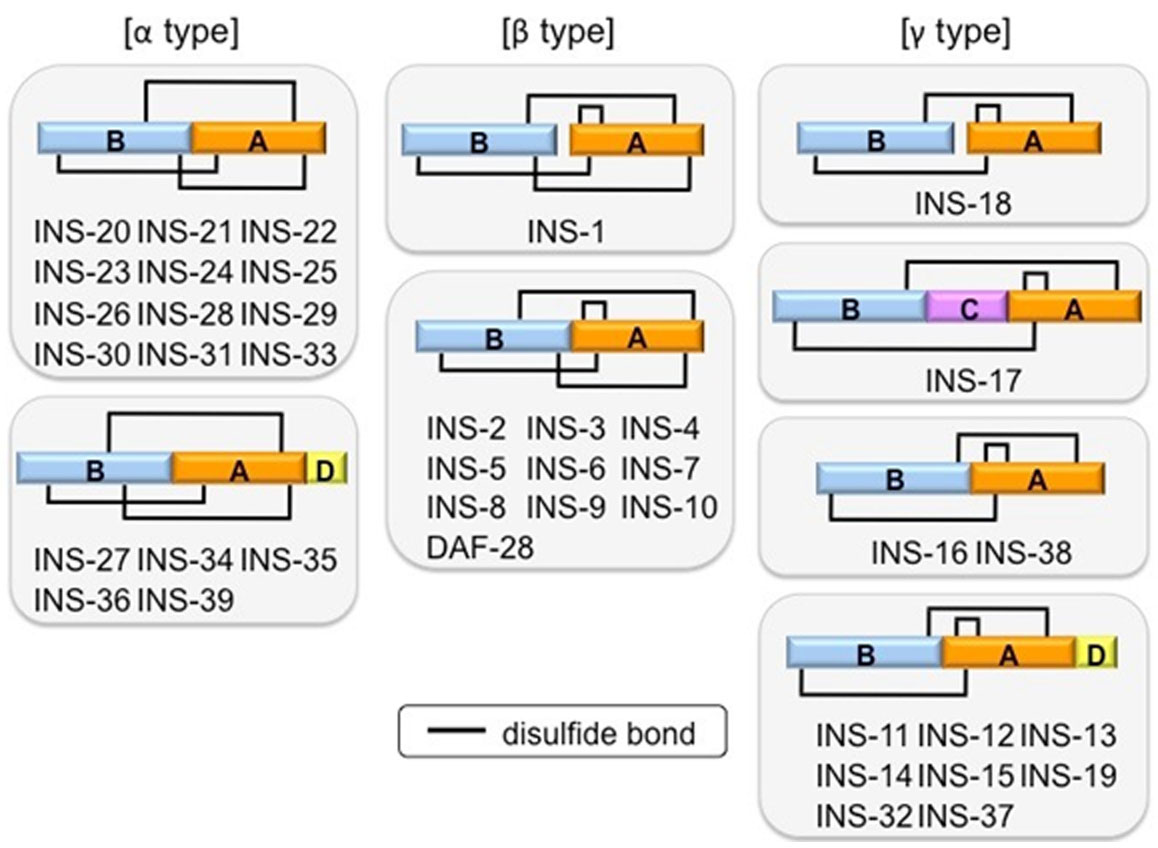
Duret L, Guex N, Peitsch MC, et al. (1998) New insulin-like proteins with atypical disulfide bond pattern characterized in Caenorhabditis elegans by comparative sequence analysis and homology modeling. Genome Res 8: 348–353. doi: 10.1101/gr.8.4.348
![]() |
[61] | Pierce SB, Costa M, Wisotzkey R, et al. (2001) Regulation of DAF-2 receptor signaling by human insulin and ins-1, a member of the unusually large and diverse C. elegans insulin gene family. Genes Dev 15: 672–686. |
[62] | Li W, Kennedy SG, Ruvkun G (2003) daf-28 encodes a C. elegans insulin superfamily member that is regulated by environmental cues and acts in the DAF-2 signaling pathway. Genes Dev 17: 844–858. |
[63] |
Husson SJ, Mertens I, Janssen T, et al. (2007) Neuropeptidergic signaling in the nematode Caenorhabditis elegans. Prog Neurobiol 82: 33–55. doi: 10.1016/j.pneurobio.2007.01.006
![]() |
[64] |
Kawano T, Ito Y, Ishiguro M, et al. (2000) Molecular cloning and characterization of a new insulin/IGF-like peptide of the nematode Caenorhabditis elegans. Biochem Biophys Res Commun 273: 431–436. doi: 10.1006/bbrc.2000.2971
![]() |
[65] |
Matsunaga Y, Gengyo-Ando K, Mitani S, et al. (2012) Physiological function, expression pattern, and transcriptional regulation of a Caenorhabditis elegans insulin-like peptide, INS-18. Biochem Biophys Res Commun 423: 478–483. doi: 10.1016/j.bbrc.2012.05.145
![]() |
[66] | Wang X, Wang X, Wang D, et al. (2010) [Expression changes of age-related genes in different aging stages of Caenorhabiditis elegans and the regulating effects of Chuanxiong extract]. China J Chin Mater Med 35: 1599–1602. |
[67] |
Kawano T, Nagatomo R, Kimura Y, et al. (2006) Disruption of ins-11, a Caenorhabditis elegans insulin-like gene, and phenotypic analyses of the gene-disrupted animal. Biosci Biotechnol Biochem 70: 3084–3087. doi: 10.1271/bbb.60472
![]() |
[68] |
Morris JZ, Tissenbaum HA, Ruvkun G (1996) A phosphatidylinositol-3-OH kinase family member regulating longevity and diapause in Caenorhabditis elegans. Nature 382: 536–539. doi: 10.1038/382536a0
![]() |
[69] |
Paradis S, Ailion M, Toker A, et al. (1999) A PDK1 homolog is necessary and sufficient to transduce AGE-1 PI3 kinase signals that regulate diapause in Caenorhabditis elegans. Genes Dev 13: 1438–1452. doi: 10.1101/gad.13.11.1438
![]() |
[70] |
Paradis S, Ruvkun G (1998) Caenorhabditis elegans Akt/PKB transduces insulin receptor-like signals from AGE-1 PI3 kinase to the DAF-16 transcription factor. Genes Dev 12: 2488–2498. doi: 10.1101/gad.12.16.2488
![]() |
[71] |
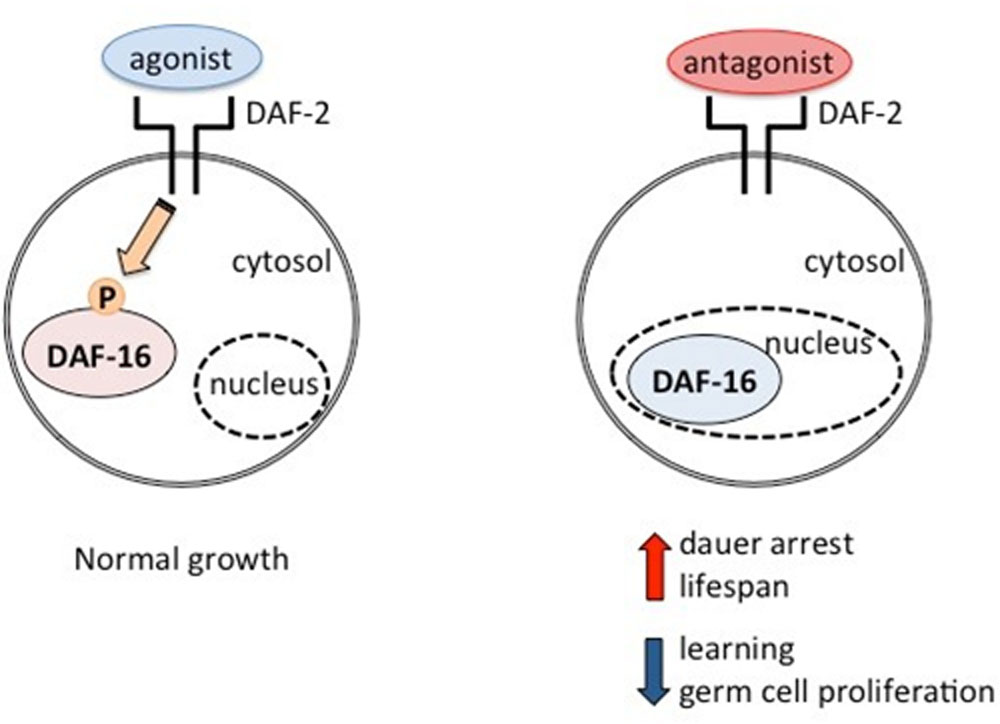
Ogg S, Paradis S, Gottlieb S, et al. (1997) The Fork head transcription factor DAF-16 transduces insulin-like metabolic and longevity signals in C. elegans. Nature 389: 994–999. doi: 10.1038/40194
![]() |
[72] |
Henderson ST, Johnson TE (2001) daf-16 integrates developmental and environmental inputs to mediate aging in the nematode Caenorhabditis elegans. Curr Biol 11: 1975–1980. doi: 10.1016/S0960-9822(01)00594-2
![]() |
[73] | Lee RY, Hench J, Ruvkun G (2001) Regulation of C. elegans DAF-16 and its human ortholog FKHRL1 by the daf-2 insulin-like signaling pathway. Curr Biol 11: 1950–1957. |
[74] | Malone EA, Inoue T, Thomas JH (1996) Genetic analysis of the roles of daf-28 and age-1 in regulating Caenorhabditis elegans dauer formation. Genetics 143: 1193–1205. |
[75] |
Murphy CT, Mccarroll SA, Bargmann CI, et al. (2003) Genes that act downstream of DAF-16 to influence the lifespan of Caenorhabditis elegans. Nature 424: 277–283. doi: 10.1038/nature01789
![]() |
[76] |
Matsunaga Y, Nakajima K, Gengyo-Ando K, et al. (2012) A Caenorhabditis elegans insulin-like peptide, INS-17: Its physiological function and expression pattern. Biosci Biotechnol Biochem 76: 2168–2172. doi: 10.1271/bbb.120540
![]() |
[77] |
Matsunaga Y, Matsukawa T, Iwasaki T, et al. (2018) Comparison of physiological functions of antagonistic insulin-like peptides, INS-23 and INS-18, in Caenorhabditis elegans. Biosci Biotechnol Biochem 82: 90–96. doi: 10.1080/09168451.2017.1415749
![]() |
[78] |
Cornils A, Gloeck M, Chen Z, et al. (2011) Specific insulin-like peptides encode sensory information to regulate distinct developmental processes. Development 138: 1183–1193. doi: 10.1242/dev.060905
![]() |
[79] |
Murphy CT, Lee SJ, Kenyon C (2007) Tissue entrainment by feedback regulation of insulin gene expression in the endoderm of Caenorhabditis elegans. Proc Natl Acad Sci U S A 104: 19046–19050. doi: 10.1073/pnas.0709613104
![]() |
[80] |
Tomioka M, Adachi T, Suzuki H, et al. (2006) The insulin/PI 3-kinase pathway regulates salt chemotaxis learning in Caenorhabditis elegans. Neuron 51: 613–625. doi: 10.1016/j.neuron.2006.07.024
![]() |
[81] |
Kodama E, Kuhara A, Mohri-Shiomi A, et al. (2006) Insulin-like signaling and the neural circuit for integrative behavior in C. elegans. Genes Dev 20: 2955–2960. doi: 10.1101/gad.1479906
![]() |
[82] |
Lin CH, Tomioka M, Pereira S, et al. (2010) Insulin signaling plays a dual role in Caenorhabditis elegans memory acquisition and memory retrieval. J Neurosci 30: 8001–8011. doi: 10.1523/JNEUROSCI.4636-09.2010
![]() |
[83] |
Chen Z, Hendricks M, Cornils A, et al. (2013) Two insulin-like peptides antagonistically regulate aversive olfactory learning in C. elegans. Neuron 77: 572–585. doi: 10.1016/j.neuron.2012.11.025
![]() |
[84] | Michaelson D, Korta DZ, Capua Y, et al. (2010) Insulin signaling promotes germline proliferation in C. elegans. Development 137: 671–680. |
[85] | Ritter AD, Shen Y, Fuxman BJ, et al. (2013) Complex expression dynamics and robustness in C. elegans insulin networks. Genome Res 23: 954–965. |
[86] | Matsunaga Y, Iwasaki T, Kawano T (2017) Diverse insulin-like peptides in Caenorhabditis elegans. Int Biol Rev , 1. |
[87] |
Hua QX, Nakagawa SH, Wilken J, et al. (2003) A divergent INS protein in Caenorhabditis elegans structurally resembles human insulin and activates the human insulin receptor. Genes Dev 17: 826–831. doi: 10.1101/gad.1058003
![]() |
[88] |
Kao G, Nordenson C, Still M, et al. (2007) ASNA-1 positively regulates insulin secretion in C. elegans and mammalian cells. Cell 128: 577–587. doi: 10.1016/j.cell.2006.12.031
![]() |
[89] |
Matsunaga Y, Honda Y, Honda S, et al. (2016) Diapause is associated with a change in the polarity of secretion of insulin-like peptides. Nat Commun 7: 10573. doi: 10.1038/ncomms10573
![]() |
[90] |
Clark ME, Kelner GS, Turbeville LA, et al. (2000) ADAMTS9, a novel member of the ADAM-TS/ metallospondin gene family. Genomics 67: 343–350. doi: 10.1006/geno.2000.6246
![]() |
[91] |
Somerville RP, Longpre JM, Jungers KA, et al. (2003) Characterization of ADAMTS-9 and ADAMTS-20 as a distinct ADAMTS subfamily related to Caenorhabditis elegans GON-1. J Biol Chem 278: 9503–9513. doi: 10.1074/jbc.M211009200
![]() |
[92] | Yoshina S, Mitani S (2015) Loss of C. elegans GON-1, an ADAMTS9 Homolog, Decreases Secretion Resulting in Altered Lifespan and Dauer Formation. PLoS One 10: e0133966. |
[93] |
Suckale J, Solimena M (2010) The insulin secretory granule as a signaling hub. Trends Endocrin Met 21: 599–609. doi: 10.1016/j.tem.2010.06.003
![]() |
[94] |
Drucker DJ, Philippe J, Mojsov S, et al. (1987) Glucagon-like peptide I stimulates insulin gene expression and increases cyclic AMP levels in a rat islet cell line. Proc Natl Acad Sci U S A 84: 3434–3438. doi: 10.1073/pnas.84.10.3434
![]() |
[95] |
Fehmann HC, Habener JF (1992) Galanin inhibits proinsulin gene expression stimulated by the insulinotropic hormone glucagon-like peptide-I (7-37) in mouse insulinoma beta TC-1 cells. Endocrinology 130: 2890–2896. doi: 10.1210/endo.130.5.1374016
![]() |
[96] |
Koranyi L, James DE, Kraegen EW, et al. (1992) Feedback inhibition of insulin gene expression by insulin. J Clin Invest 89: 432–436. doi: 10.1172/JCI115602
![]() |
[97] | Shaw WM, Luo S, Landis J, et al. (2007) The C. elegans TGF-beta Dauer pathway regulates longevity via insulin signaling. Curr Biol 17: 1635–1645. |
[98] |
Hung WL, Wang Y, Chitturi J, et al. (2014) A Caenorhabditis elegans developmental decision requires insulin signaling-mediated neuron-intestine communication. Development 141: 1767–1779. doi: 10.1242/dev.103846
![]() |
[99] |
Liu T, Zimmerman KK, Patterson GI (2004) Regulation of signaling genes by TGFbeta during entry into dauer diapause in C. elegans. BMC Dev Biol 4: 11. doi: 10.1186/1471-213X-4-11
![]() |
[100] |
Narasimhan SD, Yen K, Bansal A, et al. (2011) PDP-1 links the TGF-beta and IIS pathways to regulate longevity, development, and metabolism. PLoS Genet 7: e1001377. doi: 10.1371/journal.pgen.1001377
![]() |
[101] |
Dlakic M (2002) A new family of putative insulin receptor-like proteins in C. elegans. Curr Biol 12: R155–R157. doi: 10.1016/S0960-9822(02)00729-7
![]() |
[102] | Tomioka M, Naito Y, Kuroyanagi H, et al. (2016) Splicing factors control C. elegans behavioural learning in a single neuron by producing DAF-2c receptor. Nat Commun 7: 11645. |
[103] |
Bulger DA, Fukushige T, Yun S, et al. (2017) Caenorhabditis elegans DAF-2 as a model for human insulin receptoropathies. G3 Genesgenetics 7: 257–268. doi: 10.1534/g3.116.037184
![]() |
1. | Alana C. Jones, Amit Patki, Vinodh Srinivasasainagendra, Bertha A. Hidalgo, Hemant K. Tiwari, Nita A. Limdi, Nicole D. Armstrong, Ninad S. Chaudhary, Bré Minniefield, Devin Absher, Donna K. Arnett, Leslie A. Lange, Ethan M. Lange, Bessie A. Young, Clarissa J. Diamantidis, Stephen S. Rich, Josyf C. Mychaleckyj, Jerome I. Rotter, Kent D. Taylor, Holly J. Kramer, Russell P. Tracy, Peter Durda, Silva Kasela, Tuuli Lappalinen, Yongmei Liu, W. Craig Johnson, David J. Van Den Berg, Nora Franceschini, Simin Liu, Charles P. Mouton, Parveen Bhatti, Steve Horvath, Eric A. Whitsel, Marguerite R. Irvin, A methylation risk score for chronic kidney disease: a HyperGEN study, 2024, 14, 2045-2322, 10.1038/s41598-024-68470-z | |
2. | Jun Wang, Xiaoming He, Yuanyuan Mi, Yong Q. Chen, Jie Li, Rong Wang, PSAT1 enhances the efficacy of the prognosis estimation nomogram model in stage-based clear cell renal cell carcinoma, 2024, 24, 1471-2407, 10.1186/s12885-024-12183-z | |
3. | Kathleen C. Barnes, 2025, 9780323988087, 1, 10.1016/B978-0-323-98808-7.00006-0 |
Characteristics | Total (n=282) | Training dataset (n=198) | Testing dataset (n=84) |
Gender | |||
FEMALE | 104(36.88) | 73(36.87) | 31(36.9) |
MALE | 178(63.12) | 125(63.13) | 53(63.1) |
Age | |||
≤ 60 | 132(46.81) | 94(47.47) | 38(45.24) |
> 60 | 150(53.19) | 104(52.53) | 46(54.76) |
Stage | |||
Stage I | 147(52.13) | 101(51.01) | 46(54.76) |
Stage II | 29(10.28) | 19(9.6) | 10(11.9) |
Stage III | 68(24.11) | 53(26.77) | 15(17.86) |
Stage IV | 36(12.77) | 23(11.62) | 13(15.48) |
Not Available | 2(0.71) | 2(1.01) | |
M | |||
M0 | 238(84.4) | 168(84.85) | 70(83.33) |
M1 | 34(12.06) | 22(11.11) | 12(14.29) |
Not Available | 10(3.55) | 8(4.04) | 2(2.38) |
T | |||
T1 | 149(52.84) | 101(51.01) | 48(57.14) |
T2 | 37(13.12) | 24(12.12) | 13(15.47) |
T3 | 93(32.98) | 71(35.86) | 22(26.19) |
T4 | 3(1.06) | 2(1.01) | 1(1.19) |
N | |||
N0 | 119(42.2) | 85(42.93) | 34(40.48) |
N1 | 8(2.84) | 6(3.03) | 2(2.38) |
Not Available | 155(54.96) | 107(54.04) | 48(57.14) |
Grade | |||
G1 | 8(2.84) | 7(3.54) | 1(1.19) |
G2 | 122(43.26) | 85(42.93) | 37(44.05) |
G3 | 110(39.01) | 80(40.4) | 30(35.71) |
G4 | 38(13.48) | 23(11.62) | 15(17.86) |
Not Available | 4(1.42) | 3(1.52) | 1(1.19) |
Cancer_Status | |||
TUMOR FREE | 201(71.28) | 144(72.73) | 57(67.86) |
WITH TUMOR | 59(20.92) | 38(19.19) | 21(25) |
Not Available | 22(7.80) | 16(8.08) | 6(7.14) |
Laterality | |||
Bilateral | 1(0.35) | 1(0.51) | |
Left | 130(46.1) | 92(46.46) | 38(45.24) |
Right | 151(53.55) | 105(53.03) | 46(54.76) |
Hemoglobin_result | |||
Elevated | 4(1.42) | 2(1.01) | 2(2.38) |
Low | 132(46.81) | 86(43.43) | 46(54.76) |
Normal | 102(36.17) | 75(37.88) | 27(32.14) |
Not Available | 44(16.60) | 35(17.68) | 9(10.71) |
Platelet_qualitative_result | |||
Elevated | 14(4.96) | 10(5.05) | 4(4.76) |
Low | 30(10.64) | 24(12.12) | 6(7.14) |
Normal | 189(67.02) | 125(63.13) | 64(76.19) |
Not Available | 49(17.38) | 39(19.7) | 10(11.9) |
Serum_calcium_result | |||
Elevated | 4(1.42) | 2(1.01) | 2(2.38) |
Low | 100(35.46) | 65(32.83) | 35(41.67) |
Normal | 79(28.01) | 60(30.3) | 19(22.62) |
Not Available | 99(35.11) | 71(35.86) | 28(33.33) |
White_cell_count_result | |||
Elevated | 77(27.3) | 56(28.28) | 21(25) |
Low | 3(1.06) | 1(0.51) | 2(2.38) |
Normal | 150(53.19) | 100(50.51) | 50(59.52) |
Not Available | 52(18.44) | 41(20.71) | 11(13.09) |
Race_list.race | |||
BLACK OR AFRICAN AMERICAN | 47(16.67) | 34(17.17) | 13(15.48) |
Not Available | 3(1.06) | 1(0.51) | 2(2.38) |
WHITE | 232(82.27) | 163(82.32) | 69(82.14) |
id | HR | HR.95L | HR.95H | pvalue | HR | HR.95L | HR.95H | pvalue |
Cancer_Status | 6.559682 | 4.597569 | 9.359168 | 3.30E-25 | 4.33397 | 2.931538 | 6.407318 | 1.95E-13 |
Score | 2.718282 | 2.197252 | 3.362863 | 3.24E-20 | 1.469438 | 1.126449 | 1.916862 | 0.004541 |
Grade | 2.196578 | 1.686027 | 2.861731 | 5.53E-09 | 1.330598 | 1.025083 | 1.727169 | 0.031865 |
platelet_qualitative_result | 1.809324 | 1.191503 | 2.747499 | 0.005402 | 1.33846 | 0.878716 | 2.038741 | 0.174536 |
M | 3.279185 | 2.494814 | 4.310164 | 1.68E-17 | 1.32983 | 0.780402 | 2.266071 | 0.294544 |
T | 2.776256 | 2.077911 | 3.709301 | 4.94E-12 | 1.327995 | 0.680582 | 2.591271 | 0.405569 |
Stage | 2.930931 | 2.311473 | 3.7164 | 6.90E-19 | 1.154549 | 0.555477 | 2.399706 | 0.700252 |
White_cell_count_result | 0.654328 | 0.478444 | 0.894871 | 0.007923 | 0.964921 | 0.695044 | 1.339588 | 0.831069 |
Serum_calcium_result | 1.477163 | 1.092262 | 1.997699 | 0.011311 | 1.033513 | 0.745413 | 1.432964 | 0.843271 |
Sex | 1.5336 | 0.9034 | 2.6034 | 0.1132 | ||||
23 | 22 | 33 | 39 | |||||
Laterality | 0.84882 | 0.669924 | 1.07549 | 0.174683 | ||||
Hemoglobin_result | 0.868924 | 0.667948 | 1.130369 | 0.295156 | ||||
N | 1.198348 | 0.761475 | 1.885865 | 0.434147 | ||||
Race | 1.102963 | 0.757493 | 1.605991 | 0.609215 |