Review Topical Sections

Atomic and nuclear surface analysis methods for dental materials: A review

  • The development of dental biomaterials is now on the rise, with new materials created at a high rate and in large variety. Yet, considerable effort is needed to improve their physical–chemical characteristics as well as their biotolerance, biocompatibility and osseointegration, and to extend their longevity. Foremost, the new dental biomaterials are confronted with surface phenomena occuring at their interface with the oral tissues and environment, which produce degradation by corrosion, dissolution and wear. To control them, nondestructive instrumental methods for the investigation of surface chemistry and physics are needed. A comprehensive insight requires also the mapping of elemental, chemical and structural information. Appropriate methods can be among other electron probe microanalysis, laser Raman spectromicroscopy, confocal fluorescence and atomic force microscopy. However, atomic and nuclear surface analysis methods qualify chiefly. They reach unsurpassed sensitivity in elemental analysis and are unique by depth profiling capabilities of layers 1 nm–100 µm thick and by surface mapping. Some techniques can provide also chemical and electronic information. Here we treat the most widely used ion beam analysis (IBA) and X-ray spectrometry (XRS) methods and some related techniques; all make use of incident and emergent beams of radiation and particles to analyze the specimen. Basic principles, practical aspects and applications in dental biomaterials’ research are reviewed comparatively for each technique, with its highlights and limitations. Noteworthy, new microprobe low energy heavy ions accelerators and electron synchrotrons are now commissioned; thus proton and X-ray microbeams are available for surface mapping at micrometer resolution. The reviewed applications cover ceramics, calcium phosphates, glasses, polymers, adhesives, composites, glass ionomers, endodontic materials, silver amalgam, alloys, titanium implants and their coatings, and oral tissues contamination with released elements (sometimes cytotoxic). The present survey is expected to be a representative sampling of a mature topic, typified by the sustainably high dynamics of publications.

    Citation: Eugen A. Preoteasa, Elena S. Preoteasa, Ioana Suciu, Ruxandra N. Bartok. Atomic and nuclear surface analysis methods for dental materials: A review[J]. AIMS Materials Science, 2018, 5(4): 781-844. doi: 10.3934/matersci.2018.4.781

    Related Papers:

    [1] Arbaz Sajjad, Wan Zaripah Wan Bakar, Dasmawati Mohamad, Thirumulu Ponnuraj Kannan . Characterization and enhancement of physico-mechanical properties of glass ionomer cement by incorporating a novel nano zirconia silica hydroxyapatite composite synthesized via sol-gel. AIMS Materials Science, 2019, 6(5): 730-747. doi: 10.3934/matersci.2019.5.730
    [2] Maocong Hu, Zhenhua Yao, Xianqin Wang . Characterization techniques for graphene-based materials in catalysis. AIMS Materials Science, 2017, 4(3): 755-788. doi: 10.3934/matersci.2017.3.755
    [3] Didar Yeskermessov, Bauyrzhan Rakhadilov, Laila Zhurerova, Akbota Apsezhanova, Zarina Aringozhina, Matthew Booth, Yerkezhan Tabiyeva . Surface modification of coatings based on Ni-Cr-Al by pulsed plasma treatment. AIMS Materials Science, 2023, 10(5): 755-766. doi: 10.3934/matersci.2023042
    [4] Raffaele Conte, Anna Di Salle, Francesco Riccitiello, Orsolina Petillo, Gianfranco Peluso, Anna Calarco . Biodegradable polymers in dental tissue engineering and regeneration. AIMS Materials Science, 2018, 5(6): 1073-1101. doi: 10.3934/matersci.2018.6.1073
    [5] R.C.M. Sales-Contini, J.P. Costa, F.J.G. Silva, A.G. Pinto, R.D.S.G. Campilho, I.M. Pinto, V.F.C. Sousa, R.P. Martinho . Influence of laser marking parameters on data matrix code quality on polybutylene terephthalate/glass fiber composite surface using microscopy and spectroscopy techniques. AIMS Materials Science, 2024, 11(1): 150-172. doi: 10.3934/matersci.2024009
    [6] Haiqing Yao, Fei Li, Jodie Lutkenhaus, Masaya Kotaki, Hung-Jue Sue . High-performance photocatalyst based on nanosized ZnO-reduced graphene oxide hybrid for removal of Rhodamine B under visible light irradiation. AIMS Materials Science, 2016, 3(4): 1410-1425. doi: 10.3934/matersci.2016.4.1410
    [7] Nikolay A. Voronin . Analysis of the mechanisms of deformation of topocomposites by modeling of the indentation load-displacement curves. AIMS Materials Science, 2019, 6(3): 397-405. doi: 10.3934/matersci.2019.3.397
    [8] Nhu-Tung Nguyen, Do Duc Trung . A study on the surface grinding process of the SUJ2 steel using CBN slotted grinding wheel. AIMS Materials Science, 2020, 7(6): 871-886. doi: 10.3934/matersci.2020.6.871
    [9] Supriya Rattan, Derek Fawcett, Gerrard Eddy Jai Poinern . Williamson-Hall based X-ray peak profile evaluation and nano-structural characterization of rod-shaped hydroxyapatite powder for potential dental restorative procedures. AIMS Materials Science, 2021, 8(3): 359-372. doi: 10.3934/matersci.2021023
    [10] M. P. Lavin-Lopez, L. Sanchez-Silva, J. L. Valverde, A. Romero . CVD-graphene growth on different polycrystalline transition metals. AIMS Materials Science, 2017, 4(1): 194-208. doi: 10.3934/matersci.2017.1.194
  • The development of dental biomaterials is now on the rise, with new materials created at a high rate and in large variety. Yet, considerable effort is needed to improve their physical–chemical characteristics as well as their biotolerance, biocompatibility and osseointegration, and to extend their longevity. Foremost, the new dental biomaterials are confronted with surface phenomena occuring at their interface with the oral tissues and environment, which produce degradation by corrosion, dissolution and wear. To control them, nondestructive instrumental methods for the investigation of surface chemistry and physics are needed. A comprehensive insight requires also the mapping of elemental, chemical and structural information. Appropriate methods can be among other electron probe microanalysis, laser Raman spectromicroscopy, confocal fluorescence and atomic force microscopy. However, atomic and nuclear surface analysis methods qualify chiefly. They reach unsurpassed sensitivity in elemental analysis and are unique by depth profiling capabilities of layers 1 nm–100 µm thick and by surface mapping. Some techniques can provide also chemical and electronic information. Here we treat the most widely used ion beam analysis (IBA) and X-ray spectrometry (XRS) methods and some related techniques; all make use of incident and emergent beams of radiation and particles to analyze the specimen. Basic principles, practical aspects and applications in dental biomaterials’ research are reviewed comparatively for each technique, with its highlights and limitations. Noteworthy, new microprobe low energy heavy ions accelerators and electron synchrotrons are now commissioned; thus proton and X-ray microbeams are available for surface mapping at micrometer resolution. The reviewed applications cover ceramics, calcium phosphates, glasses, polymers, adhesives, composites, glass ionomers, endodontic materials, silver amalgam, alloys, titanium implants and their coatings, and oral tissues contamination with released elements (sometimes cytotoxic). The present survey is expected to be a representative sampling of a mature topic, typified by the sustainably high dynamics of publications.


    Abbreviations: AES: Auger electron spectroscopy; CEMS: Conversion electrons Mössbauer spectroscopy; EBS: Elastic (non-Rutherford) backscattering spectrometry; EPMA: Electron probe microanalysis; EPR: Electron paramagnetic resonance; ERDA: Elastic recoil detection analysis; ES: Electron spectroscopy; ESCA: Electron spectroscopy for chemical analysis; EXAFS: Extended X-ray absorption fine structure; FAST: Forward alpha scattering technique; FRS: Forward recoil scattering; HIXE: Heavy ion induced X-ray emission; IBA: Ion beam analysis; LIBS: Laser induced beakdown spectroscopy; ND: Neutron diffraction; NEXAFS: Near-edge X-ray absorption fine structure; NGR: Nuclear gamma resonance; NMR: Nuclear magnetic resonance; NRA: Nuclear reaction analysis; OM: Optical microscopy; PAA: Photoactivation analysis; PALS: Positron annihilation lifetime spectroscopy; PBS: Proton (or particle) non-Rutherford backscattering spectrometry; PESA: Particle elastic scattering analysis; PIGE: Particle induced gamma-ray spectrometry; PIXE: Particle induced X-ray spectrometry; RBS: Rutherford backscattering spectroscopy; SEM: Scanning electron microscopy; SEM-EDX: SEM energy-dispersive X-ray spectrometry; SIMS: Secondary ions mass spectrometry; SR: Synchrotron radiation; SRXRF: Synchrotron radiation X-ray fluorescence; SRIXE: Synchrotron radiation induced X-ray emission; STIM: Scanning transmission ion microscopy; TEM: Transmission electron microscopy; XANES: X-ray absorption near edge structure spectroscopy; XPS: X-ray photoelectron spectroscopy; XRF: X-ray fluorescence; XRD: X-ray diffraction; XRS: X-ray spectrometry


    1. Introduction

    Like various other types of biomaterials, dental materials entered in a period of flourishing development, with spectacular success in the last decades illustrated among other by dental composites, glass ionomers and implants [1,2,3]. Even the selection of the right material by the practitioner becomes a more and more complex task [4]. But although new materials are created at a high rate and in a large variety, they did not yet replace completely the traditional ones, nor did they provide so far solutions with perfect biotolerance and biocompatibility. Therefore, research for the creation of new dental materials with improved properties is at its highest pace.

    Some of the most important problems which are confronting the new dental biomaterials are associated with surface phenomena which occur at their interface with the oral tissues and environment. These phenomena are in general different of those in the bulk; but at the same time they may open the gate for the penetration in the bulk of noxious agents, or for substance leakage from the bulk, which alter the dental biomaterial and limit its lifetime. Thus dental composites undergo polymerization shrinkage, an ubiquitous problem that can be reduced but not completely eliminated [1,2,3]. The narrow gap created in this way between the composite filling and the tooth allows a slow development of secondary caries around the fillings. Against this process, F, Ca and Sr ions able to prevent hard tissue demineralization are released from the biomaterial [1,2,5]. But at the same time with these ions' leakage other ions enter from saliva and a degradation of the biomaterial occurs. Another example is represented by the titanium alloy implants as well as by the metallic bridges and dowels which undergo slow corrosion and friction wear, and thus contaminate both the surrounding bone and teeth and the oral mucosa, provoking allergic reactions and other health impairments [6,7,8].

    Considerable research effort is devoted to reduce and eliminate the adverse processes by creation of new biomaterials or by conditioning of the biomaterial surface so as to provide it with protective and bioactive properties, making possible its integration with the tooth or bone structure. To this purpose, appropriate methods are needed to investigate the surface chemistry and physics phenomena in the dental materials and in the adjacent dental structures. Such surface phenomena take place in layers of various depths, ranging from a few nanometers (or even less) to some tens of micrometers (or even more) at the surface of the specimen. A wide choice of the analytical depth covering the whole above range is provided by ato-mic and nuclear surface analysis techniques and by a few other related methods (see, Section Abbreviations).

    This review article is an introduction to the most widely used ion beam analysis (IBA) and X-ray spectrometry (XRS) methods, as well as to a couple of electron spectroscopy (ES) surface analysis techniques. For each one, basic principles and some practical aspects as well as representative applications in dental biomaterials' research are presented. More explicitly, the following atomic and nuclear surface characterization methods and their applications are discussed in the following: X-ray fluorescence (XRF) [9,10,11,12], particle induced X-ray emission (PIXE) [13,14,15,16], particle induced gamma emission (PIGE) and nuclear reaction analysis (NRA) [16,17,18,19], Rutherford backscattering (RBS) and elastic recoil detection analysis (ERDA) [16,17,18,19,20,21,22], secondary ion mass spectrometry (SIMS) [23,24,25], X-ray photoelectron spectroscopy (XPS) and Auger electron spectroscopy (AES) [26,27], extended X-ray absorption fine structure (EXAFS) and X-ray absorption at the near edge structure (XANES) [28,29,30]. In addition to the above currently used methods, we also discussed briefly two nuclear techniques emerging recently in the field of dental materials applications, namely photoactivation analysis (PAA) [31] and positron annihilation lifetime spectroscopy (PALS) [32].

    These atomic and nuclear surface analysis methods provide detailed information on the elemental, chemical and electronic structure, as well as depth profiles of concentrations, porosity and defects of the analyzed thin layers at the specimen surface [12,16,18,19,20,21,22,23,24,25,26,27,28,29,30,31,32,33,34,35]. Selective combinations of such methods may give a most complete information on the structure and properties of these biomaterials. Many of the techniques discussed here are highly sensitive and cover a large dynamic range of concentrations, from trace to major analyzed constituents in the same spectrum. Applications of some of these methods in biology and medicine [36,37,38] and in selected topics of dental biomaterials research [39] have been reviewed. An excellent and comprehensive review of applications of surface analysis methods, mainly of XPS and SIMS to teeth, bones, dental and related biomaterials has been published before [40]. The present paper covers an enlarged pannel of methods while focusing on the last decades' applications in dental biomaterials' research.

    Due to the fact that in the last decades an increased number of electron synchrotron accelerators and of low energy accelerators of heavy ions (Van de Graaff, tandem, tandetron, linear, cyclotron) have been commissioned in many countries, for almost all of these surface analysis techniques the use of microbeams of X-rays and of accelerated protons or heavier ions (in the range 1–4 MeV/amu) are now available. In these facilities the microbeam scans the surface of the analyzed specimen and provides maps at micrometer resolution (i.e., near the optical microscopy resolution).

    All methods are almost completely nondestructive. Due to the absence of sample destruction these instrumental methods have an important advantage as compared to classical methods which destroy partially or completely the specimen. The same sample—with the possibility of selecting the same or a different area for the analysis—can be measured before and after an experimental treatment for its surface modification, gaining thus time, simplicity and additional insight.

    The applications of the methods discussed here cover a wide perspective on dental biomaterials, including ceramics, calcium phosphates, glasses, polymers, adhesives, composites, glass ionomers, silver amalgam, alloys and titanium implants. The interdiffusion processes and the contamination of the hard and soft dental tissues and of oral mucosa with elements released from some of these materials, as well as modifications of dental enamel and dentin surfaces with dental materials (using e.g., laser irradiation as an additional treatment) have also been reviewed here.

    One central aim of our endeavor was to provide the reader—especially the dental researcher using these methods—with a "big picture" perspective on the methods and their applications in dental biomaterials research. We hope that our review will find its interested readers and assist them with useful information.


    2. The methods: A brief overview

    The atomic and nuclear characterization methods can be classified as surface, near surface, thin layer, thick layer and bulk, according to the depth of the analyzed layer at the sample surface. They use incident beams of radiation and particles to bombard the surface of a specimen (usually solid) and analyze the emergent beams of radiation or particles. According to the nature of incident and emergent radiations, one obtains the classification shown in Table 1 based on a scheme proposed earler [23].

    Table 1. Atomic and nuclear surface analysis methods as defined by the incident and emergent beams of radiation and particles involved in the measurement.
    Emergent particles/radiation Incident particles/radiation
    Protons/Ions Electrons Positrons Photons Neutrons
    Protons/Ions RBS (EBS, PBS), PESA, FAST, FRS, ERDA, NRA, SIMS, STIM
    Electrons AES, SEM, TEM XPS (ESCA, UPS), CEMS
    Photons PIXE, HIXE, PIGE EPMA (SEM-EDX, EDX, EDS), SEM, TEM PALS XRF, SRXRF (SRIXE), XRD, EXAFS, XANES (NEXAFS), PAA, LIBS, EPR, NMR, FTIR, Raman, Mössbauer (NGR), OM, STXM NAA
    Neutrons ND
     | Show Table
    DownLoad: CSV

    A comparative illustration of the characteristics and potential of some of the most widely used atomic and nuclear surface analysis methods is presented in Table 2; similar overviews have been made by other authors (e.g., [23,35,38]). However, the numeric values given in this table are valid only as order of magnitude and in practice they depend on the specific nature and composition of the material as well as on the particularities of the experimental setup and on the parameters used. Most methods can use microbeams of accelerated protons (focused with magnetic quadrupole lenses) and X-rays (focused with special X-ray optics from synchrotron radiation) for mapping the detected species.

    Table 2. Representative scattering and spectroscopic methods for surface analysis based on atomic and nuclear interactions.
    Method Detected elements Depth profile Depth resolution Lateral resolution µm Detection limits1 Accuracy Information provided
    SRXRF, XRF Z ≥ 8 ≤100 µm ~10 µm 0.3–10 µm (in SRXRF) 10–100 ppm (XRF, 241Am excitation); 1–10 ppm (in SRXRF2) 10–30% (better accuracy with WDS-EPMA) Elemental analysis, depth profile, map
    PIXE Z ≥ 6 (optimum conditions) Z > 11 (currently) ≤100 µm ~10 µm 0.3–10 µm 0.1–1 ppm (thin targets); 1–10 ppm (thick targets) 2–30% Ibid.
    PIGE, NRA Li, Be, B, N, F, Si, O, C, P, Al, Na, Mg, S, Cl, … ≤100 µm (standard); 5–12 µm (resonant reaction) 0.1–0.8 µm (resonant reaction) 0.3–10 µm ≥0.03% 10–30% Ibid.
    RBS Z ≥ 5 ≤10 µm 5–100 nm 0.3–10 µm ≥0.1% 10–30% Ibid.
    ERDA Z ≥ 1 ≤2 µm 5–100 nm 1–10 µm ≥0.1% 10–20% Ibid.
    SIMS Z ≥ 1 1–2 nm (static) 1–2 µm (dynamic) 3–30 nm 1–60 µm 0.01 ppm (Li)–24 ppm (Hg) 10–30% (better with surface polishing) Ibid. + Chemical groups and compound detection
    XPS Z ≥ 3 ~1 nm ~0.3 nm 0.2–10 µm ~0.1% 10–40% Elemental analysis + valence and bonding
    AES Z ≥ 3 ~1 nm ~0.3 nm 0.2–10 µm ~1% 20–40% Ibid.
    EXAFS, XANES Z ≥ 8 1–10 nm ~0.1 nm 0.3–10 µm 1–10 ppm (with SR2) 10–20% Valence, bonding, structure
    1 Minimum detection limit in optimum conditions.
    2 Synchrotron with wigglers and undulators generating a 109–1010 s−1 µm−2 photon flux.
     | Show Table
    DownLoad: CSV

    As shown in Table 2, there are a number of surface and thin layer analysis methods for elemental analysis. The most sensitive are suited for the analysis of trace elements (below 0.5% and down to 0.01–0.1 ppm by weight); this can be done by SIMS in surface layers of a few atoms or molecules and by PIXE in thin layers up to tens of millimeters. However, SIMS is suited especially for semiquantitative analysis (which may be often sufficient given the high sensitivity and the capability of detecting all elements in the periodic table). But elemental analysis by comparatively less sensitive methods can give valuable complementary data. Thus PIGE, NRA, RBS and ERDA are essential for the analysis of low Z elements which are not detected currently by PIXE. When the methods are used for major (above 5%) or minor (0.5–5%) elements in certain dental biomaterials or in the pure components of them, high sensitivity is not required. For instance for P and Ca analysis (yielding the highly relevant Ca/P ratio) in calcium phosphates, apatites and other ceramics and in glasses, as well as for F quantitation in fluorine-releasing dental materials and teeth, a comparatively lower sensitivity is not a major drawback, as these elements are usually present in relatively high concentrations in the above materials.

    The information provided by some of the methods included in the review gives also insight at the molecular level. Methods like EXAFS, XANES, XPS, AES as well as SIMS gather valuable and detailed data on molecular groups' structure, valence state of atoms and chemical bonding of the species detected in a biomaterial.

    The list of Table 1 is far from complete, as laser, optical and most mass spectrometry methods (excepting SIMS) as well as microscopy techniques were leaved aside. The number of surface analysis methods is ever increasing, and we mentioned only the basic ones. Each has its highlights and limits, and only combinations of methods can give a comprehensive characterization of biomaterials. The information they provide is complementary and the multitechnique approach is the most rewarding [12,16,18,19,20,21,22,23,33,34,35]. Some of the IBA and XRS methods presented here have been compared in detail with other physical and chemical techniques of analysis [16,41].

    In the following we will discuss just the most important atomic and nuclear methods of surface characterization and their applications in dental material research.


    3. XRF and SRXRF


    3.1. The methods

    Overview. X-ray fluorescence (XRF) is a rapid, nondestructive, multielemental atomic analysis method based on the detection of the characteristic X-rays emergent from a sample under the bombardment with a primary beam of high energy radiation. XRF is similar to other methods belonging to X-ray spectrometry (XRS) and to PIXE, but unlike PIXE which hits the target with protons and heavier ions, XRF uses X or γ rays for the bombardment. Thus while PIXE analyzes a thin layer at the surface of the sample because the range of charged particles in matter is limited, XRF may penetrate up to millimetres down the surface. XRF is less sensitive than PIXE by one order of magnitude, but the detection limits depend on element, sample composition and structure, and instrumentation. A comprehensive and clear comparison of XRF and PIXE is available [16].

    At various levels and detail, the topic of XRF principles, instrumentation, practice and applications in different fields is widely covered in reviews [12,42] and books [10,11,16,39,43,44,45]. Various biomedical applications of XRF are quoted in comprehensive reviews of the fields of X-ray spectrometry and surface analysis [9,12,21,38]. XRF analysis was applied in studies of teeth [46,47] and dental materials [6,39,48,49,50,51,52,53,54,55,56,57,58,59,60,61]. Portable XRF instruments [62] open a new line of development [63], particularly useful in forensic investigations [48,49,64,65,66,67,68]. The applications of µ-SRXRF—the synchrotron radiation microprobe version of XRF—in biomedical and dental research and for biomaterial characterization [6,7,69,70,71,72,73] provide highly informative 2D elemental maps. Here we discuss XRF in some detail as certain experimental aspects are relevant also for PIXE and PIGE.

    Principle of XRF. At the core of XRF stands Moseley's law, which says that the square root of the energy of characteristic X-rays of an element is approximately a linear function of the atomic number Z. This makes possible the unambiguous analysis of chemical elements based on their specific spectra [9,10,11,12,16,39,43,44]. The phenomena underlying the origin of the X-ray emission spectra are similar in XRF, EPMA and PIXE. For an element with Z ≥ 3, following the absorption of an X-ray or γ photon, an electron is ejected by photolectric effect from the K (n = 1) shell and leaves here a vacancy, provided that the energy of the incident photon exceeds a minimum threshold. Subsequently, an electron from the L or M shell will occupy the vacancy in the K shell, and a characteristic X-ray radiation quantum of the Kα or Kβ lines will be emitted. The mechanism is somewhat similar to the optical emission spectra in visible and UV. However, as compared with the optical emission spectra, used for instance in the LIBS method, the X-ray spectra are much more simple and interference of lines from different elements present in samples with complex elemental composition is much less common. In fact laser induced techniques like LIBS still have problems with the quantification of concentrations [74]. This recommends XRF for the analysis of multielemental samples with previously unknown composition. Dental alloys made of metals with Z > 20 can be easily analyzed quantitatively by XRF. For restorative and other dental materials which contain great amounts of XRF-invisible elements with Z = 1–13, XRF may provide a fast qualitative or semiquantitative analysis.

    EDX and WDS spectrometers. There are two basic types of XRF spectrometers—wavelength-dispersive (WDS) and energy-dispersive (EDX). They differ by the type of device employed for analyzing the secondary X-rays emitted by the sample. The EDX spectrometer uses an energy-dispersive semiconductor crystal detector. Because the detector is protected by a thin beryllium window which absorbs soft X-rays, the detection of elements is possible usually only for elements with Z = 11–92 (Na to U). WDS uses a curved crystal as a diffraction grating for the analysis of X-rays and a gas proportional counter with a thin Mylar window for detection; it can also see elements as light as F (Z = 9). The energy resolution of EDX is rather poor, about 150 eV at 5.9 keV (Mn Ka), while for WDS is as good as 5 eV or better. But in EDX the spectrum of multielemental samples is acquired quickly in a simultaneous mode, while a WDS spectrometer performs a slow sequential analysis. Although PIXE and µ-SRXRF have better sensitivity (lower detection limits) than XRF, WDS-XRF excited with accelerated electrons (WDS-EPMA) showed a better precision and accuracy than the former two methods ([75], see also [39]). Thus PIXE should be preferred for sensitivity, WDS-XRF for accuracy, and EDX-XRF for speed and convenience.

    Primary radiation sources and sensitivity. The source of primary excitation radiation may be a gamma-emitting radioisotope, an X-ray tube, or a synchrotron facility. The sensitivity of XRF analysis depends on the primary radiation source: Down to 1–10 mg/kg for synchrotron radiation, somewhat less for X-ray tube and 10–100 mg/kg for a gamma radioisotope source (1 mg/kg = 1 ppm). Every type of source has its advantages and drawbacks.

    Radioisotope excitation as illustrated by the 241Am/237Np source may spoil the recorded spectrum not only by its own radiations (two main γ rays of 26 and 60 keV and other weaker γ lines, as well as the L X-ray lines of Np in the 14–21 keV range), but also by the 10.6–14.8 keV L lines of Pb X-rays excited in the source's protection walls [16]. Thus the artifactual lines of this particular source would interfere for example with the Kα lines of Sr and Zr, two elements frequently present in composites and other dental materials. However, the radioisotope excitation may work well for major elements. For instance, we studied by EDS-XRF excited with an 241Am/237Np source the fixation of Ag+ ions from an AgNO3 solution on dental enamel surface, and preliminary data suggest that Ag increased and Ca decreased according to power functions of the incubation time (Preoteasa EA, Gavrilus M and Preoteasa ES, unpublished, presented in [39]). The same type of curves was obtained by optical microscopy techniques for slow Ag penetration in dental composites [76].

    Rayleigh and Compton scattering of primary radiation. Whether with WDS or EDS spectrometers, all XRF spectrometers have the disadvantage that the incident radiation is scattered both coherently (Rayleigh) with the energy unchanged and incoherently (Compton) at lower energy, giving intense background lines at the high energy end of the spectrum. This effect is strong especially with the high intensity synchrotron radiation.

    Continuous and discontinuous background. The main drawback of X-ray tubes excitation is the backscattered continuous background from the Bremsstrahlung of the X-ray tube. This will reduce the analytical sensitivity, especially in the low-energy part of the spectrum. Moreover in XRF spectrometers excitated with an X-ray tube the anode, made for instance of Rh or Ag, will produce its characteristic Rayleigh and Compton lines in the spectrum, which will hinder practically the analysis of Ru, Rh, Pd, Ag, and Cd unless appropriate cut-off filters are used. Some of these metals are present in dental alloys like Palliag and dental gold and in dental Hg amalgam. Excitation with monochromatic synchrotron X-ray radiation eliminates much of this drawback, because the Bremsstrahlung from the source is absent and the background is much reduced, excepting the Rayleigh and Compton lines.

    False peaks. With any type of source, XRF-EDX spectra accumulated with common semiconductor (and gas proportional) detectors will contain two kinds of false peaks. These are the pile-up peaks with energies equal to the sums of the energies of two or three quanta, and the escape peaks with the energy reduced by the characteristic X-ray energy of the detector's active medium, e.g., Si or Ge. The false peaks can overlap with characteristic lines of analyzed elements.

    Thick samples and matrix effects. XRF of thick samples is of particular interest for most samples of dental materials. It is characterized by a loss in sensitivity as compared to thin samples, caused mainly by an increase of radiation background. This is due among other to Bremsstrahlung produced by photo- or Compton electrons ejected from atoms inside the sample material under the action of the primary X-rays.

    Other problems in the quantitative analysis of thick samples are caused by the so-called matrix effects. For some elements in a multielemental sample they can diminish the intensity of X-ray fluorescence by self-absorption in the specimen and thus reduce sensitivity; for other enhancement effects occur, caused by the excitation of analyte's characteristic lines due to the radiation from other elements in the sample. Owing to the matrix effects, in thick samples the X-ray intensity is no longer proportional to the element's concentration. The matrix effects depend on the composition, structure, heterogeneity, surface roughness and geometry of the sample. They complicate the analysis and important corrections are needed for accounting them. Thus complex calculations starting from fundamental parameters, or reference materials with similar composition and structure are required. One major difficulty in the analysis of thick samples of dental materials, both by XRF and by other atomic and nuclear methods is just the lack of standard materials and certified information on sample's composition [39,77]. Special precautions are to be followed for the preparation, certfication and proper use of standards [9,78].

    Non-invasive method. No sample preparation is needed for XRF analysis. One important advantage of XRF techniques is that it doesn't require the covering of the electroinsulating samples with a thin conductive layer. The XRF analysis of any type is completely non-destructive and almost totally non-invasive; it does not burn or heat significantly the thin or less thin analyzed surface layer of the irradiated specimen and there are no macroscopically visible effects. Only at a microscopic level the primary X-rays may produce radiolysis effects such as photodegradation in the polymers from dental composites, or radical ion formation in Ca phosphates or glasses, which can be studied by specific methods such as EPR.

    X-ray fluorescence with synchrotron radiation (SRXRF). In circular accelerators the particles emit electromagnetic radiation, as any charged particle when is accelerated. A synchrotron is a circular electron accelerator built specially for producing intense X-rays and less energetic radiation. When the electrons are moving at relativistic speeds (between 0.2 and 20 GeV energy), the generated radiation is known as synchrotron radiation (SR). It is characterized by a continuous spectrum from far IR to X-rays of about 100 keV, by a high intensity and extreme directivity, i.e., brightness, and by polarization. Today the synchrotrons are the brightest sources of X-rays and of lower energy radiation. In the X-ray domain its brilliance is unrivalled, several orders of magnitude higher to that of the best X-ray tubes (fluxes of ~1013 photons sec−1 mrad−1). The synchrotron provides monochromatic radiation of continuously varied energy and, as mentioned, without Bremsstrhlung.

    The intensity of the synchrotron radiation increases when the deflexion radius decreases. SR is produced with deflection magnets of much lower radius as compared to the whole machine, or with devices called "wigglers" and "undulators" made of many permanent magnets with alternating polarities, which make the electrons move along semicircular trajectories of even shorter radius. In the X-ray domain SR offers excellent conditions for many surface analysis methods like XRF, XANES, EXAFS, XPS, and Auger spectroscopy. It allows also best quality measurements for spectroscopy and mapping by FTIR, or by optical methods in the far UV region.

    Synchrotron radiation X-ray fluorescence, SRXRF (or synchrotron radiation induced X-ray emission, SRIXE) uses 16–19 keV radiation for excitation. Both Rayleigh and Compton scattering by the sample give intense background lines at the high energy end of the spectrum, which spoil the detection limits because of contributing to the overall background and of saturating the detector. However, SR is highly polarized in the orbital plane of the electrons, which allows reduction of the scattering by use of experimental setups with special geometry. Moreover, the energy of synchrotron excitation X-rays may be varied continuously so as to favor the excitation of selected elements and improve the sensitivity of their analysis.

    Taking advantage of the directionality and monochromaticity of synchrotron radiation, X-rays have been collimated to microbeams below 10 µm with X-ray optics (like capillaries, the focusing crystal monochromator, the pinhole collimator, the focusing mirror at grazing incidence, multilayer spherical reflectors, Bragg-Fresnel lenses). In µ-SRXRF the lateral resolution of the X-ray microbeams is usually not better than 10 µm although it may be slightly below. This resolution is not sufficient for mapping of subcellular components [21], but proved for instance really powerful for the analysis of dental calculi [69] or for mapping Zn in Ca in sectioned and polished bone [70].

    The photon flux in the microbeam (around 107 photons sec−1 µm−2) generated with deflexion magnets allows mapping of minor or most concentrated trace elements (like Zn in bone, > 60 ppm), but is not enough for lower trace elements at < 10 ppm levels. But detection limits of 1–10 ppm and even below 1 ppm may be attained in synchrotrons using wigglers and undulators instead of bending magnets, which increase the photon flux with 2–3 orders of magnitude. In spite of the high X-ray fluxes and high radiation doses, µ-SRXRF produces no macroscopically visible damage at the sample surface down to a micrometer scale, in contrast to the corresponding IBA method µ-PIXE.


    3.2. Applications of XRF and SRXRF

    Dental alloys and their fate in the oral cavity. XRF is a fast and reliable method for the analysis of dental alloys, as illustrated for gold alloys (including dental) and gold alloy reference materials [51]. In a review [6], innovative applications of XRF in the dental surgery for the diagnosis of allergies related to metallic dental restorations are described. Using a silicon point or a disk made of oxides and carbides of Al, Si and Ti, a microsample amount of about 10 µg is taken from the metallic dental work and analyzed on spot with the XRF spectrometer, except for the Ti alloys. Thus Hg–Ag–Sn amalgams as well as Ni–Cr and Au–Ag–Pd–Cu alloys have been identified [52]. The same group developed a micro-focused X-ray source with capillary focusing X-ray optics at a lateral resolution of 10–100 µm and applied it to evidence elemental distribution of oral mucosa in contact with a pure Ti cover screw from a dental implant. Particle-like and homogeneous deposits of Ti were evidenced in the mucosa; subsequent XAFS analysis identified the former as metallic Ti debris and the later as TiO2 resulted by oxidation in the oral environment [53]. Using a portable XRF spectrometer we determined with an accuracy within a few percents the composition of the Fe–Cr–Ni dental stainless steel Wipla, which appeared to be close or identical to the austenitic stainless steel SAE 303; moreover early corrosion changes of alloys produced in the oral environment were evidenced (Preoteasa EA, Constantinescu B, Chiojdeanu C, unpublished).

    Dental ceramics. Several dental bioceramics have been analyzed with XRF, XRD, ICP-OES and SEM [54,55]. In particular, the mechanical and microstructural properties of monolithic ZrO2 were investigated using XRF, XRD and SEM [56], while the degradation of dental ZrO2-based materials after hydrothermal fatigue was studied by XRD, XRF, and FESEM [57].

    A parenthesis: Lead in children teeth. Although not directly related to biomaterials, it is worth mentioning a dental application for the evaluation of lead exposure in children by XRF measurements of Pb K-lines in shed teeth [47]. A development of instrumentation for a similar use in general medicine is an apparatus for in vivo tibia bone Pb concentrations assessment by XRF using excitation with a 109Cd source [79].

    Portable XRF spectrometers and their limitations for standardless XRF analysis. Recently some manufacturers marketed portable XRF spectrometers equipped with a miniature X-ray tube with Ag or Rh anode and with semiconductor Si PIN (positive-intrinsic-negative) diode detector cooled with Peltier elements. This device is aimed mainly for field applications; it may detect elements starting from Cl (Z = 17). Small-size X-ray sources based on pyroelectric crystals generating up to 30 kV have been achieved in the last decade for portable XRF spectrometers [62]. In dentistry and other biomedical fields much interest was shown for the high-tech portable XRF spectrometers. These instruments are equipped with different software programs for concentration evaluation, which include fundamental parameters (FP) analysis, Compton normalization (CN) and empirical calibration. The first two are recommended for specific types of samples, e.g., dental alloys made of metals starting with Ti (Z > 22). The later mode may be applied also for Ca detection and requires reference samples (standards), but remains the most reliable approach for handheld XRF spectrometers (and for XRF analysis in general). Portable instruments are preferred for the speed of analysis and allow the collection of a very large amount of data as shown in the elemental analysis of Ca-rich samples from different animal species [63]. Figure 1 shows the XRF spectrum of a calcium hydroxide material for endodontic treatments recorded with a portable spectrometer. Cl, Ca and Ba concentrations confirmed the nominal composition, and traces of Sr (detected also by PIXE [80]) were evidenced in addition.

    Figure 1. XRF spectrum of the CalaseptTM calcium hydroxide preparation for endodontics (Nordiska Dental, Angelholm, Sweden). The spetrum was taken with a hand-held XRF instrument equipped with a semiconductor detector cooled with Pelletier elements and an X-ray tube with Ag anode (Preoteasa EA, Suciu I, et al., unpublished).

    Given the complex and heterogeneous nature of some dental biomaterials like composites and glass ionomers, which contain large amounts of XRF-invisible light elements, it is not uncommon that various results of standardless analyses agree only qualitatively or semi-quantitatively. Differences may occur between a portable XRF spectrometer and stationary laboratory XRF instruments [58,59,60]. Moreover XRF and EPMA can disagree, e.g., by 35–40% for Ca and more for Bi in some endodontic materials.

    As a conclusion, the accuracy of concentrations evaluated by standardless XRF analysis with portable instruments remains lower in the case of dental materials with complex composition and granular structure, as compared to the analysis of dental alloys of Ti and heavier metals. Portable spectrometers may be used also for the analysis of Ca-rich materials but only with standard reference materials. In brief, portable EDX-XRF spectrometers provide a powerful tool for field investigations where they are good enough, however do not yet meet the quality requirements of laboratory analysis [16].

    Forensic applications: Dental composites. One field of portable instruments XRF applications which develops fast refers to dental applications in criminology [65,66]. However, here validation is of major interest for distinguishing osseous and dental tissue from non-bone material of similar chemical composition and for determining the specimen's origin. This requirement applies both to laboratory [67] and portable [68] XRF spectrometers. We suggested before (Ref. [50]) that the examination of dental composites by PIXE, ERDA and XRF may be used for customs, commercial and forensic applications. In fact the XRF method with portable instruments has been used for the fast identification of dental composites, e.g. on air crush or other forensic investigations [48,49]. One major problem with dental composites and other dental materials is, besides their complexity, the lack of appropriate standards, as mentioned. The qualitative distinction of various composites by XRF is obviously very useful for practical forensic purposes; but, given the limitations of handheld instruments, the accuracy of concentrations analyzed without proper reference materials remains to be proved. Nevertheless, XRF made possible a very useful data base of dental composites according to their qualitative elemental composition.

    Endodontic and orthodontic materials. Recent interest emerged for the characterization of root canal repair cements, sealers and obturation composites used in endodontics, and of orthodontic glass ionomer cements. Such studies of composition and microstructure used XRF together with XRD, SEM, FESEM, FTIR and NMR [51,52,54,55,56,57,58,59,60,61]. Other methods related to XRF which contributed to the characterization of the endodontic materials, include scanning electron microscopy equipped with energy dispersive X-ray analysis, SEM-EDX/EPMA [81,82,83,84,85,86], environmental scanning electron microscopy with energy dispersive X-ray analysis, ESEM-EDX [87], SEM with wavelength-dispersive X-ray spectroscopy, SEM-WDS microanalysis [88], PIXE [85], XPS [83,84,85,86], XRD [84,85,86], inductively coupled plasma optical emission spectroscopy, ICP-OES [83,89], atomic absorption spectrophotometry, AAS [81] and FTIR [86]. This large palette of investigations makes the endodontic materials some of the best characterized dental biomaterials and underlines the value of multitechnique analysis.

    SRXRF and µ-SRXRF applications. By the large dimensions of a synchrotron radiation facility, synchrotron X-ray fluorescence analysis (SRXRF) is "the extreme opposite" [62] to the analysis with a desktop or handheld XRF spectrometer. SRXRF is still in its youth, but unmistakable signs appear evidencing that it approaches maturity. Ektessabi [71] synthesizes in a book the applications of synchrotron radiation in cell microbiology and medicine, and recently Uo and colleagues [6] review the field of dental and other medical applications of XRF and SRXRF. The remarkable advantages of SRXRF for trace analysis in cells and tissues—excitation with monochromatic X-rays of high intensity, low background (absence of Bremsstrahlung from the X-ray tubes), and focused beam down to 1–10 µm—made possible outstanding SRXRF applications. Remarkable results were obtained in the field of adverse effects associated with metals released from a particular type of dental biomaterials, i.e., alloys for dental works and Ti implants [8]. Sugiyama et al. [7] described the detection of trace metallic elements in oral lichenoid contact lesions using SR-XRF, PIXE and XAFS; the distribution of trace metallic elements in oral mucosal tissues was presented in detail [6]. The mucosa was taken from an oral lichenoid lesion (OLL). The metals detected in the mucosa derived from an Ag–Au–Pd–Cu alloy dental metallic restoration and they were suspected to be the cause the OLL disease. In a thesis [72] SRXRF together with XANES and EXAFS was used to describe the distribution and accumulation of Ti debris in the peri-implant environment and documented their pro-inflammatory impact.

    In the more general field of dental research SRXRF performed in the analysis of dental calculi [69]. The potential of SRXRF for similar studies was explored also in other fields of medicine and biology. Among other, such applications included studies of Zn, Ca and P distributions in normal bone [70], of metal-ion release from a hip replacement prosthesis [73] and of trace element distribution in Menkes disease [90] and in cancer [91,92]. One can be sure that the SRXRF study of dental biomaterials offers a large and open field for future research.

    XRF, while being the first atomic analysis method and leading the way to the other methods, is now rejuvenated with the portable XRF spectrometer and with the µ-SRXRF technique. Conventional and portable XRF show quantitative performances for dental alloys. The portable XRF spectrometer is mostly a valuable field instrument for qualitative and semiquantitative identification of dental biomaterials in forensic applications and for fast screening of materials' composition. µ-SRXRF proved best in mapping friction wear debris and corrosion leaking from Ti implants and other dental metallic restorations in oral mucosa and in hard dental tissues. New applications in the field of dental biomaterials are expected with the progress in µ-SRXRF synchrotron techniques.


    4. The PIXE method

    Like other nuclear and atomic analytical methods, particle-induced X-ray emission (PIXE) is a multielemental, conveniently specific, fast, and relatively nondestructive instrumental technique, able to identify the atomic species and to determine their amounts in the target. In principle PIXE is very similar to XRF, except that the excitation of the analyzed atoms in the sample is made with protons or heavier ions of 1–4 MeV/amu instead of X- or soft gamma rays. The broad beam method [9,13,14,15,16,21,39,93,94,95,96,97,98,99,100] became popular with the development of small nuclear accelerators (Van de Graaff, tandem, tandetron, pelletron, linac, cyclotron), which are ideal for accelerating protons and heavy ions in this range of energy. Micro-PIXE is the corresponding method which maps the elemental distribution by scanning the sample surface with a focused microbeam [101,102,103]. The additional experimental details of both techniques presented below [104,105,106,107,108,109,110,111,112,113,114,115,116,117,118,119,120,121,122,123,124] and the applications of PIXE µ-PIXE (and of complementary methods) to the study of dental materials [80,87,117,118,119,120,121,122,123,124,125,126,127,128,129,130,131,132,133,134,135,136,137,138,139,140,141,142,143,
    144,145,146,147,148,149,150,151,152,153,154,155,156,157,158,159,160,161]
    go hand in hand.


    4.1. The methods

    Overview. Among the particular advantages of PIXE one may note first of all its sensitivity for trace elements, which is due to the fact that the cross section for X-ray production is large and the background contribution from Bremsstrahlung is low. PIXE probes the surface and near-surface layers of materials at depths between a few tens and one hundred micrometers; this is of prime interest in the study of biomaterials and teeth. The analysis does not require surface polishing and the preparation of biomineral specimens in the form of thick targets is remarkably simple. Depth profile analysis may be performed with PIXE at a rather modest depth resolution, but it may be refined if this technique is combined with other methods like RBS, ERDA and/or sample etching techniques. In μ-PIXE, scanning of the specimen surface by a proton microbeam is able to map the lateral distribution of elements at μm resolution. With the use of capillary lenses for capturing the X-rays from different depths beneath the surface, the reconstruction of the elemental 3D distribution in the surface layers of the analyzed specimen becomes possible. The method and its relation with other techniques as well as its applications are abundantly reviewed [9,13,14,15,16,21,39,93,94,95,96,97,98,99,100,101,102,103]. In Ref. [16] theoretical and experimental details on the possibilities and limitations of PIXE are given, in particular on thick target analysis, which is the usual case in the study of biomaterials. Here PIXE will be presented in some detail because many aspects are relevant also for other IBA methods, mainly PIGE.

    Nondestructive method. Bombardment with protons of 2.5–3.5 MeV at currents of 10–100 nA on a 2 mm-diameter spot produces a global surface heating of the target of 100–300 ℃ in broad-beam PIXE. The surface temperature raising should be much higher locally around each proton's track. Our µ-SR-FTIR measurements evidenced important chemical alterations of the organic polymers in dental composites (Preoteasa EA, Eichert D, Preoteasa ES, unpublished). Moreover in µ-PIXE the current density is 3–4 orders of magnitude higher than in broad-beam PIXE, and µ-PIXE of dental composites burned much more the irradiated area. During PIXE measurement, inaccuracy due to sample surface degradation may reach 30% [104]. Nevertheless, due to the absence of destruction, the sample can be analyzed several times, selecting the same or a different area for the irradiation.

    Detected elements. Energy-dispersive detection PIXE is usually able to analyze concentrations of various elements with atomic number from Z = 11 (Na) or 12 (Mg) on; lighter elements are not detected by PIXE if the detector is placed in air, so that there are two Be windows between the specimen and the semiconductor crystal. The related technique, PIGE, as well as RBS, are routinely performed simultaneously with PIXE in IBA measurements to detect some light elements in addition. New development in thin-window EDX detectors placed internally allows the PIXE detection of light elements starting from C and even B (Z = 6 or 5). However sensitivity for light elements is low. A simultaneous recording of the PIXE, PIGE and RBS spectra of a hydroxyapatite sample (Figure 2) illustrates the complementarity of the IBA surface analysis techniques for the detected elements. At the same time a few elements are detected by two of the methods or even by all three.

    Figure 2. Display of µ-RBS (up), µ-PIGE (center) and µ-PIXE (down) unprocessed spectra of hydroxyapatite recorded simultaneously by bombardment with a 3 MeV proton microbeam focused to a ~4 µm spot. The spectra were taken with a multimethod IBA setup at Forschungszentrum Rossendorf, Dresden (Preoteasa EA, Grambole D, Herrmann F, et al., unpublished).

    Basic experimental precautions. Setup geometry. In order to reduce chamber background levels, a skillful use of materials (ultra pure aluminum, graphite, Teflon) is important, to produce negligible radiation when struck by stray particles [105]. Beam collimators made of carbon will reduce or eliminate a potential source of intense background radiation, and rounded edges design of the collimators may reduce slit scattering effects. For proper beam alignment, current-readable collimators are convenient. For a quantitative analysis, a homogeneous beam is necessary. Instrumentation requirements for PIXE and RBS have been described [13].

    Placing the X-ray detector perpendicularly to the beam and sample-detector distances of only a few centimeters are used currently, but other geometries allow a lower Bremsstrahlung or Compton background (the latter is important in samples which emit γ rays under proton bombardment). A target surface perpendicular to the sample-detector direction generally gives the smallest X-ray absorption in the sample, and makes possible an optimal sensitivity of low-Z element analysis [105].

    Metal alloys: "Simple" analysis. The elemental concentrations in certain "simple" electroconductive samples, such as stainless steels, Ti alloys and alloys of transition metals used in dentistry for crowns, bridges and implants—where all elements emit detectable X-rays—can be calculated from the PIXE spectra by assuming Σci = 1, even without knowing the detector solid angle and proton number (Smit Z, personal communication, 2011). But even so, the analysis of an alloy with more than three component metals requires subtlety [16], as sometimes differences below 1% may influence drastically the properties of the alloy. Moreover, the PIXE analysis is less simple for an alloy containing very light PIXE-invisibe elements like Be, B and C.

    "Difficult" dental biomaterials. In contrast to the relatively simple situation of alloys, the quantitative PIXE analysis of some dental biomaterials like composites, glass ionomers, and endodontic materials is confronted with many difficulties. They are electro-insulating, are usually prepared as thick targets, are made of heterogeneous mineral micro- and nano-granules embedded in a polymer resin, contain large amounts of PIXE-invisible elements, and no appropriate standards exist so far for them [77]. Their only advantage is that specimens with a flat and reasonably smooth surface may be easily prepared on a glass plate. From the viewpoint of the incident proton beam and the emergent X-rays, they may be looked at as a collection of opaque granules embedded in a quasi-transparent matrix.

    Non-conducting thick targets. Beam integration. Many dental materials and the hard dental tissues are non-conducting and accumulate charges under the particle bombardment. The target should either be covered by a very thin film of carbon or sprayed with electrons in order to maintain electrical neutrality. This is the only sample preparation needed for thick samples and it is necessary to prevent electrical discharges which accelerate secondary electrons, leading to bursts of Bremsstrahlung which enhance the background in the spectra [93]. In fact the main cause of background in PIXE analysis is the secondary electron Bremsstrahlung [16].

    The accuracy of PIXE analysis requires precise beam integration [105]. For thick insulating targets the following solutions may be used: An electrically insulated irradiation chamber connected to an electrometer [101], diverting of a beam fraction to a ionization chamber [93], measurement of X-rays produced by a Ta or Au window or chopper [106,107], small fraction of projectiles backscattered from a thin metal foil, e.g. self-supporting Au 150 pg/cm2 [108], etc.

    Matrix effects in thick target PIXE. Thick targets exhibit important matrix effects due both to the slowing of projectiles accompanied by the variations in the ionization cross section, and to self-absorption and enhancement of X-rays in the sample. Dedicated softwares for the analysis of thick target PIXE spectra based on fundamental parameters like GUPIX [105,109] are needed. The available software packages, e.g., GUPIX and AXIL [93] have to account for various factors such as the secondary fluorescence, autoabsorption of X-rays by the target and filters, escape peaks and pile-up in the detector, stopping power of the projectile in the target and the energy-dependent cross-section of X-ray production [16]. For instance the self-absorption in dental enamel has been calculated [101,110] and the cross-section of X-ray production shows an exponential decrease as a function of atomic number. Programs like GUPIX and AXIL calculate the X-ray yield by numerical integration and list directly the estimated concentrations. Intercomparisons of PIXE software packages are available ([99] briefed in [39]).

    Stopping power and Bragg's Rule. The stopping power as given by the Bethe-Bloch equation is calculated by the package SRIM/TRIM [111]. The main contribution is given by Bragg's Rule: The stopping of a compound may be estimated by the linear combination of the stopping powers of individual elements. In compounds usually deviates less than 20%, and the chemical bonds of the compound would then contain the necessary stopping power correction of protons calculated by SRIM. In general, the stopping powers and the cross-section of X-ray production are not precisely known for all elements [16,17]. Moreover when analyzing an unknown material the compounds formed by the detected elements are in general not known.

    The range of projectile particles in the target. This amount is a function of the stopping power and is affected by the imprecise knowledge and management of the later. Typical values of proton ranges, e.g., in carbon, quartz and aluminum are of 74, 83 and 80 µm, respectively [105]. In stoichiometric hydroxyapatite, HA (Ca10P6O26H2 with < Z > = 11.36), for protons of 2 MeV an approximate formula estimates a range of 35 µm, while with Monte Carlo simulations (Chris Jeynes, Surrey, UK, personal data, 2008; [112]) a range of 50 μm was found. We made an evaluation of the range of 3 MeV protons in hydroxyapatite based on the SRIM/TRIM data and using the Bragg rule, and a range of 90 µm was found; while when using the same scaling formula as above a range of 69 µm was estimated [39]. Thus the agreement between various predictions of the maximum proton range in HA is within 25–30%, and rough formulae are very imprecise.

    Materials with granular structure. In composites and other dental biomaterials of granular structure, the maximum analyzed depth by 3 MeV protons is variable because of the very heterogeneous structure, with relatively opaque grains of different size embedded in a relatively transparent matrix. For instance in µ-PIXE, if the microbeam analyzes the organic matrix of a composite made, say, of polymethylmetacrylate with < Z > = 4 in a grain-free domain, the approximate scaling equation gives a range of 90 µm; but if the focused proton beam hits an embedded YbF3 grain, as e.g. in the Tetric Ceram composite, with < Z > = 24.25, the corresponding range is 57 µm. Thus in µ-PIXE of granular dental materials, the analyzed depth may vary appreciably from one point to another. Concurrently, the stopping power and the ionization cross section for protons, as well as the mass attenuation coefficient for X-rays in the mineral particles and in the surrounding organic polymer are completely different. Therefore the definition of average values in the composite (e.g., for the range of protons and for the yield of X-rays) is conceptually difficult in µ-PIXE and has an experimental meaning only for broad beam PIXE. Also, the analysis of the PIXE spectra in terms of concentrations as a result of the experimental averaging is more or less a rough approximation. A model based on a randomly distributed structure of inhomogeneities is employed to calculate the deviation from the normal homogeneous thick-target correction. In the model the size of the beam spot must be sufficiently large with respect to the inclusions [113].

    Surface roughness. Just as in XRF analysis, besides granular structure, surface roughness influences also the analysis of PIXE spectra. Using absorption parameters deduced by Monte Carlo calculations, a correction method for surface roughness extending up to half of the proton range has been elaborated [114].

    Empirical factor. In the practical analysis of spectra with GUPIX it appeared that, to account for other factors specific to each experimental setup and type of sample, an empirical factor H is introduced instead of the solid angle Ω [105,109]. This was illustrated for the Tetric Ceram dental composite, which shows the H parameter as a decreasing exponential of X-ray energy (Preoteasa EA and Gurban D, unpublished; presented in [39]), but in general different functions are possible.

    Depth profiles. In principle, based on the X-ray production cross-section and the autoabsorption of X-rays in the sample, the depth profiles of concentrations can be calculated in a thick target with substantial matrix effects. This is important for changes at the surface of biomaterials, corrosion of dental alloys or for the surface protective and biocompatible layers as in Ti implants. For samples with inhomogeneous surface layers, the GUPIX program may also calculate depth profiles at the surface. The depth resolution of this analysis is limited (up to 5 successive layers). The complementary use of RBS, PIXE and resonant elastic backscattering (EBS) is recommended to determine the depth profiles [18,115].

    Accuracy in PIXE and complementary methods of analysis. With all possible sources of errors accounted for and extensive calculations, the best simulations of thick target PIXE spectra in the fundamental parameters approach have an accuracy of 2–3% at most. This was achieved for dental enamel [116] which, however, has less organic component than the resin-based dental biometerials and contains mostly HA with known composition. Excepting very elaborate analyses of spectra, the ab initio calculations may not work always, and in general the accuracy of PIXE analysis is far of such good performances. Some of the problems in the PIXE analysis of ‚difficult' dental materials have been discussed [77]. Possible solutions include the concomittant use of complementary methods such as ERDA [50,77], RBS [117], EDX-SEM and INAA [118], and PIGE [119,120,121,122,123], especially for the light elements. In the new facilities PIXE is routinely performed simmultaneously with RBS and PIGE (see Figure 2).

    Semiquantitative analysis of thick targets. When the collected electrical charge cannot be measured accurately, or when the sample contains unknown amounts of PIXE-invisible light elements, the method may however provide reliable relative concentrations and their variations, which still may give relevant insight for practical problems encountered in biomaterial analysis. With this approach we could classify dental composites using multivariate statistical analysis [77,124], assess the in vivo elemental and physical changes of a composite from a dental filling [125], and make the size statistics of mineral granules in a dental composite [126]. Moreover, we showed that the in vitro demineralization of dental enamel resulted in the uncovering of deeper layers containing higher trace element levels [127].

    Reference materials. The best alternative to fundamental parameter PIXE analysis of thick samples is by comparison to certified reference materials. It has been pointed out that calibration and quality control of PIXE analysis requires reference materials [128]. The concentrations in the analyzed sample are estimated by using appropriate standards of similar elemental composition, physical structure and surface roughness. We used recently this method in a PIXE-PIGE study of deer antlers [129]. The preparation of new standards received special attention with particular emphasis placed on homogeneity, background correction methods, and methodology validation [9]. In fields where standards have to be produced yet—as for dental biomaterials—their necessary characteristics have to be pre-stipulated from a detailed analysis [78].

    Limits of detection. For PIXE in thin samples, in the best conditions the LODs are of the order of 0.1–1 ppm; for thick samples they are one order of magnitude higher (i.e., sensitivity lower). The best detection limits are reached for protons of 2–3 MeV and for elements with Z = 20–35 (K lines) and 70–92 (L lines), but they depend on the sample [39]. In our measurements with 3 MeV protons on thick targets of some dental composites, e.g., Tetric Ceram, we found best detection limits of ~5 µg/g for medium Z elements, which improved by ~80% after carbon covering as well as after using a 30 µm Al foil absorber [39,77]. The LODs of PIXE for light elements are in general worse than 100 ppm, and better sensitivities can be obtained for these elements with PIGE.

    Microprobe PIXE analysis or micro-PIXE. Microbeam scanning allows 2D mapping of elemental distributions at the target surface with micrometer resolution [101]. Proton beams of 1–4 MeV with diamters of 20–100 μm can be prepared by collimation, and with magnetic quadrupole lens the beam can be focused down to 1 μm diameter [102,103]. To ensure sensitivity of the analysis a microbeam of 2 × 2 μm2 size requires a current density of 5–20 pA μm−2 [16], and for a 1 × 1 μm2 microbeam a minimum current of 100 pA is necessary [102]. In μ-PIXE the current density is 3–4 orders of magnitude higher than in broad beam PIXE (10−3–10−2 pA μm−2) and the specimen surface is locally burned. Initial beam currents between 1 and 3 μA should be provided by the accelerator [16]. At present a spatial resolution down to 1 μm is available in several laboratories. We used μ-PIXE to map normal bone [130], demineralized enamel [127] and a dental composite [126] at 4 μm resolution. The resolution is limited by lens aberations, and the improvement of resolution by a factor of 2 involves an increase in the beam current density by an order of magnitude. To improve the resolution by an order of magnitude based on further corrections of lens aberations would require 3 or 4 orders of magnitude increase in the brightness of the beam. A resolution of 300 nm is attainable in principle with the present proton microbeams, but a resolution of 100 nm at 100 pA current in the future would represent a limit hard to attain, involving formidable and unpredictible technical chalanges [103]. But even if such a high resolution beam would be possible, there are additional problems (mechanical and thermal instability, optical control of microbeam position on the sample at light wavelength precision) which untill now prevented a practical targeting better than 1 μm [131].

    Advances in PIXE analysis. Representative developments of experimental, computational and theoretical PIXE were presented in a review [9]. These included PIXE with high-resolution crystal spectrometers for chemical effects; a PIXE arrangement using simultaneously a large-area Si(Li) detector with Be window, and a second Si(Li) detector with an ultrathin polymer window for the analysis of light elements starting from C (Z = 6); depth-selective analysis called "differential PIXE" using different projectile energies for concentration profiles; the generation of real-time quantitative elemental μ-PIXE images by the "dynamic analysis" matrix transform; and PIXE-STIM tomography for nondestructive imaging of the 3D structure of biological objects. It is beyond doubt that the study of dental materials will benefit of such developments.


    4.2. Applications of PIXE and μ-PIXE

    The most proficient application of PIXE in the study of biomaterials is related to metals used in dentistry—mercury amalgam, stainless steels, other alloys and Ti implants—and to their influences in the surrounding biological environment. Recent advances in the topics of metallic biomaterials and their biological reactions have been synthesized in a book [132].

    Amalgam fillings, dental alloys, dental implants and their coatings. The contributions in this field of PIXE—most of them by μ-PIXE elemental mapping—have been substantial. Early PIXE studies have shown that mercury from dental amalgam altered the elemental profiles of Mg, Ca, Fe, Mn, Zn, and Sr in human erythrocytes and neutrophil granulocytes [133]. While dental amalgam and nickel alloys affect T-lymphocytes [134], removal of dental amalgam and other metal alloys alleviates symptoms in patients with amalgam-associated ill health [135]. The metals loss from dental amalgam and their drift in teeth continue to be studied by μ-PIXE [136,137].

    PIXE and μ-PIXE evidenced the diffusion into teeth of metals released by corrosion from crowns [138] and dowels of metallic dental works [139]. Implants made of stainless steels, of similar alloys as well as of Ti alloys have also adverse effects in the adjacent tissues. With the use of PIXE it was shown that following implantation Fe and Ni concentrations changed in dental implants [140]. The distribution and chemical states of Fe and Cr released from orthopedic implants into human tissues were studied by PIXE and XAFS [141]. Convergent results were obtained with microprobes on dental and orthopaedic implants [8,142]. μ-PIXE evidenced friction wear and metal dissolution of implants [143] as well as Ti corrosion [144] and Ti ion release [8,144,145]. Also Ti–15Mo alloy for dental implants is affected by corrosion [146]. Recent experimental developments in external beam PIXE [147] allow in situ and in vivo measurement of Ti release as demonstrated in earlier investigations [148].

    Another implant-related topic concerns the application of PIXE for the characterization of calcium phosphate bioceramics thin films aimed to protect the surface of Ti and other metallic implants against corrosion [149,150]. It was shown that TiO2 films deposited on titanium and stainless steel by ion-beam-assisted sputtering provides corrosion resistance [151].

    The μ-PIXE results on metal migration from Ti implants in tissues were consistent with those obtained by μ-SRXRF and μ-XASF ([7]; reviews by [6,71]). At the same time the Ti implant protection with bioceramics films is amply confirmed by XPS investigations discussed below.

    Composites and other dental materials. The present trend is to replace whenever possible traditional materials with the new materials. But some of them contain elements foreign to the organism which are released in the tissues, and whose fate and biological action are not yet fully understood. To approach this problem, the first steps would be the analysis of the elemental composition of the material itself and of the tooth, and then to follow the changes when interacting in conditions relevant to the use in the oral cavity. PIXE could bring here a relevant contribution.

    A number of dental composites were analyzed qualitatively by PIXE, ERDA and XRF; the detected elements were classified as major, minor and trace [50]. The quantitative analysis of one composite (Tetric Ceram, Ivoclar-Vivadent, Liechtenstein) was performed with PIXE and ERDA; the analysis was standardless and the difficulties were discussed in detail [77]. Another group [118] gathered quantitative concentration data on composites by using PIXE together of EDX-SEM and INAA. The elemental compositions were different in every composite resin, as confirmed later by SEM-EDX analysis alone [152,153] and combined with XPS [154]. Using the relative concentrations from PIXE measurements, the analyzed composites were classified in clusters with related compositions by use of multivariate statistics methods, namely of principal component analysis [77,124]. Note that such statistical treatments proved useful also for trace elements analyzed by XRF in dental enamel [155]. The semiquantitative analysis of various dental composites by PIXE, ERDA and XRF was suggested previously [50] to be used for customs, commercial and forensic applications; now portable XRF instruments and SEM-EDX are used for the fast identification of composites in legal investigations [48,49]. Dental materials used in endodontics were also analyzed by PIXE and included calcium hydroxide preparations [80] and a tricalcium silicate MTA-type repair cement in comparison with a white Portland cement [156].

    Proton μ-PIXE proved a valuable tool in studies on dental enamel and bone [127,130] and for mapping the surface of a dental composite at 4 μm resolution [126]. The µ-PIXE maps evidenced mineral particles with diameters ranging from ≤4 μm (Ca, Ba) to 60 μm (Zr, Yb). The distribution of Ca-rich particles revealed substantial differences from an area to another, which may lead to low local Ca2+ protection of the dental tissue in some areas. In a simple model [126] constructed on demineralization data of restorative materials [5,157], lateral diffusion of Ca2+ between adjacent domains with different concentration was described by exponential gradients. In the model, in dentin the Nernst equation predicted for Ca2+ gradient a field of 3.3 V cm−1 over a distance of 56 μm. Thus local electrochemical phenomena may contribute to the onset of secondary caries. Note that a potential difference of ~0.25 V was found between different parts of stainless steel implants [140]. Similar effects are to be expected in the protective action of F ions released from microgranules of YbF3 and of Ba fluoroaluminosilicate glass, as well as for metal ions released from metallic dental works.

    Alteration of dental composites and glass ionomers during oral use. The changes occurring in a Tetric Ceram dental composite filling during the in vivo oral use were studied [125] by simultaneous PIXE and PIGE measurements in the 0–270 keV range with a single, low-energy HP Ge detector. This technique was similar to that used by other authors [158,159] and allowed to see F together with the heavier elements in the same spectrum. The composite filling evidenced Cl and K accumulation (from saliva) and loss of F, Zr, Ba and Yb. The changes were similar at the surface and inside of the dental filling, indicating microscopic bulk fracture and cracks throughout its use. Some changes suggested also surface roughening by wear and grain size decrease by slow dissolution. Similarly, Zhou et al. [160] applied WDS-XRF and SIMS to evidence leaching of Ba or Sr from composites aged in artificial saliva as well as accumulation of elements and crystallite formation on the surface, while samples aged in ethanol displayed cracking. The above results are consistent to each other and are confirmed in a study [117] by a group who recently used PIXE and RBS to study the changes in the elemental composition of a glass ionomer produced by acidic beverages and by mineral water. In acidic media, Al, Si and Na were partly lost while maintaining a constant Al:Si ratio, whereas K, Ca and La increased their concentration at the surface. In mineral water the glass-ionomer mainly loses F and Na. The increment of the concentration of heavier elements at the surface was similar to the enhancement of trace element lines in PIXE specta evidenced in dental enamel after incubation in lactic acid solution [127]. The thickness of the modified surface layer extended with the immersion time [117], in formal agreement with our XRF data on dental enamel incubated in AgNO3 solution (Preoteasa EA, Gavrilus M, Preoteasa ES, unpublished, presented in [39]). Similar results were obtained on composites immersed in various media by attenuated total reflexion Fourier transform infra-red spectrometry, ATR-FTIR [161] and by inductively-coupled plasma mass spectroscopy (ICP-MS) and high-performance liquid chromatography (HPLC), respectively [76].

    PIXE-PIGE of the composite-tooth interface. A spectacular application of μ-PIXE together with μ-PIGE gives insight of the interactions between F-releasing materials and dental enamel [119,120,121,122,123]. The F and Ca distributions were studied at the interface between tooth (including at the cement-enamel junction) and composites or glass-ionomer cements. Using 1.7 MeV protons focused to 1 μm and measuring Ca by PIXE with a Ge detector and F by PIGE with a NaI(Tl) detector, 2D maps of the interface were constructed. By diffusion in an interface layer of 20–30 μm, F decreased in the biomaterials and increased in the tooth, while Ca showed the opposite trends in the interdiffusion layer. The diffusion layer parameters were significantly different depending on the type of F-releasing materials. The results show that the characteristics of F-releasing materials (fluorine distribution and mechanism of F-releasing) differentiate the resulting F distribution in the tooth hard tissue. The diffusion of Ca in the biomaterial was stronger in the case of the conventional glass-ionomer cement than for the resin-modified glass ionomer and for the resin composites.

    Interestingly, while the μ-PIXE and μ-PIGE mapping of Ca and F evidenced a width of 20–30 μm of the composite-tooth interdiffusion zone, studies of the dentin-adhesive resin interface layer found a thickness of only ~2 μm by TEM and SEM [162] and of 4 to 6 μm by μ-Raman spectroscopy [163]. These significantly different gradients may be due to the different experimental characteristics but also to differences between the methods, which analyze and map distinct components of the system (Ca and F on one hand, adhesive resin on the other); thus these components undergo distinct diffusion processes in dentin.

    The review of PIXE and μ-PIXE studies of dental biomaterials shows a wide diversity of applications for analysis and mapping of elements in dental amalgam, alloys and implants, dental composites, glass ionomers and endodontic materials, as well as of their alteration during use. The method yielded excellent results for corrosion of implants and other metallic works, for metal diffusion in teeth and oral tissues and for the evaluation of metallic surfaces protection by bioceramics thin films, as well as for in vivo monitoring with external beam PIXE of Ti release from implants. The Ca and F interdiffusion zone at the composite-tooth interface was elegantly characterized by μ-PIXE together with μ-PIGE and revealed complex phenomena. Thus the PIXE method shows the signs of its maturity and will certainly contribute to further developments in dental biomaterials research.


    5. PIGE, NRA and emerging nuclear methods

    Overview. The methods presented here involve nuclear interactions in some way or another, and almost all are dependent on small accelerators. The most representative are Particle Induced Gamma Emission (PIGE) [16,17,18,19,20,21,39,164,165] and Nuclear Reaction Analysis (NRA) [16,17,18,20,21,39,164,166,167], which like PIXE use protons or heavier ions in the 2–4 MeV/amu energy range from a tandem accelerator or a cyclotron to bombard the atomic nuclei of the analyzed target. PIGE and NRA are methods for multielemental analysis and surface mapping just like PIXE. Moreover, PIGE and NRA allow depth profiling and work usually together with PIXE and RBS in a common experimental setup, either with broad beam or microbeam. Other two nuclear methods emerged recently and present potential interest for biomaterial research. Photoactivation Analysis (PAA) [31] irradiates the target nuclei with high energy gamma radiation generated by another type of machine, an electron linear accelerator. Positron Annihilation Lifetime Spectroscopy (PALS) [32] uses a beam of positrons from an artificial radionuclide undergoing beta decay (produced by a nuclear reaction in an accelerator), and provides structural information of pores and defects in very thin layers, complementary to the data from PIXE, NRA and PIXE.


    5.1. The methods


    5.1.1. PIGE and NRA: Common background

    The physical basis and the experimental and instrumental aspects of PIGE and NRA make the object of books and review articles [16,17,18,19,20,21,39,164,165,166,167]; some of them cover selected aspects of biomedical applications [18,21,37,38,164,167], including topics from dental research [39,164,167].

    Nuclear reactions. Both particle-induced γ-ray emission (PIGE) and nuclear reaction analysis (NRA) are based on the formation between the target nucleus and the projectile of a compound nucleus in a highly excited state that disintegrates or relaxes with a very short lifetime and with the emission of γ photons and/or massive particles. PIGE is a particular case of NRA, when only gamma photons are detected; while in a more restrictive sense in NRA the emergent particles (protons, deuterons or alphas) are detected instead of gammas. Both PIGE and NRA are not methods with a continuous dependence of sensitivity on the atomic number [38], because the cross-sections of the nuclear reactions involved do not follow a continuous function of Z or A.

    Coulomb barrier. Except the inelastic scattering of protons, which only excite the target nucleus, the other reactions where the incident and emergent particles are different require sufficient kinetic energy of the projectile to overcome the Coulomb barrier and drive the bombarding particle close enough for the strong interaction to take place. The repulsive Coulomb barrier under proton bombardment is around 3 MeV for 16O and 14.3 MeV for 238U. Thus for protons or deuterons of 2–4 MeV/amu which are available at small accelerators only light elements are well analyzed by PIGE or NRA. Alpha particles are not so frequently used because their Coulomb barrier is twice higher and they require acceleration at higher energies. Reactions with deuterons above ~1.5 MeV have larger cross sections than with protons (because of the nuclear energy level structure of deuterium).


    5.1.2. PIGE: Specific aspects

    Overview. In this method [16,17,18,19,20,21,39,164,165], the prompt gamma rays' produced in (p, γ), (p, p'γ), (p, αγ) or (d, pγ) reactions are detected, providing thus information about the elemental, isotopic and depth distribution in the surface layer of the target. PIGE is similar to PIXE in many respects. The PIGE experimental setup is practically the same as in PIXE except for the gamma detector, usually large NaI scintillation or Ge(Li) detectors; the former is more sensitive and the second has a better resolution. As already mentioned, PIGE is typically run in conjunction with PIXE and RBS.

    Detected elements and typical reactions. In principle PIGE may detect Li, Be, B, N, F, Si, O, C, P, Al, Na, Mg, S, Cl, etc. but usually a smaller number (e.g., not more than 4–5) of elements are seen in a spectrum. Occasionally, heavier elements like Cu, Zn, As have been evidenced in biological samples [21]. For instance a low energy PIGE spectrum of dental enamel evidences F, Na, Al and P. The 511 keV line of the ee+ annihilation, which may originate in the 19F(p, α ee+)16O reaction [107] is seen. We detected F, Na, Mg and P in deer antlers [129]. A reference database for PIGE spectroscopy is being developed [165]. Some nuclear reactions common in PIGE are shown in Table 3. Some authors [168,169,170] classify as NRA their experiments using the 14N(p, γ)15O and 15N(p, αγ)12C nuclear reactions, respectively, although they may be described properly as PIGE.

    Table 3. Nuclear reactions used currently in PIGE analysis.
    Nuclear reaction Gamma rays energy (keV)
    15N (p, αγ)12C 6385
    18O(p, γ)19F 110,197
    19F(p, p'γ)19F 110,197, 1236, 1349 + 1357
    19F(p, αγ)16O 872
    23Na(p, p'γ)23Na 440, 1636
    23Na(p, αγ)20Ne 1634
    24Mg(p, p'γ)24Mg 1368.6
    25Mg(p, p'γ)25Mg 390,585
    27Al(p, p'γ)27Al 844, 1014
    27Al(p, αγ)24Mg 1369
    27Al(p, γ)28Si 1778
    31P(p, p'γ)31P 1266.1
     | Show Table
    DownLoad: CSV

    Natural background. In the analysis of the PIGE spectra care must be given to exclude the quite numerous lines of the natural background which may interfere with the lines of analyzed elements. These are produced by the elements of the radioactive series (especially the radionuclides of the Th series—Th, Ra, Ac, Rn, Po, Bi, Tl, Pb) and by the ubiquitous 40K, which are present in the surrounding materials of the building.

    Interelement interference. In a precise PIGE analysis of fluorine by the reaction 19F(p, p'γ)19F with the γ lines at 110 and 197 keV, there may be interference with oxygen by the reaction 18O(p, γ)19F which yields the same peaks; but this contribution is not so important because the 18O isotope has a concentration of only 0.2% in oxygen [107].

    Sensitivity of PIGE. The detection limits vary from element to element, depending on the cross sections of the nuclear reactions and on experimental conditions, but are typically on the order of 10–100 ppm [38]. We found for F detection limits of about 300 ppm [129], which is near the normal concentration of F in enamel, but is much below the fluorine level in composites and in other F-releasing dental materials. These values are in general lower than the best LODs in PIXE; however the PIGE detection limits of light elements can be better than in PIXE. Also for some light elements PIGE can be more sensitive than RBS.

    Sample damage. The beam current used in PIGE, when performed simultaneously with PIXE and RBS, causes some damage to the analyzed thin layer at the sample surface just like inthe last two methods. When PIGE is the main method for the detection of some low Z trace element, the damage can be higher due to lower sensitivity.

    Reference materials. Quantitative PIGE analysis for absolute concentrations measurements requires standards (e.g., we used Fluorspar NIST SRM-180, NaCl, Hay IAEA-V10 and Bone ash NIST SRM-1400 for PIGE of F, Na, Mg and P in deer antlers, respectively [129]).

    Resonant reactions. Among the nuclear reactions used in PIGE and in NRA, some present sharp resonances with a typical width of some keV. In resonant PIGE as well as in resonant NRA a high reaction yield is obtained only in a shallow depth region corresponding to the region of resonant cross section. By changing the incident beam energy the depth of the resonant region is changed [166]. When it is based on resonant nuclear reactions, PIGE may determine with high precision the depth profiles of selected elements [101,164].


    5.1.3. NRA: Specific aspects

    Detected elements, sensitivity, typical reactions, resonant reactions. Nuclear reaction analysis [16,17,18,20,21,39,164,166,167] uses as projectiles ions like 1p, 2d and 3He, and analyzes emergent particles like 1p and 4α to detected elements of interest for dental materials like B, C, N, O, F and to determine their depth profiles in surface layers. One disadvantage of NRA is that it requires specific experimental conditions (projectile particle, its energy, appropriate particle detector and geometry of the experiment) for each analyzed element; thus a separate analysis must be made.

    NRA is more sensitive to light elements than RBS, with typical detection limits of the order of 10–100 ppm.

    Some reactions used in NRA for light elements are presented in Table 4. A somewhat unusual kind of nuclear reaction has been used by Chaudhri [167] for the analysis of carbon in dental enamel, namely 12C(3He, n)14O with halftime of 72 s, which requires a neutron detection system. The status of the problem of nuclear cross section data for IBA has been examined critically [17].

    Table 4. Nuclear reactions used currently in NRA.
    Nuclear reaction Q, MeV
    11B(p, α)8Be 8.582
    18O(p, α)15N 3.9804
    19F(p, α)16O 8.1137
    12C(d, p)13C 2.722
    14N(d, p06)15N 8.610 (p0)
    10B(d, α)8Be 17.818
    16O(d, α)14N 3.11
    12C(3He, α)11C 1.8563
    16O(3He, α)15O 4.9139
     | Show Table
    DownLoad: CSV

    At the same time NRA may determine the depth profiles very precisely when using resonant nuclear rections [171,172].

    Note that some low Z elements may be detected by two methods which makes possible their intercomparison: N and F are detected by PIGE and NRA, and Al and P by PIGE and PIXE. In addition, all elements from C (Z = 6) are detected by RBS, and practically all elements from Z = 1 are seen by ERDA.

    Sample damage. Standards, quantitative analysis. Damage of sample surface layer by NRA is similar to that taking place in PIGE—they are both non-destructive methods but are not noninvasive.

    The best quantitative analysis by this method is achieved with standards (see e.g., [171,172]). Other aspects on the potential of PIGE and NRA will be illustrated below by their applications in dental research.


    5.1.4. PAA and PALS: Emerging nuclear methods

    Photoactivation analysis. PAA is a method similar to neutron activation analysis (NAA) but which uses for activation high energy photons instead of neutrons. It is a bulk analysis method, because high energy photons can penetrate deep into the material. The subject has been reviewed [31]. When a photon of high enough energy strikes a nucleus, a neutron or a proton can be liberated. In many cases, the produced nuclide is unstable and will decay by β+ or β emission or by electron capture, followed by emission of gamma photons in the energy range of 8 keV to several MeV. PAA can detect among other C, O, F, Na, Mg, Ca, Ti, Ni, Sr, Ba, As, Zr, Tl, Pb, U. The minimum detected amounts of elements are between 0.001 to 150 micrograms. PAA is not identical to induced gamma emission (IGE) which is analogous to optical fluorescence and usually involves a specific nuclear isomer.

    Positron annihilation lifetime spectroscopy. PALS (or positron annihilation spectroscopy in brief) is not a technique of elemental analysis but a thin layer characterization method. It is a still new nuclear method which waits for its applications in the characterization of dental materials; but it has been used in similar problems of material science. PALS gives information on the nanoporosity and subnanometer defects in materials surface layers and on thin layers thickness. Therefore it could be useful for studies of restorative composites whose pores are important for their properties, as well as of the protective oxide and nitride layers at the surface of Ti implants which have defects. The method and its applications have been reviewed [32]. PALS is based on the electron-positron annihilation. When a radioactive isotope such as 22Na (T1/2 = 2.6 yr) undergoes β+ decay due to weak nuclear forces, a positron is emitted concomitantly with a gamma photon. After the positron enters into a solid body, it may travel free until meets an electron and annihilates, or may form a bound state with an electron, a positronium, which also annihilates after a time through interaction between the two particles. The annihilation releases gamma rays of 511 keV; the time between the emission of positrons and γ rays from the radioactive source and the γ rays due to annihilation corresponds to the lifetimes of positron or positronium. The lifetime of positronium is longer in vacuum than in compact matter and has intermediate values in a porous material. This allows the estimation of the mean pore or defect size and the determination of statistical distribution of the pore dimensions.


    5.2. Applications of PIGE, NRA and emerging nuclear methods


    5.2.1. Illustration of PIGE and NRA performances

    3D mapping of F in enamel by resonant PIGE. Some of the best achievements of PIGE and NRA have been recorded in the study of fluorine distribution in the outermost layer of dental enamel. The performances of µ-PIGE were illustrated by the study of Lindh and Tveit [101] on dental enamel using a proton microprobe at 1 µm lateral resolution. Based on the detection of γ photons at 872 keV from the resonant reaction 19F(p, αγ)16O, the sequential 3D mapping of fluorine was made at 0.1–0.8 µm depth resolution down to 12 µm. The depth resolution decreased monotonically with the depth (from 0.1 µm at 0–1 µm depth to 0.8 µm at 11–12 µm depth).

    Depth profile of F in enamel by resonant NRA. Similarly, high performances of NRA were demonstrated by Moro [171] and Torrisi [172] in the measurement of fluorine depth profile in dental enamel by use of the resonant reaction 19F(p, αo)16O. Using a surface barrier semiconductor detector for alphas, the spectrum of emitted α particles allowed an F depth profile down to ~5 µm with a 0.3 µm depth resolution.

    The thickness of the analyzed layer was greater in PIGE than in NRA. The depth resolution of the two methods was the same in the layer located at 1–2 µm from the surface. In both mentioned examples the detection limit for fluorine was of ~0.3 mg/g (300 ppm).


    5.2.2. Applications of PIGE and PIGE-PIXE

    PIGE of F in enamel in vitro and in vivo. Most applications of PIGE in dental research—alone or together with PIXE—were aimed for the analysis of F in teeth, in dental materials or in both at their interface. It was shown that PIGE analysis of fluorine by the 110 and 197 keV lines of the 19F(p, p'γ)19F reaction could be done concomitantly with PIXE using a single HPGe detector [39]. This type of PIGE-PIXE analysis of teeth was used for an epidemiologic study in a South Africa community [159]. F was analyzed also by the 6–7 MeV gamma rays from the 19F(p, αγ)16O reaction to monitor the uptake of fluoride into developing sheep teeth in New Zealand [173]. Important technical developments were made possible by the external beam setup. This allows the PIGE-PIXE in-air analysis of teeth in their natural state without any preparation and without drying [174], as the later may produce cracks in enamel and dentin. With an external proton broad beam, PIGE made possible the in vivo analysis of fluorine and other elements in human tooth enamel, aimed to compare the F uptake from different commercial fluoride-containing dentifrices and tooth gels [175,176]. A measurement was made in 1 min and dosimetric measurements showed that the radiation rate during the bombardment was small, less than 1 mrad/h due to γ and X-rays at 5 cm from the beam spot, and less than 0.1 mrem/h due to neutrons. The same in-vivo setup for PIGE-PIXE analysis evidenced an enhanced retention of fluorine in tooth enamel after laser irradiation [105].

    PIGE-PIXE of F and other elements in dental composites. The combined PIGE-PIXE analysis appears today as the most rewarding approach in the investigation of changes occurring in fluoride releasing materials during their oral use as well as of the incorporation and effects produced by the F ion in the dental hard tissues. In our already mentioned broad beam, single-detector PIXE-PIGE study of the changes in a dental composite filling [125] we applied a multielemental approach and evidenced Cl and K accumulation and loss of Zr, Ba, Yb (by PIXE), and of F (by the 110 and 197 keV lines in the PIGE spectra). Ytterbium was showing a 41% decrease, close to a 37% decrease of Ba, and both correlated well to the 27% decrease of F. This suggested that in the composite there are two main chemically bound fractions of F: One in YbF3 and one in a low-solubility compound of Ba (probably a barium fluorosilicate glass), respectively. The PIGE lines of F showed that about three quarters of the total available F remained unused in the composite during its oral utilization. The filling surface roughening by wear, the slow dissolution of mineral inclusions and the crack formation were suggested by changes in the ratio of the L lines of Yb and in the ratio of the 110- and 197-keV lines of F. Thus the PIXE-PIGE measurements not only evidenced changes in the elements' concentrations, but also suggested degradation mechanisms involved in the alteration of a F-releasing dental composite filling. It is remarkable that changes in the physical structure of the composite could be evidenced in a simple way by the intensity ratio of F lines and of Yb lines. Degradation of composites consisting in microcavities, protruded filler particles, grain boundaries, and cracks has been evidenced by other methods [177].

    An important result suggested by IBA studies [125] is that during their oral use, F-releasing composites may be affected in much greater depth than the layers analyzed by PIGE and PIXE because of defect formation in the biomaterial. In this case, long profiles recorded with the proton microbeam in sectioned samples may be highly relevant for assessing permeation of the composite due to development of cracks and fissures.

    PIGE-PIXE of F and Ca in the composite-tooth interdiffusion zone. With the availability of an external scanning proton microprobe of ~1 µm resolution for in-air PIGE-PIXE elemental analysis [178], a Japanese group developed a different approach, consisting in the mapping of F by µ-PIGE and of Ca (and occasionally of Sr) by µ-PIXE at the hybrid bonding layer between the restorative dental material and the hard dental tissue. Because the specimen was bombarded in air, the necessity of pre-drying which may lead to shrinking or cracking of the dental hard tissue was avoided. Moreover a sequential study was possible by following the changes in subsequent phases of an experimental treatment.

    In the seminal studies of Yamamoto et al. mentioned before [119,120], the 2D µ-PIGE and µ-PIXE maps evidenced an interdiffusion layer of 20–30 µm at the interface between the two structures. As mentioned before, studies of the dentin-adhesive resin interface layer found a thickness of only ~2 µm by TEM and SEM [162] and of 4 to 6 µm by µ-Raman spectroscopy [163]. However, the different thiknesses obtained by different methods refer to different structures. The maps obtained by SEM, TEM and Raman microspectroscopy of the adhesive resin penetrating the dentin microchannels evidenced the "contact zone" between the composite resin and the dental tissue, while the µ-PIGE and µ-PIXE maps refered to the "interdiffusion layer" of F and Ca2+ ions. The former was mainly topographical and dependent on the ultrastructure of the dental tissue as well as on the viscosity, adhesivity and stiffness of the resin penetrating in the dentin canals. The later described the diffusion of F and Ca2+ ions in the dental tissue and in the composite or glass ionomer, respectively; the process involved individual ions and was close to the atomic scale. Therefore the diffusion of the small F and Ca2+ ions affected a much thicker layer than the contact zone between the composite resin and the dental tissue. The overall picture is an expression of the complementarity between different methods.

    In recent studies, the Yamamoto group using the combined microbeam PIGE-PIXE analysis continued to enrich our understanding on the interactions between F-releasing materials and dental tissues. They showed that caries progression was inhibited with increasing the amount of F uptake from fluoride containing materials [179]. Caries preventive effect of fluorine-containing material depends on the caries risk; an adequate amount of fluorine supplied from the material is required at higher caries risk [121]. In cavities filled with F and Sr-containing restorative materials the fluorine uptake showed a difference between the enamel surface and enamel cavity wall [122]. Fluorine contributes to the strength of the dentin-resin composite bond by fluoroapatite formation within the hybrid bonding layer [180]. The F penetration into tooth structure from the fluoride containing materials showed two types of F-tooth interactions: incorporation into the crystal lattice; and adsorption on the surface of microstructural elements (like enamel prisms) into the tooth hard tissues, with the former being chemically stable and contributing to the acid resistance of dentin by producing a dense structure [123].

    Note that the difference in fluorine uptake between enamel surface and deeper layers [122] is consistent to the elemental profiles obtained in sectioned enamel by µ-NRA and µ-PIXE [181], and by µ-PIXE alone [125], respectively, which showed a denser and strongly mineralized layer at the surface of enamel. At the same time, two types of interactions in a biomineral structure—by chemical bonding and adsorption—were postulated also for Zn in cortical bone [130], similarly to the incorporation of F into the tooth hard tissues [123].


    5.2.3. Applications of NRA and NRA-PIXE

    Laser irradiated enamel studied by NRA-PIXE. The analysis of the organic component in materials with composite structure (as the dental enamel itself) was made possible by NRA. In the mentioned study of Sommer and Engelmann [181] µ-NRA together with µ-PIXE highlighted structural patterns of elemental distributions in dental enamel and their changes after irradiation with a continuous wave CO2 laser. They used the 12C(d, p)13C and 14N(d, γ)12C reactions and performed simultaneous µ-NRA and µ-PIXE to investigate the elemental distributions of C and N as well as of P, Ca, Fe and Zn in sectioned native and laser-irradiated dental enamel. They evidenced a higher minerality in the outermost layer of enamel, similarly to the µ-PIXE results of Preoteasa et al. [127] on enamel demineralization. The laser irradiation produced multiple effects which were different from one tooth to another, similarly to the findings of our SEM study of enamel irradiated with a pulsed CO2 laser [182]. In particular, the irradiation with a CW CO2 laser induced quasi-periodic concentration distributions of Ca, P, Ca/P, Fe and Zn in some teeth, and depletion of C and N from proteins near the enamel surface. This was followed—unexpectedly—by an increase of the two organic elements toward deeper layers of enamel. The detection of elements of unmistakable organic origin like C and N offers NRA promising perspectives for the investigation of dental materials of composite nature.

    Combined PIGE, NRA and PIXE measurements were used for the elemental analysis of normal, pre-carious and carious enamel, dentin and cementum, as well as for establishing correlations between elements and for tracing elemental profile in teeth [167,183,184]. Plausibly, the same methodology may be applied to dental materials.

    NRA of implant coatings. Another line of NRA applications is based on the capacity of the method to detect elements like O, C, N which may form protective layers at the surface of metallic works and dental implants, while analysis of F may be relevant for corrosion. Indeed NRA proved highly useful in the characterization of Ti oxide and nitride surface modifications aimed to provide dental implants with corrosion protection, improved osteointegration, minimized microorganism adhesion and improved tribological quality. Combined XPS and NRA analysis of oxidation of Ti and Ti alloys in nitric acid shows surface oxide thicknesses to be more variable and non-uniform than XPS analysis alone would suggest [185]. Oxidation of Ti surface in phosphoric acid leads to P incorporation into the oxide [186]. Surface modification of titanium by plasma nitriding improves tribological performance of Ti implants [168,169]. Plasma nitriding also minimizes Pseudomonas aeruginosa adhesion to titanium surfaces [170]. The studies conducted so far by this method are not many, but they open the way for expanding the palette of NRA to new applications in dental biomaterias research, compensating perhaps the more exigent experimental requirements of this method.


    5.2.4. Illustrative applications of emerging nuclear methods

    PAA of dental composites. As an illustration we refer to a study of Eke [187] aiming to evaluate the potential of PAA for the analysis of dental composites in comparison to SEM-EDX and XRF. High energy electrons produced by an electron linear accelerator hit a tungsten disk (Bremsstrahlung converter) thereby producing high energy X-rays. The dental composite materials under study were exposed to the Bremsstrahlung radiation which produced photonuclear reactions. The radioactivity of the produced radionuclides was measured using a HPGe detector. As a result, photonuclear reactions of 12 stable elements were detected in different dental composites, and the elemental concentrations were calculated. The elemental contents of composites, e.g., Mg, Ni, Ba and Sr were obtained by PAA whilst C, O, Al, S, Ba and Sr were detected by XRF. The results for Ba and Sr obtained using the two techniques show considerable differences.

    PALS of protective coatings. In a study of the oxide layer prepared on the surface of silicon, good agreement was found [188] between the film thicknesses obtained by PALS and by NRA. But in addition, the positron annihilation measurements allowed the depth profiling of defects in the surface oxide layer, which was not available by other methods. In another investigation PALS was used for measuring the pore dimensions in a composite hydrogel for heavy metal uptake from water, and the pores' dose-dependent changes following gamma irradiation [189]. PALS evidenced in the gel pores of sub-nanometric size (55–70 3) which showed free volume parameters changes dependent on the polymeric gel crosslinking. These two examples illustrate the remarkable potential of PALS for the characterization of pores and defects both in thin layers and in bulk specimens, sustaining thus the relevance of this method in the perspective of its applications to dental materials.

    The field of dental materials remains open for PIGE analysis and NRA, especially with proton microprobe at 1 µm resolution and in combination with PIXE, RBS, ERDA, XPS and other methods. There are many surface phenomena in dental materials and at the interface with enamel and dentine which could be examined with these methods, especially for high precision depth profiling of fluorine in teeth and in F-releasing dental materials. Microbeam PIGE-PIXE of the composite-tooth interface already proved that the Ca and F interdiffusion zone is deeper than the contact zone. New nuclear methods like PAA and PALS emerge and may play a complementary but valuable role in future studies. In particular, PALS is unique in the study of sub-nanometer defects in protective thin layers.


    6. RBS, ERDA and SIMS

    RBS, ERDA and SIMS—ion beam scattering methods of surface analysis. Rutherford backscatter spectroscopy (RBS) is typically run in conjunction with PIXE and PIGE in modern IBA facilities as mentioned. Elastic recoil detection analysis (ERDA) is not usually part of the standard configuration of small energy accelerators and requires somewhat more special experimental setups, but can be also performed in association with the IBA measurements. Both RBS and ERDA use ions accelerated at MeV/amu energies, while secondary ion mass spectrometry (SIMS) is not dependent on accelerators because it uses low energy ions. However, RBS, ERDA and SIMS have in common the ion bombardment of the target and the characterization of a thin layer at the surface of the specimen by analysis of emergent particles, nuclei or ions.

    Detailed theoretical, experimental and technical aspects of these methods and of related topics make the object of handbooks and monographs [19,20,22,23,24,25,33,190,191] and of chapters, review articles and technical reports [13,16,18,19,20,21,164,192]. Introductory notions, brief presentations of the methods with emphasis on their applications in biomedical, dental and biomaterial research are available [21,37,38,39,192], as well as theses on new experimental developments [193,194,195,196].


    6.1. The methods


    6.1.1. RBS and ERDA

    In general, the interaction of energetic ions in the target material consists of elastic and inelastic collisions of the incident ion with nuclei and electrons. In the case of an elastic scattering process the momentum and kinetic energy between the projectile and target colliding nuclei are conserved. In the laboratory frame of reference the elastic collision can be seen either as a scattering or a recoil process. Both RBS and ERDA are elastic scattering methods and they are discussed here together because the theory has a common start point.

    RBS—principle and related techniques. In RBS the backscattered incoming projectile is detected after the elastic scattering at a backward angle, close to 180° relative to the beam direction. Several experimental variants exist.

    A smilar technique is the ion (back-)scattering spectroscopy (ISS), a method which analyzes by energy the back-scattered incident ions (like in RBS), but uses less energetic projectiles (like in SIMS). Other abbreviations of RBS variants and of related techniques are EBS, PBS, PESA, FAST, FSA and FRS (see Table 1). A more special method is non-Rutherford backscattering spectrometry (non-RBS) which uses more energetic projectiles at tens of MeV [197], but this is not included in the present paper.

    ERDA vs. RBS—experimental aspects. In ERDA the recoiled target nucleus is detected at a low angle with the beam, which is bombarding the analyzed surface at a near grazing angle. The mass identification can be done by measuring the energy or the time-of-flight of the recoiled atoms. Heavy ions cannot backscatter from light ones, because it is kinematically prohibited. Therefore the mass of the projectile is less than that of the target in RBS, while the opposite principle is valid in ERDA. In RBS the sample is irradiated with light energetic ions, typically hydrogen, helium, nitrogen or neon of a few MeV/amu, while in ERDA very heavy ions like copper and iodine are used as projectiles. RBS cannot detect hydrogen but can detect in principle all other elements heavier than the projectile; ERDA can detect all elements lighter than the projectile, including hydrogen. For both methods the basic theory is the same, but it takes particular forms depending on the mass ratio of projectile and target, Mp < Mt in RBS and Mp > Mt in ERDA. The equations show explicitly that by measuring the energies of the incoming projectile and emerging recoil particles, both methods may perform the mass identification of the elements (and isotopes) in the sample [13,16,17,18,19,20,21,22,198].

    In RBS the detector, typically a surface-barrier detector, is placed as close as possible to 180° relative to the beam, while in ERDA where the projectile ions are heavier than the target atoms (Mp > Mt), there is always a critical angle zcr = Mt/Mp of the detector with respect to the beam beyond which the scattering cannot occur. In particular, in our ERDA measurements of a dental composite we used a compact ΔE(gas)–E(solid) telescope detector consisting of a ionization chamber and a surface barrier silicon detector [50,77].

    There are upper and lower limits for the energy of projectile particles. At higher energies the projectile approaches the Coulomb barrier of the target nuclei and inelastic scattering (nuclear reaction) may occur. At lower energies the effect of the electrons surrounding the nucleus cannot be neglected and the electronic screening begins to diminish the Rutherford scattering cross section, which requires corrections.

    Standard free, absolute methods. The differential scattering cross section is given by the Rutherford formula, which takes particular forms in RBS and ERDA. In ERDA, the ratio R of densities of two elements a and b is given only by the numbers of recoil events for the elements a and b, their atomic masses, and the atomic mass of the projectile. RBS and ERDA are standard free, absolute methods and the concentrations of analyzed atoms in the target can be calculated directly using the Rutherford cross sections [13,16,17,18,19,20,21,22,23,33,39,164,190,191,192]; this represents a big advantage of the methods.

    Detected elements, mass resolution, sensitivity in RBS. In RBS there is much greater separation between the energies of particles backscattered from light elements than from heavy elements, and the method has good mass resolution for light elements, but poor mass resolution for heavy elements. The opposite is true for the element selectivity of PIXE and XRF, which is better for medium and heavier elements. Therefore, using RBS in conjunction with PIXE or XRF covers virtually the entire periodic table [16]. Usually RBS can resolve light elements that differ in mass by only 1 amu, like C from N or P from Si; this is important for dental composite materials which contain together organic polymers, phosphates and silica or glass nanoparticles. By using as projectiles heavier ions, e.g., 14N, RBS allows an even better mass separation, but in this case elements from H to N could no more be detected. For thick samples the mass identification may be complicated due to the superposition of spectra. RBS is more sensitive for heavier components of the sample, but on the expense of their mass resolution. The detection limits of RBS are of a few percent for low atomic number elements and < 100 ppm for high atomic number elements [38].

    Detected elements, mass resolution, sensitivity in ERDA. By using very heavy ions, no restrictions in elements to be detected exist. All elements from hydrogen to the very heavy ones, up to the projectile, can be measured with comparable sensitivities of about 0.1%. The sensitivity for hydrogen is enhanced by a factor of four. Also, the mass resolution of elements differing by 1 amu is very good in ERDA.

    Depth profiling. In both methods, the projectiles and the emerging particles or nuclei undergo energy loss in the material due to interactions with the electron clouds and to glancing collisions with the nuclei of target atoms. This means that a particle or a recoil nucleus scattered from some depth in a sample will have less energy than a particle originating from the sample surface. For instance, typical energy losses for 2 MeV alphas range between 100 and 800 eV/nm, depending on the sample composition, density and structure. Therefore it is possible to determine the elemental composition as a function of depth, i.e., to perform depth profiling of the analyzed surface layer of the sample. The nuclear analytical depth is about 2 µm in RBS (the maximum depth allowed by the RUMP software for RBS is 10 µm) and below 1 µm in ERDA.

    In brief, RBS and ERDA are standard free surface analysis methods allowing the determination of concentrations and the depth profiling especially for the light and medium elements. They complement with PIXE for heavier elements and for its better sensitivity and with PIGE and NRA for precise depth profiling of selected elements.


    6.1.2. SIMS

    We will discuss here briefly secondary ion mass spectrometry (SIMS) too, although this technique uses ions of several keV only from ion guns instead of ions accelerated to MeV/amu as in IBA. But SIMS is the most sensitive surface analysis technique, being able to determine the elemental, isotopic, or molecular composition present in the parts per billion range. The method is presented in dedicated books and reviews [21,23,24,25,34,199].

    Surface sputtering by low energy projectiles. In SIMS the analytical process is based on sputtering of the surface of the specimen (and not on backscattering or recoiling as in RBS or ERDA). As compared to the MeV energy particles used in IBA, which obey the Bethe-Bloch formula describing the energy loss by successive ionizations in the target, the significant divergences between data and the above mentioned theoretical predictions for energy lower than ~200 keV as used in SIMS evidence a different nature for the sputtering process. In sputtering atoms are ejected from a solid target after multiple collisions forming cascades, which are triggered by the incident ions of relatively low and intermediate (keV) energy. The sputter yield, the average number of atoms ejected from the target per incident ion, depends on the ion incident angle, the energy of the ion, the masses of the ion and target atoms, and the surface binding energy of atoms in the target. In SIMS the ion yield decreases exponentially with the ratio between the element's ionization energy and a matrix dependent parameter. An algorithm that simulates sputtering based on a quantum approach is implemented in the TRIM code [111].

    Experimental setup of SIMS. The mass of the ejected secondary ions is measured with a mass spectrometer. Typically, a SIMS spectrometer consists of a primary ion gun and ion column for accelerating, focusing and scanning the beam onto the sample, a mass analyzer separating the ions according to their mass-to-charge ratio, and a detector of ions. High vacuum is needed. While the first instruments used argon and oxygen for the primary beam ions, recent developments use primary projectiles like ionized C60, ionized clusters of gold and bismuth and even large gas cluster ion beams, e.g., Ar700+ [200]. The actual trend in instrumentation is in favor of time-of-flight mass spectrometers (ToF-SIMS).

    Detected elements, sensitivity, depth profiling in SIMS. All elements and their isotopes ranging from hydrogen up to uranium can be analyzed with SIMS. Detection limits for most trace elements are between 1012 and 1016 atoms per cubic centimeter, depending on the type of instrumentation, the primary ion beam used and the analytical area, and other factors. The detection limits are lowest for light elements (0.004 ppm for Li) and increase monotonously with the atomic mass (24 ppm for Hg) [21]. SIMS operation mode may be static (surface atomic monolayer analysis) and dynamic (analysis of successive layers unburied by sputtering). Therefore SIMS can perform depth profiling [201]. The analyzed depth is about 1–2 nm with the static operation mode and 1–2 µm in the dynamic mode, i.e., sputtering of successive layers. Values for the depth resolution obtained with SIMS are between 3 nm and several tens of nm, depending on the target and the depth of the profile to be measured [202].

    Sample requirements. Because the analyzed surface layer is very thin (a few atomic layers), SIMS (like XPS) is very sensitive to surface roughness, in contrast to PIXE which analyzes thicker layers at the surface. Therefore SIMS requires surface polishing as well as standards for an accurate quantitative analysis. However thick samples in their natural state such as dental materials allow for a qualitative or semiquantitative analysis. The unique sensitivity of SIMS and its ability to detect not only elements but also molecular groups and fragments may compensate for the limited accuracy, as suggested by the many applications of this method.


    6.2. Applications of RBS, ERDA and SIMS


    6.2.1. Applications of RBS

    Analysis of dental tissues and biomaterials. The capacity of RBS to discriminate elements according to their atomic mass, most performant for the analysis of light elements (excepting hydrogen) has been exploited in many studies, which also took advantage of the fact that this technique is frequently run simultaneously with PIXE and PIGE. In the fields of prosthetics and general dentistry, these may be illustrated by various applications, from the assessment of tissues' contamination around a prosthesis [203], to the analysis of normal and decayed dentin and of dental calculus [204]. At the same time RBS together with PIXE proved useful in the characterization of a new Sr-delivering bioglass for clacified tissues' impairments [205] and in the evaluation of changes induced in glass ionomers by common beverages and infusions [117].

    Depth profiling of protective coatings. However RBS applied together with NRA, PIXE, XPS, FTIR and EDX demonstrated its excellence in the characterization of thin layers. Starting with non-biological applications, such studies are illustrated by the analysis of light elements in various thin films deposited on Si substrates [206] and by the monitoring of ion track formation in layers of SiO2 and TiO2 [207]. RBS proved highly valuable in the analysis and elemental depth profiling of thin layers prepared on the surface of dental materials for their protection and for enhanced biocompatibility by use of different techniques (ion beam sputter, ion implantation, plasma vapor deposition, laser deposition). The method has been used for the structural and compositional characterization of ion beam sputtered Ca phosphates layers on Si and Ti substrates [150], of ion beam sputtered hydroxyapatite films on Ti–6Al–4V alloy [208], of hydroxyapatite layers deposited by pulsed laser on Ti alloys (showing improved biological properties) [209,210], of bioactive amorphous silicon oxynitride films deposited by plasma vapor [211], of implanted Mg ions in the surface layer of Ti in view of their effects on the behavior of mesenchymal stem cells [212], and of ion beam sputter-deposited Nb on Ti substrates for protection against corrosion [213].

    In brief RBS, as a standard free, absolute method for the analysis and depth profiling of low Z elements (except H), proved to be a valuable technique for the study of composition, thickness and structure of dental materials surface layers, especially of protective films on Ti implants. Thus RBS in combination with PIXE, PIGE and NRA is expected to play an important role in dental biomaterials' research.


    6.2.2. Applications of ERDA

    Depth profiling of hydrogen and other elements in protective coatings. Analysis of dental materials. In biomedical applications, although not too many so far, ERDA yielded relevant information on biomineral structures, including bones [214] and the teeth surface [215,216]. In the field of biomaterials, it was associated to RBS, PIXE and NRA in studies already mentioned [194,207]. Together with some of these methods, ERDA evidenced itself in the characterization of calcium phosphate bioceramic films deposited on Si substrates and Ti implants [150] and had an essential contribution in the study of biomimetic diamond-like carbon coated titanium and of its influence on osteoblast and osteoclast differentiation in vitro [217]. ERDA is invaluable among other for providing information on hydrogen concentration and its depth profile in the deposited amorphous carbon layers [218], as hydrogen cannot be detected by RBS. In such studies an association of ERDA with XPS and Raman spectroscopy [218] and with measurements of surface roughness and hydrophilicity [217] proved highly useful. We applied ERDA with Cu ions projectiles for the analysis of flat and smooth samples of the Tetric Ceram dental composite and determined the concentrations for 9 light elements from H to Si [50,77]. Moreover, the depth profiles of these elements in the composite were obtained and showed increased concentrations of H, C and N, at the most superficial layer of the sample the last two elements being associated exclusively with the composite's organic polymer (Preoteasa EA and Pantelica D, unpublished). The same ERDA experimental setup [198,219] as in the analysis of composite [50,77] and bone [214] was used together with XPS in a study of TiN thin layers [220]; the later are devised as potential protection coatings of implants. The elemental depth profiles and their computer simulation with the program SURFAN (Negoita F et al.) are shown in Figure 3. The presence of a small amount of O and C in addition to Ti and N is due both to residual gas incorporated in the chamber walls and to the contamination during sample handling in open atmosphere before the composition analysis.

    Figure 3. Typical ERDA depth profiles of Ti, N, O and C for a TiN coating prepared by cathodic arc deposition and corresponding computer simulations. The detector of the elastically scattered recoils was a compact ΔE(gas)–E(solid) telescope with the residual energy silicon detector placed inside the ionization chamber. For measurements an incident 80 MeV Cu10+ ion beam (2.76 MeV/amu) was used (Reproduced from [220] with permission).

    In brief ERDA, also a standard free, absolute method like RBS, has a great potential for surface analysis and depth profiling of light (including H) elements and also for intermediate Z ones, especially in protective thin layers on Ti implants. Best depth profile results were obtained by ERDA on H in amorphous diamond-like carbon coatings and on laser deposited ceramics. ERDA in combination with PIXE, PIGE and NRA layers is waiting for new applications in dental biomaterials research.


    6.2.3. Applications of SIMS

    Analysis and depth profiling. SIMS applications in biology occured early [221] including also studies on bones and teeth [222] and they have been reviewed [21,40,222,223]. The SIMS analysis has been applied to bone; progress has been made in the quantification of its calcium content [224] and of its changes [225].

    In dental research SIMS has been applied initially in studies of elemental depth profiles in normal enamel and dentin [226,227], and it was recently used together with FTIR in the investigation of carious dentine [228].

    In the study of dental materials, of their components and their interactions SIMS was used either alone or associated with FTIR, Raman, XRD, XPS, SEM, TEM and AFM. Much attention was paid to calcium and phosphate compounds. Such applications included nanoscale surface characterization of hydroxyapatite and fluorapatite by monitoring Ca, F, PO, PO2 and PO3 [229] and of biphasic calcium phosphate and β-tricalcium phosphate bioceramics [230]. The Ca phosphates could be differentiated by SIMS monitoring of PO3, O, Ca+, CaOH+, PO2, and OH ions using multivariate statistical analysis [231]. Similarly, the method could discriminate the calcium carbonate polymorphs [232], and characterize zinc polyphosphate glasses [233]. Also SIMS contributed to the understanding of the adhesion of glass-ionomer cements to dentin [234] and of the effects of silanized surface of ZrO2 granules on the adhesion to resin [235], as well as of the action of solutions relevant for human biological fluids on calcium silicate-based cements [236]. Along another line, SIMS proved highly efficient in the study of organic coatings of dental materials, such as proteins [193,237] and glycans [238] adsorbed on metals for dental implants. A fruitful direction proved to be the use of SIMS in studies aiming to the improvement of coatings on implant Ti alloys. The investigated biomaterials included strontium based coatings of Ti implants [195], phosphonic acid treated Ti surface for improved bone bonding [239] and porous titanium implants altered after one week mineralization in bone [240]. Finally, it was shown that magnetoelectropolishing can result in dehydrogenation of surface layer of metallic biomaterials. SIMS analysis and depth profiling of hydrogen concentration in AISI 316L stainless steel monitored perpendicularly to the flat sample surface up to a depth of 0.8 μm showed that conventional and magnetoelectropolishing diminishes significantly the H concentration, depending on the process conditions [241].

    SIMS spectra are multicomponent, evidencing many ion species (of elements and of chemical groups or small molecules); For instance we detected by SIMS about 15 elements in the dental composite Tetric Ceram, let apart compound ions and molecular groups (Preoteasa and Colceag, unpublished). Therefore their interpretation requires sometimes multivariate analysis to extract information from complexity [242,243].

    In brief, SIMS is a highly sensitive technique for surface characterization of nanoparticles of native and substituted Ca phosphates, carbonates and glasses, as well as of composites, glass-ionomers and cements. It is well suited for the study of organic/inorganic coatings of dental materials and of adhesion and adsorption processes. Although it is only qualitative or semiquantitative in the absence of standards, the capacity of detecting all elements as well as molecular fragments, together with its utmost sensitivity recommends SIMS as one of the most promising methods for future dental materials' research.

    To summarize, methods based on scattering processes produced at the specimen surface under the bombardment of ion beams—namely backscattering (RBS), recoil (ERDA) and sputtering (SIMS)—proved highly useful in the characterization of dental materials. Although RBS and ERDA are suited for the analysis of low and medium Z elements, together with PIXE they cover the entire periodic table; concurrently, SIMS detects all elements from H to U as well as molecular fragments. Moreover RBS and ERDA have the unique advantage of being standard free, absolute methods, which allows a (semi) quantitative analysis of dental biomaterials even in the absence of reference materials. In particular, all methods proved extremely useful for the analysis and depth profiling of protective films deposited on Ti implants, of organic coatings formed by adsorption, as well as for the study of adhesion of dental materials on hard dental tissues. They are expected to contribute in further studies together with PIXE, PIGE and NRA to the development of new dental biomaterials.


    7. XPS and AES

    With the SIMS technique discussed above we approached a set of surface analysis methods which give information not only on the elemental composition but also on the chemical environment of the detected atom. In general, the incident particles can be ionic clusters, ions, photons or electrons. In the IBA techniques, the emerging particles are photons and ions; in the XRS methods they are photons and electrons. When the emerging particles are electrons, we deal also with a method of electron spectroscopy (ES). X-ray photoelectron spectroscopy (XPS) and Auger electron spectroscopy (AES) are ES methods for surface analysis of solids [23,26,27,34,35,190]. They provide both elemental and chemical information; by the later attribute, they are related to some degree to SIMS and also to EXAFS and XANES which will be presented later.


    7.1. The methods

    Principles and general aspects. In XPS and AES, an atom in the surface layer is ionized in its outer orbitals and emits an electron. In AES the electron emission is stimulated by bombardment with electrons of a few keV, while in XPS the electron emission is stimulated by soft X-rays (of similar energy). Thus the electron is ejected either by photoelectric effect (in XPS) or by Auger effect (in AES); the electron energy is measured and analyzed. The electron binding energy of each of the emitted electrons can be determined, and this gives the information about the chemical bonds involving the analyzed atom. Therefore both techniques recognize elements and also their chemical bonding state by the kinetic energy of ejected electrons [23].

    Both techniques analyze ultrathin layers at the surface of the sample because the electron escape depth is very small. For example, the escape depth of an electron of 10,100 and 1000 eV is 0.5, 2 and 5 nm, respectively. As a consequence, the matrix effects are very small [35]. AES is performed with an analytical SEM microscope, while XPS is presently conducted with focused X-rays beams of synchrotron radiation. The energy of Auger electrons is lower than that of photoelectrons and this limits both the escape depth and the sensitivity of AES. Accordingly, the applications of AES are more relevant for phenomena involving only the topmost monolayer(s) of atoms and molecules, and there are appreciably fewer studies by this method than those of XPS in the field of dental materials. Therefore we do not describe here AES in more detail and we focus on XPS, a method of broad use due among other to its higher sensitivity. XPS and AES have made the object of books and chapters [26,27,190] and have been discussed comparatively in review articles [23,34,35].

    Chemical shift mechanisms in XPS, bonding of atoms and energy levels. XPS—initially called electron spectroscopy for chemical analysis (ESCA)—is a quantitative spectroscopic technique that irradiates a material with a beam of monochromatic X-rays while simultaneously measuring the kinetic energy and counts of electrons that escape from the top layer 1 to 10 nm thick of the material being analyzed, to determine the elemental composition of the surface, as well as the chemical bonds or the electronic state of the atoms [27,34].

    Because the sample is irradiated with relatively soft X-rays (<10 keV), ionization occurs in the innermost electronic shell (n = 1) only for low Z atoms of the 2nd period, e.g., C(1s), O(1s), F(1s), and in the upper electronic shells (n = 2, 3, …) for higher Z atoms of the 3rd period, like Si(2s), P(2s), S(2s), Cl(2s), of the 4th period including for instance Ti(2p), Ti(3p), Fe(2p), Fe(3p), Zn(2p), Zn(3p), of the 5th period illustrated by Ag(3p), Ag(3d), etc. These photoelectrons carry information from the core-level orbitals, which are not directly involved in chemical bonding but are influenced by the valence orbitals and by the interactions between them. Each photoelectron gives a principal photoionization peak with a discrete energy, which is characteristic to each element but which shows a chemical shift depending on the bonding state of the atom and on the energy level picture of the surface layer. Therefore XPS can distinguish between different compounds of the same element present concomitantly in a sample. At higher energies in the XPS spectrum appear also lines due to transitions between electronic levels which occur during the primary photoionization event [34], e.g., C(KLL), O(KLL), Fe(LMM). The valence band and electron density at the atomic or molecular surface monolayer may differ from the bulk because of the reduction of bonding atoms number at the surface [35]. Thus the surface may show a chemical shift with respect of the bulk and XPS is very sensitive to adsorption of impurities and molecules, to surface chemical reactions or to segregation of polymers on the surface due to the specific differences in surface bonding [34].

    Detected elements and sensitivity. XPS detects all elements above lithium (Z ≥ 3). The XPS is sensitive to impurities down to 0.1–0.2% of the surface monolayer concentration, corresponding to ppm level in the bulk if the impurity is segregated in the first few monolayers. However, detection limits for most of the elements are in the parts per thousand range (0.1%) in bulk. The sampling depth can extend from several molecular layers or 1 nm, up to 10 nm, and depth profiling of the surface can be done [34]. Because the analyzed surface layer is very thin, XPS is very sensitive to the surface roughness and may require polishing for quantitative analysis.

    Experimental setup. The usual radiations used in XPS are the Al Kα and Mg Kα lines, or synchrotron orbital radiation below 10 keV. For measurements on the surface specific valence band and Fermi level energies but without the inner core levels, UV radiation of 20–40 eV is used for excitation and we deal with UV photoelectron spectroscopy (UPS). An optimized geometry of the experimental setup may increase the signal from the sample surface, similarly to PIXE, PIGE, EXAFS and XANES. Angle dependent photoemission and use of polarized X-rays, as the synchrotron radiation is, can give information on the surface structure and on the symmetry and orientation of adsorbed species [35].

    Accuracy and image resolution. Quantitative accuracy depends on several parameters such as: Signal-to-noise ratio, peak intensity, accuracy of relative sensitivity factors, correction for electron transmission function, surface volume homogeneity, correction for energy dependency of electron mean free path, and degree of sample degradation due to analysis. Under optimum conditions, the quantitative accuracy of the atomic percent is 90–95% of each major peak. The quantitative accuracy for the weaker XPS signals is of 60–80% of the true value.

    Image resolution of spectroscopic maps at levels of 200 nm or below has been achieved on imaging XPS instruments using synchrotron radiation as X-ray source.

    Sample degradation during analysis occurs mainly at atomic level and consists in free radical formation. It depends on the sensitivity of the material to the energy of X-rays used, the total dose of the X-rays, the temperature of the surface and the level of the vacuum. However the ejection of electrons from the sample surface by the intense synchrotron X-rays leads to the accumulation of positive surface charges which have to be neutralized because they distort the results of photoelectron energy measurement.


    7.2. Applications of XPS and AES

    XPS appears to be one of the most extensively applied methods of surface analysis in the field of dental materials research. Within this class of applications, about one half is focused on Ti implants and one third on hydroxyapatite and other Ca phosphates; but there is a remarkable diversity in the nature of investigated materials which goes from metallic alloys to polymers extracted from various organisms used in dentistry.

    Dental alloys, implants and protective coatings. The flourishing evolution of XPS to dental materials grew on the experience of detailed studies on the composition of fluoridated dental enamel and the depth profiles of C, F, P and Ca at the tooth surface [244]. The interactions between superficially applied fluorides and enamel as revealed by the identified chemical compounds were also approached in early studies [245]. XPS has been used for the characterization of Ti and Ti alloys surfaces [246] as well as of TiO2 thin films [247,248] in conditions relevant for the interactions occurring in the biological environment (review by [40]). Surface phenomena in the presence of H2, O2, N2, NH3 and OH such as adsorption, chemisorption and oxidation have been investigated [249,250,251,252]. In particular, mixed oxidation states at oxidized Ti surface have been revealed [253]. Moreover XPS studies include, among other, the following topics on materials used in dentistry: corrosion of a stainless steel and its protection [254], formation of nanostructured coating on NiTi alloy by plasma electrolytic oxidation [255,256] and surface characterization of recently marketed Ti implants [257]. In Figure 4 an example of XPS spectra of the same TiN thin layer prepared by cathodic arc deposition as presented before (see Figure 3) is shown [220]. In addition to the elemental composition, the XPS spectra revealed the chemical bonding of different compounds existing at the surface of the TiN coatings. It was found that a basic cvasistoichiometric TiN compound (N/Ti ≈ 1) was covered by a mixture of Ti2O3 and TiNO, with relative concentrations depending on the deposition parameters. Along this line, modifications of the Ti implants surface by various procedures were studied. These included plasma electrolytic oxidation [255,258], hydrofluoric acid treatment [259], and acid etching, anodization, deposition of Ca/P and sand blasting [260,261]. The purpose of such surface treatments was not limited to surface protection of Ti implants against corrosion, but it aimed also for improving their wettability and osseointegration [261]. Even more, XPS was used to characterize implants with enhanced antibacterial activity by antibiotic decoration [262]. Within the class of biocompatible implants, a particular interest was shown in studies by XPS and AES for the deposition and growth of hydroxyapatite (HA) on the Ti implant surface [263,264]; Ca phosphates nucleation on Ti surfaces, which may occur at the implant-bone interface, has been evidenced by XPS and IR [265].

    Figure 4. XPS spectra for Ti(2p), N(1s) and O(1s) peaks of a TiN coating layer prepared by cathodic arc deposition (the same as in Figure 3), together with the last square fit of the peaks. A take-off angle of 55° with respect to the sample normal was used. The resolution was ~1.6 eV. Mixed Gauss/Lorentz functions were used for the peak-fitting. (Reproduced from [220] with permission).

    Ceramics, composites, glass ionomers, polymers. The XPS of implant mineral coatings was paralleled by studies on the HA itself [266,267,268] and on other Ca phosphates [230,269,270]. Other materials with different use in dentistry include ceramics like oxides and carbonates of Ca, Sr and Ba [271] and ZrO2 with enhanced hydrophilicity and biocompatibility obtained by oxygen plasma treatment [272]. Such filling ceramics are incorporated in restorative biomaterials where they are embedded in an organic polymer matrix.

    As XPS has the advantage of analyzing both light organic and heavy inorganic elements, it has been applied in studies of dental composites [273] and hydroxyapatite-containing glass ionomer cements (Roche KJ, Stanton KT (2012) Improving mechanical properties of glass ionomer cements with fluorhydroxyapatite nanoparticles. Available from: https://www.dcu.ie/sites/default/files/conference_sbc/Kevin%20Roche_UCD.pdf). Moreover the interfaces of dentin with glass ionomer cement [274] and with bonding conditioners [275] have been examined by XPS. On the background of XPS applications in polymer physics and chemistry [34], organic biomaterials of dental use were investigated with this method. Such studies include polymers of composite's organic matrix type [276], dental adhesives [277] as well as HA-reinforced chitosan [278] and chitosan-alginate supramolecular complexes [279]. Carefully XPS examination has been made for mineral standards of biological interest [280] to be used in studies of Ca phosphates for dental materials.

    In the above investigations, XPS was sometimes accompanied by AES [257,263]; it was usually combined with structural methods like XRD, with molecular spectroscopy like FTIR, with other surface analysis methods like SIMS, with elemental analysis techniques like EDS/EPMA, as well as with microscopy imaging including SEM, TEM, AFM and OM.

    Tests to perform micro-XPS with 650 eV photons and 10 µm lateral resolution at the Elettra synchrotron (Trieste) of a Valux Plus (3M) dental composite (Gregoratti L, Preoteasa EA, Preoteasa ES, unpublished; quoted in [39]) were not conclusive because of the strong and inhomogeneous electrical charging of the biomaterial under the intense soft X-ray irradiation. This produced variable and incontrollable drift of spectral lines in the electron energy spectra of different areas. Lateral resolution was limited to 10 µm because focusing increased the local charging. The peaks of ~135,115, 88 and 60 eV might be attributed probably to O(2s) and Si(2s) from the SiO2 and ZrO2 fillers and from the organic polymer, but other assignments (such as Zr and less plausibly Ca or N) could not be excluded. The peaks at 135 and 115 eV showed a complex structure with two or three components suggesting the same element in different environments, e.g., O in SiO2, in hydroxyapatite, in a borosilicate glass, in BaO, in ZrO2 and in the organic polymer; and Si in SiO2 and in glass. These preliminary results, though negative, suggest that improved measurements of dental composites would require an electron flood gun to neutralize positive charges. Given the small escape depth of photoelectrons (somewhere between 2 and 5 nm), this solution would avoid possible complications which may appear in the case of surface covering with a conductive thin layer (e.g., of C or Au).

    To sum up, XPS (and to less extent AES) are excellent surface analysis techniques which found many applications in dental materials research, mainly for the elemental, chemical and electronic characterization of coatings on Ti implants and ceramics filling particles as well as for the understanding of F chemistry in hard dental tisues. XPS is an information rich technique, with broad use and with a relatively easy interpretation of data [34]. Without any doubt, developments of XPS (and AES) applications along these lines and new ones, involving for instance composites, glass ionomer cements and bioactive phosphate glasses will continue.


    8. EXAFS and XANES

    Extended X-ray absorption fine structure (EXAFS or XAFS in brief) and X-ray absorption near edge structure (XANES) also called near-edge x-ray absorption fine structure (NEXAFS) are two X-ray spectroscopic methods [28,29,30,281] now in full swing, including for dental biomaterials applications. An introduction to the theory and experimental aspects of EXAFS and XANES [282] and a conceptual account in historical perspective [283] are available. A brief presentation can be found also in a general review on biomedical applications of synchrotron-based methods [38].


    8.1. The methods

    Principles and general aspects. EXAFS and XANES give chemical information of molecular and electronic structure, similarly to XPS and somewhat to SIMS. Their take-off is vitally associated with the advent of synchrotron facilities able to provide tunable high brilliance beams of X-rays. When the incident X-ray energy matches the binding energy of an electron of an atom, the number of X-rays absorbed by the sample and the corresponding absorption coefficient µ increase dramatically, causing a drop in the transmitted X-ray intensity. This results in an absorption edge. However, in certain experimental conditions one observes a "fine" structure before and after the main edge in the X-ray absorption spectrum, and these less intense lines are dependent upon the chemical state and environment of the absorbing atom.

    By the measurement of the fine structure in the absorption spectrum, EXAFS and XANES can therefore yield detailed information about the chemical bonding involving the absorbing atom. They can not only help recognizing specific molecular groups, but they can also monitor speciation and changes by chemical reactions. The detected species can be mapped with focused microbeams of synchrotron X-rays just as in SRXRF.

    The XANES spectrum is collected in a domain about 100 eV below and above the absorption edge, while the EXAFS spectrum occurs in a region of about 1500 eV from the edge on. The two domains overlap close to the absorption edge and some authors use the term XAFS for the spectra recorded about the confluence zone; other uses of this acronym make it even more ambiguous.

    The physical basis of the methods as illustrated by EXAFS. The physical phenomena involved in EXAFS and XANES are different to some extent and more complex than in other absorption spectroscopy methods. While the absorption edge can be explained with the simple Bohr's planetary atom model, the fine structure near the edge in the X-ray absorption spectrum can be understood only with the correct quantum theory using electronic wavefunctions instead of circular trajectories [282,283]. By ascribing a central role for the photoelectron ejected following the absorption of incident X-rays, EXAFS an XANES have also a common point with XPS, although they are based on very different principles.

    The ejected photoelectron's energy will be equal, in general, to that of the absorbed photon minus the binding energy of the initial core state. The X-ray absorption fine structure is determined from the dipole transition matrix between the initial K-state and the final photoelectron state. For certain energies of the X-ray photon which appear in the fine structure, the final state of the photoelectron is an outer unoccupied electronic orbital. Such outer orbitals are influenced by the neighboring atoms and by their bonding to the absorbing atom. They are particularly relevant in EXAFS. Their structure and energy depend also on the process of photoelectric ejection of an inner electron which subsequently occupies them.

    In EXAFS, the ejected photoelectron is described by a spherical probability wave which expands in the lattice and is partially scattered by neighbors of the absorbing atom. The neighboring atoms are treated as point scatter centers. The total scattered wavefunction is summed from the waves scattered by each atom. It then interferes with the incident spherical wave and the resulting wavefunction produces the interference pattern typical to the EXAFS spectrum. Due to the above processes, the final wavefunction will contain information from the neighboring atoms [282,283]. The EXAFS spectra show zeroes located proportionally to the zeroes of the half integer Bessel function. This type of pattern appears in the solution of the wave equation for a particle in a spherical cavity. In a simple model postulated for EXAFS, the central absorbing atom was surrounded by atoms forming a regular polyhedron (e.g., a metal ion in the center of a regular octahedral complex); the non-distorted polyhedron was further approximated by a spherical potential well with impenetrable walls and of equivalent volume. This simple model in spite of its approximations could explain many experimental data and showed how the EXAFS spectrum carries information on the mean length and electronic structure of the chemical bonds between central and neighboring atoms. Because the neighboring atoms distort predominantly the outermost orbitals and their energy levels, EXAFS is a short range order effect determined primarily by the first neighbor atoms [283]. The mentioned model included only the first neighbor distance and spherical symmetry; in subsequent generalizations, extensions were made to include more complex lattices and defect structures.

    In XANES similar but even more complex effects occur, involving multiple-scattering resonances of the photoelectrons ejected at low kinetic energy; the processes have in common with EXAFS the "feed-back" from the neighboring scatterer atoms. Hovever in the low energy range (5–200 eV) of the photoelectron kinetic energy the electron scattering amplitude becomes much larger so that multiple scattering events become dominant in XANES.

    More on the potential of EXAFS and XANES. Both methods give information on oxidation state of the absorbing atom, local symmetry around it and its distortions, first neighbor mean distance, other interatomic distances and bond angles, bond types and energy. This kind of information is similar to that provided for instance on coordination complexes by EPR and Mössbauer spectroscopy. But while the later is limited to the Mössbauer elements present in dental materials (e.g., Fe and Sn in certain dental alloys or amalgams or SnF2 in some dentifrices) and the former applies only to transition metal ions, EXAFS and XANES work for almost all elements (in principle for elements with Z ≥ 3). Also because the two X-ray absorption methods depend only on the first neighbors, EXAFS and XANES may be used for any kind of samples (crystalline and amorphous dental materials). Note finally that matrix effects occur due to self-absorption of X-rays in the sample, just as in XRF and PIXE.

    Experimental aspects. The best observation of EXAFS and XANES spectra is achieved when the experimental setups satisfy either the thin sample limit or the thick, dilute sample limit. For relatively thick, concentrated samples, the absorption from the element of interest and the attenuation due to other effects become close and the XAFS spectrum can be completely lost (similarly to XRF or PIXE with a high background). If the self-absorption is not too severe, it can be corrected by use of appropriate equations. For strong self-absorption effects in thick, concentrated samples, where corrections are not sufficient, a setup geometry near the grazing exit limit is recommended [282]. Measurements can be made in transmission and fluorescence modes. In the later, self-absorption plays a very important role. The preparation of thick samples of dental materials is most convenient for the fluorescence mode, but the fine structure spectra of highly concentrated elements could be hidden by the intense absorption edges. Note that there are experimental analogies and differences of XAFS on one hand with PIXE, XRF, optical fluorescence and spectrophotometry on the other.

    Sample degradation and accuracy. The EXAFS and XANES techniques are completely nondestructive and noninvasive, at least at the level of optical microscopy examination. Nevertheless the intense synchrotron radiation produces ionizations and free radicals in the analyzed layer which could be detected by EPR and which could affect the quantitative analysis of XAFS. The accuracy is of about 10–20% in good conditions.

    Sensitivity. The sensitivity of EXAFS and XANES is comparable to SRXRF. Detection limits down to 1–10 ppm could be obtained with synchrotron radiation of 109–1010 s−1 µm−2 photon flux generated by a machine with wigglers and undulators.

    Lateral resolution. With a synchrotron radiation microbeam focused with X-ray optics the lateral resolution is usually of about 10 µm; but in the best possible conditions it may reach 0.3 µm like in µ-SRXRF.

    In a final comparison, let us mention that the XANES spectrum is much more intense than that of EXAFS; it is easier to crudely interpret but at the same time it is harder to fully interpret.


    8.2. Applications of EXAFS and XANES

    Overview. Given the complexities in the interpretation of spectra, EXAFS and XANES have been applied mainly, but not exclusively, for the characterization of pure dental materials' components, like ceramics and glasses, instead of the final products as e.g. composites where the same element can exist in various chemical environments (e.g., in a composite O may coexist in apatite, glass particles, SiO2, ZrO2 and organic polymers). Studies have been performed by EXAFS or/and XAFS [141,284,285,286,287,288,289,290], by XANES [211,291,292,293,294] or by both methods [72,295,296,297], often in combination with other surface analysis techniques like EDS [286], XRF [72], PIXE [141] and RBS [211], with molecular spectroscopy methods like NMR [288,289,296] and FTIR [211], and with crystallographic and topographic determinations by XRD [72,286,288,290], by neutron diffraction [288], and by scanning transmission X-ray microscopy (STXM) [293,294].

    Dental amalgam, alloys, implants. A large diversity of dentistry-relevant materials, their changes during the oral use and the tissue contamination has been investigated by EXAFS and XANES. In aged dental amalgam the formation of Hg sulfur compounds was evidenced [284]. Ektessabi et al. [141] analyzed the chemical state of the eroded and dissolved metals from a metal-polyethylene prosthesis. Uo et al. [285] monitored the dissolution of the TiNi alloy and of a stainless steel in oral environment-like media. The fate of Ti and of stainless steel debris from implants was followed for their pro-inflammatory impact [72]. In a patient with a dental work made by an Ag–In–Zn–Ga–Pd alloy, traces of Ag and Zn detected in the mucosa were shown by Sugiyama et al. [7] to be not metal debris but insoluble Ag2S precipitate and hydrated Zn ions accumulated in the tissue. Similarly, oral mucosa in contact with a dental implant evidenced particulate metallic Ti debris and homogeneously distributed TiO2 from dissolved and oxidized Ti [53,298]; these studies have been reviewed [6].

    Glass, apatite, other Ca phosphates, ceramics. Because of their ability to characterize amorphous solids, the X-ray absorption spectroscopy methods are of major interest for newly prepared bioglasses. Such studies include a bioresorbable Ti-containing glass [291] and a Ga-doped phosphate glass with antimicrobial activity [290] as well as several bioactive Ca phosphate glasses [288,289,295,296]. In addition, detailed characterization of apatite [297], other Ca phosphates [289,293,299] and zirconia-hydroxyapatite composites [286] was done. Among ceramics, ZrO2 stabilized by Y2O3 has been studied [287]. The phosphorus mineral standards for Ca phosphate-containing biomaterials were carefully examined [292].

    To conclude, a variety of dental materials constituents have been and are being studied with EXAFS and XANES, due to their capacity to give information on the oxidation state, on local symmetry and its distortions, and on bonds' length, angles, type and energy. It is noteworthy that these methods demonstrated their utmost power especially for biocompatible glasses, apatite and other Ca phosphates and ceramics, as well as for the chemistry involved in the contamination of the oral mucosa from metallic works and implants. One may be sure that their applications in dental materials' research will continue.


    9. The methods and their applications in dental materials research: A retrospect

    As we approach the end of this review, a "big picture" on the atomic and nuclear surface characterization methods is emerging from the viewpoint of applications to dental materials. The reviewed methods included XRF, SRXRF, PIXE, PIGE, NRA, PALS, PAA, RBS, ERDA, SIMS, XPS, AES, EXAFS, XANES and the corresponding microbeam versions. It is our hope that the present review may help the dental researcher to select the appropriate method and prepare the sample, and the physicist to optimize the experimental setup according to the characteristics of the specimen. The general picture (Table 5) presents the methods' applications in dental materials research together with the depth of analyzed layer, the nature of information provided (elemental, depth profile, surface mapping, chemical groups and bonds, etc.) and the damage produced to the sample (or its absence). According to the last criterion, all methods are nondestructive and some of them—those which use X-rays for excitation—are almost noninvasive. XRF and µ-SRXRF are presented separately because the great differences between their performances based on the enormous intensity of synchrotron radiation as compared to any other X-ray source. This makes that other XRS methods as well—XPS, EXAFS, XANES—to be almost exclusively synchrotron-dependent today. On the other hand the experimental differences between broad beam and microbeam IBA methods are not so dramatic—except the sample damage, dependent on different current densities when the same type of beam is focused or not—and thus they are presented together. In the table there is only one bulk analysis method (PAA), but it is an emergent method which could provide bulk concentrations for comparison with the concentrations measured by surface analysis methods. The second emerging method, PALS, although giving no information on elemental composition and distribution, detects the pores and defects down to subnanometric size in the surface layer of the sample. Altogether, the proper use of selected methods may provide a most complete characterization of dental materials, from elemental composition and distribution to chemical nature and electronic structure of analyzed specimens.

    Table 5. Atomic and nuclear surface analysis methods and their applications in dental biomaterial research in a glimpse.
    Method Analytical depth. Type of information Sample degradation Main applications in dental biomaterials' and related research
    XRF Thick/thin layer. Elemental analysis. Non-destructive. Noninvasive Dental alloys. Diagnosis of metal allergies related to metallic dental restorations. Pb in children teeth. Ti implant debris in oral mucosa. ZrO2 and other dental ceramics. Endodontic and orthodontic materials. Field applications of portable XRF spectrometers. Dental composites in forensic applications.
    µ-SRXRF Near surface, thick/thin layer. Elemental analysis. Surface mapping. Non-destructive. Noninvasive Trace analysis and mapping in tissues: debris and leaking from Ti implants and other dental metallic restorations in oral mucosa and in hard dental tissues and bone.
    PIXE and µ-PIXE Thin layer. Elemental analysis. Depth profiling. Surface mapping. Non-destructive Trace analysis of metals released by corrosion and friction wear from dental amalgam, metallic restorations and implants of Ti and stainless steel. Metal diffusion in teeth. In vivo measurement of Ti release with external beam PIXE. Corrosion resistance of bioceramics thin films on Ti and other metallic implants. Analysis and mapping of dental composites, glass ionomers, endodontic materials. Alterations of composites and glass ionomers during use. µ-PIXE-PIGE of composite-tooth interface: Ca and F interdiffusion zone.
    PIGE and µ-PIGE Thin and surface layer. Low Z element analysis. Depth profiling. Surface mapping. Non-destructive F distribution in F-releasing materials (FRM) and in teeth. In vivo PIGE of F in teeth with external beam. Retention of F from FRMs, laser-enhanced retention. F changes in composites during use. µ-PIXE-PIGE of the composite-tooth interface: Ca and F interdiffusion zone, deeper than the contact zone.
    NRA and µ-NRA Thin and surface layer. Low Z element analysis. Depth profiling. Surface mapping. Non-destructive F distribution in F-releasing materials (FRM) and in teeth. Distributions of C and N (from organic components). Laser modifications of enamel surface. Oxide and nitride surface layer modifications for corrosion protection of Ti implants. Non-uniformity of protective layers.
    PAA (emerging method) Elemental analysis, bulk. Non-destructive. Noninvasive Elemental analysis of dental composites and other dental materials.
    PALS (emerging method) Surface layer. Sub-nanometer pores and defects. Non-destructive. Noninvasive Sub-nanometer pores and defects in the protective layers of dental implants.
    RBS Thin and surface layer. Low Z element analysis except H. Depth profiling. Non-destructive Composition, thickness and structure of protective layers (Ca phosphates ceramics, HA, Si oxinitride, implanted Mg ions, beam sputtered Nb) on Ti implants. Low Z element analysis (except H).
    ERDA Thin and surface layer. H and low Z element analysis. Depth profiling. Non-destructive Composition, thickness and structure of protective layers (Ca phosphates ceramics, amorphous diamond-like carbon coatings, H depth profile in amorphous carbon layers) on Ti implants, H profile on steel. Laser deposited HA and Ca phosphate films. Analysis of medium and light elements including H.
    SIMS Surface nano-layer. Analysis of all elements, and of molecular groups and fragments. Depth profiling and mapping. Non-destructive Dfferentiation of bioceramics (HA, fluorapatite, Ca phospahates polymorphs/carbonate, Zn polyphosphate glasses). Changes of Ca silicate cements in oral use. Glass-ionomers and composites analysis. Adhesion of glass-ionomer cements to dentin. Adhesion of silanized ZrO2 granules to resin. Organic coatings (with proteins, glycans) of dental materials. Coatings of implant Ti alloys (Sr based coatings, phosphoric acid treatment of Ti, porous Ti in biological use).
    XPS* and AES (*with SR) Surface nano-layer. Analysis of all elements except H, chemical bonds, orbital hybridization. Depth profiling and mapping. Non-destructive. Noninvasive F chemistry in dental enamel. Corrosion of stainless steel, alloys. Protective coatings of Ti alloys by various methods. HA and other Ca phosphates deposition on Ti. Surface treated ceramics (oxides and carbonates of Ca, Sr and Ba; ZrO2). Glass ionomers, composites, dentin interactions. Adhesives. HA-reinforced chitosan, chitosan-alginate.
    EXAFS and XANES (with SR) Thin layer. Analysis of all elements except H, chemical bonds, local geometry, electronic structure. Surface mapping. Non-destructive. Noninvasive Valence state and compound identification. Chemical bonding. Coordination symmetry. Hg sulfur compounds in aged dental amalgam. Corrosion and friction wear of Ti and various alloys. Ag2S precipitates in mucosa from dental alloy, Ti debris and TiO2 from implant. Bioglasses dopped with Ti and Ga. Ceramics (HA, Ca phosphates, ZrO2-Y2O3). Dental composites.
     | Show Table
    DownLoad: CSV

    A special mention is worth making for the importance of high quality certified reference materials of similar elemental composition, physical structure and surface roughness. In fact one major difficulty in the analysis of thick samples of dental materials, is the lack of standard materials and certified information on sample's composition [39,77]. Standards are essential especially for accurate elemental analysis by XRF, PIXE, PIGE, NRA [9,21,22,23,78,129,171,172], and SIMS [21,23,24,25,34], but also for some applications of the methods which primarily give chemical information. Thus mineral standards are necessary for XPS [35,40,280] as well as for EXAFS and XANES [28,29] in the analysis of Ca phosphate-containing biomaterials in particular [292].

    RBS and ERDA are unique among IBA methods by the advantage of being standard free, absolute methods; this allows a quantitative or semiquantitative analysis of dental biomaterials even in the absence of reference materials. However, for current IBA applications which detect simultaneously PIXE, PIGE and RBS, the standardless analysis is confronted with difficulties which should not be underestimated [77].

    In particular, portable XRF spectrometers may provide relatively reliable results for dental alloys but even for precise analysis of alloys reference materials are needed [51]. For the analysis of Ca-rich materials the handheld instruments may be used only with standards.

    In order to improve the accuracy and precision of quantitative analysis for the dental biomaterials with unknown composition, preparation of proper reference materials is recommended whenever possible. Special care is needed for the homogeneity, background correction, and for use methodology validation [9,78]. In this approach, the use of complementary ion beam techniques may be highly useful [77,115].

    The present trend is towards "total IBA" which combines and integrates RBS, ERDA and PIGE not only with PIXE and NRA, but also with EBS, STIM, tomography and MeV-SIMS. A state-of-the-art account of new techniques and concepts together with a detailed glossary of IBA and related methods is available in a review of this topic [300]. On the other hand total IBA combined with the vast possibilities provided by the nuclear microprobe [102,301] and with appropriate standards may represent a unique instrument for the study of dental materials.

    Besides µ-SRXRF, µ-PIXE, µ-PIGE and µ-NRA, other methods including RBS, ERDA, SIMS, XPS, EXAFS and XANES can also be performed with microbeams (not specified explicitly in the table).

    The present survey of the literature is by no means exhaustive (which would rise probably up to about one thousand titles), but it is representative. A histogram of the number of publications in the field of XRS and IBA applications in dental materials research and in related topics (Figure 5), based on 200 titles representing two thirds of the titles quoted in this review, shows that the field is in expansion (at first sight, for the last decade this is not obvious because the last five years are not complete). In the period 2005–2015 we quoted a mean number of 9–10 published articles each year. For the period 2015–2020 the yearly normalized expectation value in the histogram of Figure 5 would be around 47–70 articles; the actual number would be at least twice these numbers. At the end of 2020 the histogram will show whether the increase continues or a plateau with a steady yearly publication rate will be reached. However, the data suggest that the applications in dental materials' research of atomic and nuclear surface characterization methods have reached maturity and, although a highly specialized field, they show a high and sustainable dynamics.

    Figure 5. Histogram of quoted publications appeared between 1975 and 2017 in the field of applications of nuclear and atomic surface analysis methods to dental materials' research and related subjects. The incomplete period 2015–2020 is marked by a dashed contour.

    10. Conclusions

    A large diversity of thin layer and surface characterization methods based on atomic and nuclear interactions and their applications to a not lesser diversity of dental materials' types has been reviewed. The main methods are dependent on particle accelerators as they use beams of accelerated protons and heavier ions—PIXE, PIGE, NRA, RBS, ERDA—or beams of X-rays, in particular synchrotron orbital radiation—namely XRF, XPS, EXAFS and XANES; as an exception, SIMS uses low energy ions as projectiles; two emerging methods (PAA and PALS) using other sources of exciting radiations have been also presented briefly. The list is far from complete, as other important and widely used methods—e.g., EPMA, XRD, FTIR and Raman spectroscopy—have not been included in the review. But even so, the type, number and variety of applications of the IBA, XRS and ES methods in dental material research are impressive.

    All the methods discussed above are nondestructive, which offers the advantage that the same sample may be measured several times with the same or different methods by analyzing the same or different area, after being subjected to the action of various factors relevant to the oral environment. Moreover the preparation of sample is minimal, e.g., by covering with a thin conductive layer of carbon or metal, which preserves the natural state of the examined material.

    The methods treated above were applied to dental alloys, Ti implants and their nanometric protective coatings, apatites and other Ca phosphates, ceramics, bioglasses, glass ionomer cements, composites and other F-releasing materials, adhesive resins, etc. The interactions of these materials with enamel and dentin, as well as the influences, effects and contamination produced by them in hard and soft oral tissues have been studied also with the characterization methods which make the object of our review.

    As expected, it resulted that not all methods have been applied to every type of biomaterial and that some techniques demonstrated excellence in particular types of applications. Each method has its specificity and works better for certain systems, thus an optimization of the approach depends on a good choice of the method. This is possible due to the large palette of characterization possibilities presented above, and the aim of this review was to facilitate orientation within the outlined picture. Obviously, no method can give information on the specimen as complete as possible at all levels. Sometimes more methods were applied in the study of a given material for mutual corroboration and support—but also for the complementarity of the information they could provide at different levels of elemental composition, chemistry and structure. The dental materials benefited fully of the multimethod approach, which is particularly suited for them, as for most of such materials there are not yet available proper reference materials. Therefore the problem of standards was considered carefully, as it provides the most accurate solution to the correction of matrix effects. The later are inherent especially for thick samples, which is usually the most convenient form for preparing the dental materials specimens. Appropriate standards are necessary especially for some restorative, endodontic and orthodontic materials because they are "difficult samples" (electroinsulating, granular, heterogeneous) from the viewpoint of the analysis methods discussed here.

    The annual rate of publications treating XRS, IBA and similar methods' applications to dental materials research and related topics is positive and evidences the maturity of the field. One can expect that this rhythm will be maintained in the next years, in particular because the number of experimental facilities—small energy heavy ion accelerators with or without microbeam systems and electron synchrotrons—will increase throughout the whole world, including in the developing continents. A second reason is that new methods continue to emerge and the existing ones, as well as the associated computational capabilities, are continuously developed. A third one is that all these methods are non-destructive and some of them are also noninvasive; together with the minimal preparation of sample, this provides them with a higher flexibility in applications. A fourth one is that some of the problems encountered with the analysis of the "difficult" dental materials are of basic interest for the techniques, for the experimental study of nanomaterials, and thus are motivating development. And last but not least is the fact that the existing dental materials—in spite of huge progress made in the last decades—still have many imperfections and adverse biological effects. Problems related to the polymerization shrinkage of composites, cracks and wear in composites and glass ionomer cements, defects in the protective coatings of Ti implants, implants corrosion and metal contamination of tissues, etc., are still awaiting their solutions. Dental biomaterials require improvements in their mechanical and chemical properties as well as in biocompatibility. And this requires further research. New dental materials with better properties will be created in the years to come—and in this process the atomic and nuclear surface analysis methods will bring valuable contributions.


    Acknowledgments

    Our thanks are aimed to all those who, one way or another, encouraged us to materialize the ideas of this work. We are honoured to express our gratitude to Profs./Drs. Santiago Gomez, Vincenzo Fano, Rene Van Grieken, Ziga Smit, Jun Kawai, Constantin Ionescu-Tirgoviste, Marian Apostol, Serban Moldoveanu, Vladimir Gheordunescu, Diane Eichert, Luca Gregoratti, Ana Pantelica, Dan Pantelica, Rodica Georgescu, Maria Gavrilus, Ion I. Ursu, Bogdan Constantinescu, Adela Scafes, Dan Gurban, Feride Severcan, Tomas Landete Castillejos, Volker Herrmann, Dieter Grambole, Rainer Groetzschel, Chris Jeynes and Hiroko Yamamoto. One of us (E.A.P.) in particular, would like to pay tribute to the memory of the late Prof. I. Ursu and Dr. Dan Ciomartan.


    Conflict of interest

    All authors declare no conflicts of interest in this paper.


    [1] Craig RG (1997) Restorative Dental Materials, St Louis, MO: Mosby-Year Book Inc.
    [2] Mount J, Hume WR (1998) Preservation and Restoration of Tooth Structure, London: Mosby International Ltd.
    [3] Bayne SC (2005) Dental biomaterials: Where are we and where are we going? J Dent Educ 69: 571–585.
    [4] O'Brien WJ (2002) Dental materials and their selection, Hanover Park, IL: Quintessence Publ. Co.
    [5] Schiffner U (1999) Inhibition of enamel and root dentin demineralization by Ariston pHc: An artificial mouth study. Am J Dent 12: S10–S12.
    [6] Uo M, Wada T, Sugiyama T (2015) Applications of X-ray fluorescence analysis (XRF) to dental and medical specimens. Jpn Dent Sci Rev 51: 2–9. doi: 10.1016/j.jdsr.2014.07.001
    [7] Sugiyama T, Uo M, Wada T, et al. (2015) Detection of trace metallic elements in oral lichenoid contact lesions using SR-XRF, PIXE, and XAFS. Sci Rep 5: 10672. doi: 10.1038/srep10672
    [8] Ektessabi AM, Otsuka T, Tsuboi Y, et al. (1994) Application of micro beam PIXE to detection of titanium ion release from dental and orthopaedic implants. Int J PIXE 4: 81–91. doi: 10.1142/S0129083594000118
    [9] Szaloki I, Osan J, Van Grieken RE (2006) X-ray spectrometry. Anal Chem 78: 4069–4096. doi: 10.1021/ac060688j
    [10] Van Grieken RE, Markowicz AA (2002) Handbook of X-Ray Spectrometry, 2Eds., New York: Marcel Dekker Inc.
    [11] Beckhoff B, Kanngießer B, Langhoff N, et al. (2006) Handbook of Practical X-Ray Fluorescence Analysis, Springer-Verlag Berlin Heidelberg.
    [12] Valkovic V, Moschini G (1993) The use of synchrotron radiation for trace element analysis of biomedical samples. Riv Nuovo Cim 16: 1–55.
    [13] IAEA (2000) Instrumentation for PIXE and RBS; IAEA-TECDOC-1190. Vienna: International Atomic Energy Agency.
    [14] Johansson SAE, Campbell JL, Malmqvist KG (1995) Particle-Induced X-Ray Emission Spectrometry (PIXE), John Wiley & Sons.
    [15] Smit Z (2006) Interaction of particles with matter, School on Ion Beam Analysis and Accelerator Applications. Trieste, Italy: Abdus Salam International Center for Theoretical Physics (ICTP). Available from: http://indico.ictp.it/event/a05196/session/3/contribution/1/material/0/0.pdf.
    [16] Verma HR (2007) Atomic and Nuclear Analytical Methods. XRF, Mössbauer, XPS, NAA and Ion-Beam Spectroscopic Techniques, Springer-Verlag Berlin Heidelberg.
    [17] Gurbich A, Bogdanovic-Radovic I, Chiari M, et al. (2008) Status of the problem of nuclear cross section data for IBA. Nucl Instrum Meth B 266: 1198–1202. doi: 10.1016/j.nimb.2007.11.041
    [18] Demortier G (2003) Non-destructive depth profiling of solid samples by atomic and nuclear interactions induced by charged particles. J Electron Spectrosc 129: 243–271. doi: 10.1016/S0368-2048(03)00077-X
    [19] Meyer O, Käppeler F, Linker G (1975) Ion Beam Surface Layer Analysis, New York, London: Plenum Press.
    [20] Tesmer JR, Nastasi M (1995) Handbook of Modern Ion Beam Materials Analysis, Pittsburg: Materials Research Society.
    [21] Thellier M, Ripoll C, Quintana C, et al. (1993) Physical methods to locate metal atoms in biological systems. Method Enzymol 227: 535–586. doi: 10.1016/0076-6879(93)27023-A
    [22] Bubert H, Jenett H (2002) Surface and Thin Film Analysis: A compendium of Principles, Instrumentation, and Applications, Weinheim, Germany: Wiley-VCH.
    [23] Benninghoven A (1984) A comparison of spectroscopical techniques in surface analysis. TrAC-Trend Anal Chem 3: 112–115.
    [24] Vickerman JC, Brown A, Reed NM (1989) Secondary Ion Mass Spectrometry: Principles and Applications, Oxford: Clarendon Press.
    [25] Wilson RG, Stevie FA, Magee CW (1989) Secondary Ion Mass Spectrometry: A Practical Handbook for Depth Profiling and Bulk Impurity Analysis, New York: John Wiley & Sons.
    [26] Windawi H, Ho F (1982) Applied Electron Spectroscopy for Chemical Analysis, New York: John Wiley & Sons.
    [27] Grant JT, Briggs D (2003) Surface Analysis by Auger and X-ray Photoelectron Spectroscopy, Chichester, UK: IM Publications.
    [28] Koningsberger DC, Prins R (1988) X-ray Absorption: Principles, Applications, Techniques of EXAFS, SEXAFS, and XANES, New York: John Wiley & Sons.
    [29] Stern EA, Heald SM(1983) Principles and Applications of EXAFS, In: Koch EE, Handbook of Synchrotron Radiation, Amsterdam, Oxford, New york: North-Holland, 995–1014.
    [30] Stöhr J (2013) NEXAFS Spectroscopy, Springer-Verlag Berlin Heidelberg.
    [31] Segebade C, Starovoitova VN, Borgwardt T, et al. (2017) Principles, methodologies, and applications of photon activation analysis: A review. J Radioanal Nucl Ch 2017: 1–17.
    [32] Siegel RW (1980) Positron annihilation spectroscopy. Annu Rev Mater Sci 10: 393–425. doi: 10.1146/annurev.ms.10.080180.002141
    [33] Alfassi Z (2001) Non-Destructive Elemental Analysis, Oxford, London: Blackwell Science.
    [34] Gardella JA (1984) Multitechnique spectroscopic analysis of polymer surfaces. TrAC-Trend Anal Chem 3: 129–133. doi: 10.1016/0165-9936(84)80011-4
    [35] Ikeda S (1984) Electron spectroscopy for surface analysis. TrAC-Trend Anal Chem 3: 115–120. doi: 10.1016/0165-9936(84)80008-4
    [36] Malmqvist KG (1995) Biological and medical applications, In: Johansson SAE, Campbell JL, Malmqvist KG, Particle-Induced X-Ray Emission Spectrometry (PIXE), John Wiley & Sons, 167–236.
    [37] Moretto P (1996) Nuclear microprobe: A microanalytical technique in biology. Cell Mol Biol (Noisy-le-grand) 42: 1–16.
    [38] Petibois C, Cestelli GM (2008) Bioimaging of cells and tissues using accelerator-based sources. Anal Bioanal Chem 391: 1599–1608. doi: 10.1007/s00216-008-2157-y
    [39] Preoteasa EA, Preoteasa ES, Suciu I (2012) Atomic and Nuclear Surface Analysis Methods: A Novel Perspective for the Characterization of Dental Composites, New York: Nova Science Publishers, Inc.
    [40] Jones FH (2001) Teeth and bones: Applications of surface science to dental materials and related biomaterials. Surf Sci Rep 42: 75–205. doi: 10.1016/S0167-5729(00)00011-X
    [41] Johansson SAE, Campbell JL (1995) Comparison with other methods, In: Johansson SAE, Campbell JL, Malmqvist KG, Particle-Induced X-Ray Emission Spectrometry (PIXE), John Wiley & Sons, 419–432.
    [42] West NG (1984) X-ray fluorescence spectrometry applied to the analysis of environmental samples. TrAC-Trend Anal Chem 3: 199–204. doi: 10.1016/0165-9936(84)85007-4
    [43] Jenkins R (1976) An Introduction to X-ray Fluorescence Spectrometry, Wiley-VCH Verlag GmbH & Co.
    [44] Bertin EP (1978) Principles and Practice of X-ray Spectrochemical Analysis, New York, London: Plenum Press.
    [45] Murr LE (1982) Electron and Ion Microscopy and Microanalysis: Principles and Applications, New York: Marcel Dekker, Inc.
    [46] Baranowska I, Barchański L, Bąk M, et al. (2004) X-ray fluorescence spectrometry in multielemental analysis of hair and teeth. Pol J Environ Stud 13: 639–646.
    [47] Bloch P, Shapiro IM, Soule L, et al. (1998) Assessment of lead exposure of children from K-XRF measurements of shed teeth. Appl Radiat Isotopes 49: 703–705. doi: 10.1016/S0969-8043(97)00207-8
    [48] Bush MA, Miller RG, Prutsman-Pfeiffer J, et al. (2007) Identification through X-ray fluorescence analysis of dental restorative resin materials: A comprehensive study of noncremated, cremated, and processed-cremated individuals. J Forensic Sci 52: 157–165. doi: 10.1111/j.1556-4029.2006.00308.x
    [49] Bush MA, Miller RG, Norrlander AL, et al. (2008) Analytical survey of restorative resins by SEM⁄EDS and XRF: Databases for forensic. J Forensic Sci 53: 1–7.
    [50] Preoteasa EA, Ciortea C, Constantinescu B, et al. (2002) Analysis of composites for restorative dentistry by PIXE, XRF and ERDA. Nucl Instrum Meth B 189: 426–430. doi: 10.1016/S0168-583X(01)01119-3
    [51] Stankiewicz W, Bolibrzuch B, Marczak M (1998) Gold and gold alloy reference materials for XRF analysis. Gold Bull 31: 119–125. doi: 10.1007/BF03214776
    [52] Uo M, Watari F (2004) Rapid analysis of metallic dental restorations using X-ray scanning analytical microscopy. Dent Mater 20: 611–615. doi: 10.1016/j.dental.2003.08.002
    [53] Uo M, Asakura K, Yokoyama A, et al. (2007) X-ray absorption fine structure (XAFS) analysis of titanium-implanted soft tissue. Dent Mater J 26: 268–273. doi: 10.4012/dmj.26.268
    [54] Obeidat SM, Al-Momani I, Haddad A, et al. (2011) Combination of ICP-OES, XRF and XRD techniques for analysis of several dental ceramics and their identification using chemometrics. J Spectrosc 26: 141–149. doi: 10.1155/2011/894143
    [55] Rauf N, Tahir D, Arbiansyah M (2016) Structural analysis of bioceramic materials for denture application. AIP Conf Proc 1719: 030030. doi: 10.1063/1.4943725
    [56] Nakamura K (2015) Mechanical and microstructural properties of monolithic zirconia [Thesis]. University of Gothenburg.
    [57] Perdigão J, Pinto AM, Monteiro RCC, et al. (2012) Degradation of dental ZrO2-based materials after hydrothermal fatigue. Part I: XRD, XRF, and FESEM analyses. Dent Mater J 31: 256–265.
    [58] Cianconi L, Palopoli P, Campanella V, et al. (2016) Composition and microstructure of MTA and Aureoseal Plus: XRF, EDS, XRD and FESEM evaluation. Eur J Paediatr Dent 17: 281–285.
    [59] Gandolfi MG, Sauro S, Mannocci F, et al. (2007) New tetrasilicate cements as retrograde filling material: An in vitro study on fluid penetration. J Endodont 33: 742–745. doi: 10.1016/j.joen.2007.02.008
    [60] Rodríguez RAC, Hernandez PG, Garcia GM, et al. (2015) Physicochemical analysis of MTA Angelus® and Biodentine® conducted with X ray difraction, dispersive energy spectrometry, X ray fluorescence, scanning electron microscope and infra red spectroscopy. Rev Odont Mex 19: 174–180.
    [61] Elzubair A, Elias CN, Suarez JCM, et al. (2006) The physical characterization of a thermoplastic polymer for endodontic obturation. J Dent 34: 784–789. doi: 10.1016/j.jdent.2006.03.002
    [62] Kawai J (2008) High-sensitivity small-size X-ray fluorescence spectrometers. Horiba Technical Reports, Guest forum, English edit, 12: 52–57.
    [63] Budhdachat K, Klinhom S, Siengdee P (2016) Elemental analysis of bone, teeth, horn and antler in different animal species using non-invasive handheld X-ray fluorescence. PLoS One 11: e0155458. doi: 10.1371/journal.pone.0155458
    [64] Trombka JI, Schweitzer J, Selavka C, et al. (2002) Crime scene investigations using portable, non-destructive space exploration technology. Forensic Sci Int 52: 1–9.
    [65] Shetty SS (2015) Advanced technologies an aid in forensic odontology: An update. Int J Adv Res 3: 1615–1620.
    [66] Bowers M (2010) Forensic Dental Evidence: An Investigator's Handbook, Amsterdam: Elsevier.
    [67] Christensen AM, Smith MA, Thomas RM (2012) Validation of X-ray fluorescence spectrometry for determining osseous or dental origin of unknown material. J Forensic Sci 57: 47–51. doi: 10.1111/j.1556-4029.2011.01941.x
    [68] Zimmerman HA (2010) Preliminary validation of handheld x-ray fluorescence (HHXRF) spectrometry: Distinguishing osseous and dental tissue from non-bone material of similar chemical composition [Thesis]. Florida Gulf Coast University.
    [69] Sanchez HJ, Perez CA, Grenon M (2000) SRXRF analysis with spatial resolution of dental calculus. Nucl Instrum Meth B 170: 211–218. doi: 10.1016/S0168-583X(00)00169-5
    [70] Gomez S, Rizzo R, Pozzi-Mucelli M (1999) Zinc mapping in bone tissues by histochemistry and synchrotron radiation-induced X-ray emission: Correlation with the distribution of alkaline phosphatase. Bone 25: 33–38. doi: 10.1016/S8756-3282(99)00102-7
    [71] Ektessabi AI (2007) Applications of Synchrotron Radiation: Micro Beams in Cell Micro Biology and Medicine, Springer-Verlag Berlin Heidelberg.
    [72] Kalra S (2013) The distribution and pro-inflammatory impact of titanium debris accumulation in the peri-implant environment [Thesis]. University of Birmingham.
    [73] Ektessabi AM, Rokkum M, Johansson C, et al. (1998) Application of synchrotron radiation in investigation of metal-ion release from a hip replacement prosthesis. J Synchrotron Radiat 5: 1136–1138. doi: 10.1107/S0909049597020244
    [74] Vis RD (1988) Biomedical applications of proton induced X-ray emission. Scanning Microsc 2: 977–984.
    [75] Gomez-Morilla I, Simon A, Simon R, et al. (2006) An evaluation of the accuracy and precision of X-Ray microanalysis techniques using BCR-126A glass reference material. Nucl Instrum Meth B 249: 897–902. doi: 10.1016/j.nimb.2006.03.159
    [76] Mair LH (1995) Stain and subsurface degradation of dental composites as a function of structure and permeability: A clinical and laboratory study. Adv Dent Res 9: 457–461. doi: 10.1177/08959374950090041701
    [77] Preoteasa EA, Georgescu R, Ciortea C, et al. (2004) Standardless PIXE analysis of thick biomineral structures. Anal Bioanal Chem 379: 825–841.
    [78] Wätjen U, Maier-Komor P, Pengo R, et al. (1995) Intercalibration standards for accelerator based analytical techniques. Nucl Instrum Meth B 99: 376–379. doi: 10.1016/0168-583X(95)00047-X
    [79] Ambrose TM, Al-Lozi M, Scott MG (2000) Bone lead concentrations assessed by in vivo X-ray fluorescence. Clin Chem 46: 1171–1178.
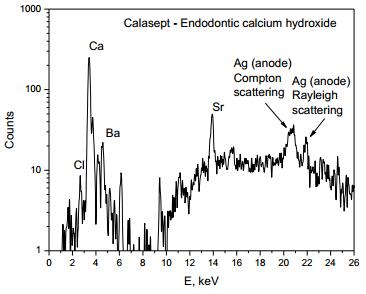
    [80] Suciu I, Preoteasa EA, Gurban D, et al. (2006) Potential of PIXE for the elemental analysis of calcium hydroxide used in dentistry. Rom Rep Phys 58: 569–582.
    [81] Borges AH, Guedes OA, Dorilêo MCGO, et al. (2014) Analysis of chemical elements and heavy metals in MTA Fillapex and AH Plus. Oral Health Dent Manag (OHDM) 13: 1007–1012.
    [82] Oliveira MG, Xavier CB, Demarco FF, et al. (2007) Comparative chemical study of MTA and Portland cements. Braz Dent J 18: 3–7. doi: 10.1590/S0103-64402007000100002
    [83] Dammaschke T, Gerth HU, Züchner H, et al. (2005) Chemical and physical surface and bulk material characterization of white ProRoot MTA and two Portland cements. Dent Mater 21: 731–738. doi: 10.1016/j.dental.2005.01.019
    [84] Song JS, Mante FK, Romanow WJ, et al. (2006) Chemical analysis of powder and set forms of Portland cement, gray ProRoot MTA, white ProRoot MTA, and gray MTA-Angelus. Oral Surg Oral Med O 102: 809–815. doi: 10.1016/j.tripleo.2005.11.034
    [85] Belío-Reyes IA, Bucio L, Cruz-Chavez E (2009) Phase composition of ProRoot mineral trioxide aggregate by X-ray powder diffraction. J Endodont 35: 875–878. doi: 10.1016/j.joen.2009.03.004
    [86] Grech L, Mallia B, Camilleri J (2013) Characterization of set intermediate restorative material, Biodentine, Bioaggregate and a prototype calcium silicate cement for use as root-end filling materials. Int Endod J 46: 632–641. doi: 10.1111/iej.12039
    [87] Gandolfi MG, Siboni F, Primus CM, et al. (2014) Ion release, porosity, solubility, and bioactivity of MTA Plus tricalcium silicate. J Endodont 40: 1–6.
    [88] Han L, Okiji T (2011) Uptake of calcium and silicon released from calcium silicate-based endodontic materials into root canal dentine. Int Endod J 44: 1081–1087. doi: 10.1111/j.1365-2591.2011.01924.x
    [89] Kum KY, Kim EC, Yoo YJ, et al. (2013) Trace metal contents of three tricalcium silicate materials: MTA Angelus, Micro Mega MTA and Bioaggregate. Int Endod J 39: 497–500. doi: 10.1016/j.joen.2012.11.037
    [90] Kinebuchi M, Matsuura A, Kiyono T, et al. (2016) Diagnostic copper imaging of Menkes disease by synchrotron radiation-generated X-ray fluorescence analysis. Sci Rep 6: 33247. doi: 10.1038/srep33247
    [91] Dobrowolski Z, Drewniak T, Kwiatek W, et al. (2002) Trace elements distribution in renal cell carcinoma depending on stage of disease. Eur Urol 42: 475–480. doi: 10.1016/S0302-2838(02)00400-1
    [92] Reddy SB, Charles MJ, Raju GJN, et al. (2003) Trace elemental analysis of carcinoma kidney and stomach by PIXE method. Nucl Instrum Meth B 207: 345–355. doi: 10.1016/S0168-583X(03)00463-4
    [93] Denker A, Bohne W, Rauschenberg J, et al. (2005) Materials analysis using fast ions. CAS-CERN Accelerator School and KVI: Specialised CAS Course on Small Accelerators. Zeegse, The Netherlands, 417–432. Available from:https://cas.web.cern.ch/.../files/lectures/zeegse-2005/denker.pdf.
    [94] Forslind B (1999) Biomedical applications of particle probes and X-ray analysis. Nucl Instrum Meth B 150: 150–157. doi: 10.1016/S0168-583X(98)01061-1
    [95] Garten RPH (1984) PIXE: Possibilities in elemental micro- and trace-analysis. TrAC-Trend Anal Chem 3: 152–157. doi: 10.1016/0165-9936(84)88009-7
    [96] Gilfrich JV (1978) Microanalysis and trace analysis, In: Herglotz H, Birks LS, X-Ray Spectrometry. Practical Spectroscopy Series 2, New York: Marcel Dekker, Inc., 393–411.
    [97] Jaklevic JM, Goulding FS (1978) Energy dispersion. In: Herglotz H, Birks LS, X-Ray Spectrometry. Practical Spectroscopy Series 2. New York: Marcel Dekker, Inc., 17–57.
    [98] Govil IM (2001) Proton induced X-ray emission-a tool for non-destructive trace element analysis. Curr Sci 80: 1542–1549.
    [99] IAEA (2003) Intercomparison of PIXE spectrometry software packages. IAEA-TECDOC-1342. Vienna: International Atomic Energy Agency.
    [100] Johansson SAE, Johannson TB (1976) Analytical application of particle induced X-ray emission. Nucl Instrum Method 137: 473–516. doi: 10.1016/0029-554X(76)90470-5
    [101] Lindh U, Tveit AB (1980) Proton microprobe determination of fluorine depth distributions and surface multielement characterization in dental enamel. J Radioanal Nucl Ch 59: 167–191. doi: 10.1007/BF02516846
    [102] Watt F, Grime GW (1995) The high-energy ion microprobe, In: Johansson SAE, Campbell JL, Malmqvist KG, Particle-Induced X-Ray Emission Spectrometry (PIXE), John Wiley & Sons, 101–166.
    [103] Legge GJF (1987) The limits of spatial resolution in PIXE. Nucl Instrum Meth B 22: 115–120. doi: 10.1016/0168-583X(87)90306-5
    [104] Lill JO, Harju L, Saarela KE, et al. (1999) Increased sensitivity in thick target particle induced X-ray emission analyses using dry ashing for preconcentration. Anal Chim Acta 378: 273–278. doi: 10.1016/S0003-2670(98)00630-8
    [105] Campbell JL (1995) Instrumentation, fundamentals, and quantification, In: Johansson SAE, Campbell JL, Malmqvist KG, Particle-Induced X-Ray Emission Spectrometry (PIXE), John Wiley & Sons, 19–100.
    [106] Demortier G, Nammour S (2008) In vivo PIXE-PIGE study of enhanced retention of fluorine in tooth enamel after laser irradiation. Nucl Instrum Meth B 266: 2408–2411. doi: 10.1016/j.nimb.2008.03.053
    [107] Grambole D, Neelmeijer C, Noll K, et al. (2000) 19F(p, p'γ)19F and 18O(p, γ)19F gamma-ray interferences studied on liquids. Nucl Instrum Meth B 161: 269–274.
    [108] Wätjen U, Prins H, Van Bijlen R, et al. (1990) A new PIXE chamber for highly reproducible and automatized operation. Nucl Instrum Meth B 49: 78–84. doi: 10.1016/0168-583X(90)90220-O
    [109] Maxwell JA, Teesdale WJ, Campbell JL (1995) The Guelph PIXE software package II. Nucl Instrum Meth B 95: 407–421 doi: 10.1016/0168-583X(94)00540-0
    [110] Ahlberg M, Akselsson R (1976) Proton-induced X-ray emission in the trace analysis of human tooth enamel and dentine. Int J Appl Radiat Isotopes 27: 279–290. doi: 10.1016/0020-708X(76)90145-9
    [111] Ziegler JF (1995) SRIM-the stopping and range of ions in matter-particle interactions with matter. Available from: http://www.srim.org/.
    [112] Bailey MJ, Coe S, Grant DM, et al. (2009) Accurate determination of the Ca/P ratio in rough hydroxyapatite samples by SEM-EDS, PIXE and RBS-a comparative study. X-Ray Spectrom 38: 343–347. doi: 10.1002/xrs.1171
    [113] Sjöland KA, Munnik F, Wätjen U (2000) Thick-target correction in PIXE for randomly inhomogeneous samples. Nucl Instrum Meth B : 264–268.
    [114] Smit Z (1987) Surface roughness correction in thick target PIXE analysis. Nucl Instrum Meth B 28: 567–570. doi: 10.1016/0168-583X(87)90504-0
    [115] Wätjen U, Bax H, Rähen J (1996) On the complementary use of ion beam techniques in the near surface analysis of implanted alloys. Nucl Instrum Meth B 118: 676–680. doi: 10.1016/0168-583X(95)01173-0
    [116] Cohen DD, Clayton E (1987) A database for thick target PIXE. Nucl Instrum Meth B 22: 59–63. doi: 10.1016/0168-583X(87)90294-1
    [117] Verón MG, Pérez PD, Suárez SG, et al. (2017) Study of the effect of common infusions on glass ionomers using the PIXE and RBS techniques. Nucl Instrum Meth B 412: 93–101. doi: 10.1016/j.nimb.2017.09.006
    [118] Vecchi R, Valli G, Chiari M, et al. (2004) An investigation on metal-free restorations by means of PIXE analysis. 10th International Conference on Particle-induced X-ray Emission and its Analytical Applications PIXE 2004, Portoroz, Slovenia.
    [119] Yamamoto H, Nomachi M, Yasuda K, et al. (2003) Fluorine mapping of teeth treated with fluorine-releasing compound using PIGE. Nucl Instrum Meth B 210: 388–394. doi: 10.1016/S0168-583X(03)01039-5
    [120] Yamamoto H, Nomachi M, Yasuda K, et al. (2007) Fluorine uptake into the human tooth from a thin layer of F-releasing material. Nucl Instrum Meth B 260: 194–200. doi: 10.1016/j.nimb.2007.02.024
    [121] Komatsu H, Yamamoto H, Matsuda Y, et al. (2011) Fluorine analysis of human enamel around fluoride-containing materials under different pH-cycling by μ-PIGE/PIXE system. Nucl Instrum Meth B 269: 2274–2277. doi: 10.1016/j.nimb.2011.02.042
    [122] Funato Y, Matsuda Y, Okuyama K, et al. (2015) A new technique for analyzing trace element uptake by human enamel. Dent Mater J 34: 240–245. doi: 10.4012/dmj.2014-127
    [123] Yagi K, Yamamoto H, Uemura R, et al. (2017) Use of PIXE/PIGE for sequential Ca and F measurements in root carious model. Sci Rep 7: 13450. doi: 10.1038/s41598-017-14041-4
    [124] Preoteasa EA, Georgescu R, Ciortea C, et al. (2004) Multivariate statistics and mean atomic number classification of dental composites as analyzed by PIXE. 10th International Conference on Particle induced X-ray Emission and its Analytical Applications PIXE 2004, Portoroz, Slovenia.
    [125] Preoteasa EA, Preoteasa ES, Ciortea C, et al. (2009) PIXE and PIGE assessment of in vivo elemental and physical changes of a composite from a dental filling. X-Ray Spectrom 38: 548–556. doi: 10.1002/xrs.1175
    [126] Preoteasa EA, Preoteasa ES, Harangus L, et al. (2010) Proton µ-PIXE mapping, AFM imaging and size statistics of mineral granules in a dental composite. X-Ray Spectrom 39: 208–215. doi: 10.1002/xrs.1251
    [127] Preoteasa EA, Preoteasa ES, Kuczumow A, et al. (2008) Broad beam- and micro-PIXE analysis of normal and in vitro demineralized dental enamel. X-ray Spectrom 37: 517–535. doi: 10.1002/xrs.1083
    [128] Wätjen U, Cavé H (1996) Reference materials in the context of calibration and quality control of PIXE analysis: The case of aerosol analysis. Nucl Instrum Meth B 109–110: 395–401.
    [129] Gomez S, Garcia A, Landete-Castillejos T, et al. (2016) Potential of the Bucharest 3 MV TandetronTM for IBA studies of deer antler mineralization. Nucl Instrum Meth B 371: 413–418. doi: 10.1016/j.nimb.2015.10.012
    [130] Gomez S, Preoteasa EA, Harangus L, et al. (2006) Micro-PIXE and histochemical studies of Zn and Ca distribution in normal bone. Nucl Instrum Meth B 249: 673–676. doi: 10.1016/j.nimb.2006.03.077
    [131] Fischer BE, Voss KO, Du G (2009) Targeted irradiation of biological cells using an ion microprobe-why a small beam spot is not sufficient for success. Nucl Instrum Meth B 267: 2122–2124. doi: 10.1016/j.nimb.2009.03.068
    [132] Niinomi M, Narushima T, Nakai M (2015) Advances in Metallic Biomaterials: Tissues, Materials and Biological Reactions, Springer-Verlag Berlin Heidelberg.
    [133] Johansson E, Lindh U (1987) Mercury in blood cells-altered elemental profiles: Toxic events in human exposure. Biol Trace Elem Res 12: 309–321. doi: 10.1007/BF02796688
    [134] Eggleston DW (1984) Effect of dental amalgam and nickel alloys on T-Iymphocytes: Preliminary report. J Prosthet Dent 51: 617–622. doi: 10.1016/0022-3913(84)90404-9
    [135] Lindh U, Hudecek R, Danersund A, et al. (2002) Removal of dental amalgam and other metal alloys supported by antioxidant therapy alleviates symptoms and improves quality of life in patients with amalgam-associated ill health. Neuroendocrinol Lett 23: 459–482.
    [136] Carvalho ML, Pinheiro T, Barreiros MA, et al. (1998) Amalgam components drift in teeth-toxicity risks: A preliminary approach. Nucl Instrum Meth B 136: 913–918.
    [137] Meesat R, Sudprasert W, Guibert E, et al. (2017) Micro-PIXE study of metal loss from dental amalgam. Nucl Instrum Meth B 404: 106–109. doi: 10.1016/j.nimb.2017.01.024
    [138] Tadic T, Jaksic M, Babic-Zivko J, et al. (1990) Diffusion of metals from crown into teeth. Nucl Instrum Meth B 49: 211–215. doi: 10.1016/0168-583X(90)90245-P
    [139] Brunell G, Lindh U (1982) Deposition of corrosion products from dowels on human dental root surfaces measured with proton microprobe technique. Nucl Instrum Meth B 197: 209–212. doi: 10.1016/0167-5087(82)90138-7
    [140] Simonoff M, Berdeu B, Llabador Y, et al. (1988) Micro-analysis of the composition of dental implants before and after implantation, In: Hildebrand HF, Champy M, Biocompatibility of Co-Cr-Ni Alloys, NATO ASI Series (Series A: Life Sciences), Boston, MA: Springer.
    [141] Ektessabi A, Shikine S, Kitamura N, et al. (2001) Distribution and chemical states of iron and chromium released from orthopedic implants into human tissues. X-Ray Spectrom 30: 44–48. doi: 10.1002/xrs.466
    [142] Passi P, Zadro A, Galassini S, et al. (2002) PIXE micro-beam mapping of metals in human peri-implant tissues. J Mater Sci-Mater M 13: 1083–1089. doi: 10.1023/A:1020309108950
    [143] Ektessabi AM, Shikine S, Hamdi M, et al. (2000) Friction wear and dissolution of orthopedic implant systems. Int J PIXE 10: 37–45. doi: 10.1142/S0129083500000067
    [144] Ektessabi AM, Mouhyi J, Louvette P, et al. (1997) Investigation of corrosion and ion release from titanium dental implant. Int J PIXE 7: 179–199. doi: 10.1142/S0129083597000229
    [145] Sugiyama Y, Ishibashi S, Sekiyama S, et al. (1999) Analysis of elements in the soft tissue covering titanium plates and screws for internal bone fixation by the PIXE method. Int J PIXE 9: 305–313. doi: 10.1142/S0129083599000401
    [146] Kumar S, Narayanan TS (2008) Corrosion behaviour of Ti-15Mo alloy for dental implant applications. J Dent 36: 500–507. doi: 10.1016/j.jdent.2008.03.007
    [147] Rautray TR, Das S, Rautray AC (2010) In situ analysis of human teeth by external PIXE. Nucl Instrum Meth B 268: 2371–2374. doi: 10.1016/j.nimb.2010.01.004
    [148] Tsuboi Y, Ektessabi AM, Sennerby L, et al. (1996) In vivo measurement of titanium release by PIXE. Nucl Instrum Meth B 109–110: 345–349.
    [149] Ektessabi AM, Kimura H (1995) Characterization of the surface of bio-ceramic thin films. Thin Solid Films 270: 335–340. doi: 10.1016/0040-6090(95)06714-0
    [150] Ektessabi AM, Hamdi M (2002) Characterization of calcium phosphate bioceramic films using ion beam analysis techniques. Surf Coat Tech 153: 10–15. doi: 10.1016/S0257-8972(01)01519-5
    [151] Pan J, Thierry D, Leygraf C (1996) Electrochemical impedance spectroscopy study of the passive oxide film on titanium for implant application. Electrochim Acta 41: 1143–1153. doi: 10.1016/0013-4686(95)00465-3
    [152] Scougall-Vilchis RJ, Hotta Y, Hotta M, et al. (2009) Examination of composite resins with electron microscopy, microhardness tester and energy dispersive X-ray microanalyzer. Dent Mater J 28: 102–112. doi: 10.4012/dmj.28.102
    [153] Asaka Y, Miyazaki M, Aboshi H, et al. (2004) EDX fluorescence analysis and SEM observations of resin composites. J Oral Sci 46: 143–148. doi: 10.2334/josnusd.46.143
    [154] Gerth HUV, Dammaschke T, Züchner H, et al. (2006) Chemical analysis and bonding reaction of RelyX Unicem and Bifix composites-a comparative study. Dent Mater 22: 934–941. doi: 10.1016/j.dental.2005.10.004
    [155] Oprea C, Szalanski PJ, Gustova MV, et al. (2013) Trace element distribution in human teeth by X-ray fluorescence spectrometry and multivariate statistical analysis. Rom Rep Phys 65: 452–459.
    [156] Ledesma AF, Santana FHB, Galindo LB, et al. (2016) Elemental chemical composition and phase analysis by means of PIXE, DSC, TGA, and DRX of MTA Angelus and white Potland cement. Rev Odont Mex 20: 182–186.
    [157] Fano L, Fano V, Ma W, et al. (2004) Hydrolytic degradation and cracks in resin-modified glass-ionomer cements. J Biomed Mater Res B 69: 87–93.
    [158] Pineda-Vargas CA, Eisa ME, Chikte UME, et al. (2004) High resolution nuclear microprobe elemental mapping of teeth enamel-dentine interface exposed to acidic conditions. Radiat Phys Chem 71: 937–942. doi: 10.1016/j.radphyschem.2004.04.122
    [159] Pineda-Vargas CA, Naidoo S, Eisa MEM (2007) Nuclear microanalysis of tooth enamel from a community in the Western Cape, South Africa. Nucl Instrum Meth B 260: 190–193. doi: 10.1016/j.nimb.2007.02.023
    [160] Zhou M, Drummond J, Hanley L (2005) Barium and strontium leaching from aged glass particle/resin matrix dental composites. Dent Mater 21: 145–155. doi: 10.1016/j.dental.2004.02.009
    [161] Ranne T (2008) Thermoplastic bioactive composite, with special reference to dissolution behavior and tissue response [Thesis]. University of Turku.
    [162] Van Meerbeek B, Dhem A, Goret-Niccaise M, et al. (1993) Comparative SEM and TEM examination of the ultrastructure of the resin-dentin interdiffusion zone. J Dent Res 72: 495–501. doi: 10.1177/00220345930720020501
    [163] Van Meerbeek B, Mohrbacher H, Celis JP, et al. (1993) Chemical characterization of the resin-dentib interface by micro-Raman spectroscopy. J Dent Res 72: 1423–1428. doi: 10.1177/00220345930720101201
    [164] Demortier G (1992) Twenty years of analysis of light elements at the LARN. Nucl Instrum Meth B 66: 51–64. doi: 10.1016/0168-583X(92)96141-K
    [165] Dimitriou P, Becker HW, Bogdanović-Radović I, et al. (2016) Development of a reference database for particle-induced gamma-ray emission spectroscopy. Nucl Instrum Meth B 371: 33–36. doi: 10.1016/j.nimb.2015.09.052
    [166] Mayer M (2003) Nuclear reaction analysis (NRA). Lecture at the Workshop on Nuclear Data for Science and Technology: Materials Analysis, Trieste, LNS0822004.
    [167] Chaudhri MA (1995) Nuclear analytical methods in calcified tissue research. Nutrition 11: 538–541.
    [168] Kapczinski MP, Gil C, Kinast EJ, et al. (2003) Surface modification of titanium by plasma nitriding. Mater Res 6: 265–271. doi: 10.1590/S1516-14392003000200023
    [169] Kapczinski MP, Kinast EJ, dos Santos CA (2003) Near-surface composition and tribological behaviour of plasma nitrided titanium. J Phys D Appl Phys 36: 1858–1863. doi: 10.1088/0022-3727/36/15/317
    [170] Aires MDM, Treter J, Filho AN, et al. (2016) Minimizing Pseudomonas aeruginosa adhesion to titanium surfaces by a plasma nitriding process. AIMS Biophys 4: 19–32. doi: 10.3934/biophy.2017.1.19
    [171] Moro R (1986) Research on trace elements in biomedicine carried out in Italy using nuclear accelerators, In: Onori S, Tabet E, Physics in Environment and Biomedical Research, World Scientific Publishing Co, 99–108.
    [172] Torrisi L (1986) Fluorine concentrations in teeth studied by 19F(p, αo)16O nuclear reaction, In: Onori S, Tabet E, Physics in Environment and Biomedical Research, World Scientific Publ Co, 137–141.
    [173] Coote GE, Cutress TW, Suckling GW (1997) Uptake of fluoride into developing sheep teeth, following the 1995 volcanic eruption of Mt Ruapehu, New Zealand. Nucl Instrum Meth B 130: 571–575. doi: 10.1016/S0168-583X(97)00250-4
    [174] Rizzutto MA, Tabacniks MH, Added N, et al. (2002) External PIGE-PIXE measurements at the Sao Paulo 8UD tandem accelerator. Nucl Instrum Meth B 190: 186–189. doi: 10.1016/S0168-583X(01)01216-2
    [175] Baijot-Stroobants J, Vreven J (1980) In-vivo uptake of topically applied fluoride by human dental enamel. Arch Oral Biol 25: 617–621. doi: 10.1016/0003-9969(80)90077-1
    [176] Baijot-Stroobants J, Vreven J (1979) Determination by charged particle activation of fluoride uptake in human dental enamel. Caries Res 13: 211–217. doi: 10.1159/000260402
    [177] Fano V, Shatel M, Tanzi ML (2007) Release phenomena and toxicity in polymer-based dental restorative materials. ABM 78: 190–197.
    [178] Sakai T, Oikawa M, Sato T (2005) External scanning proton microprobe-a new method for in-air elemental analysis. J Nucl Radiochem Sci 6: 69–71. doi: 10.14494/jnrs2000.6.69
    [179] Yamamoto H, Iwami Y, Yagi K, et al. (2014) Evaluation of caries progression in dentin treated by fluoride-containing materials using PIGE/PIXE system. 14th International Conference on Nuclear Microprobe Technology and Applications ICNMTA, Debrecen, Hungary.
    [180] Okuyama K, Komatsu H, Yamamoto H, et al. (2011) Fluorine analysis of human dentin surrounding resin composite after fluoride application by μ-PIGE/PIXE analysis. Nucl Instrum Meth B 269: 2269–2273. doi: 10.1016/j.nimb.2011.02.063
    [181] Sommer F, Engelmann C (1987) Possibilities for using the nuclear microprobe to determine carbon, nitrogen and other elements in teeth. Nucl Instrum Meth B 22: 128–132. doi: 10.1016/0168-583X(87)90309-0
    [182] Mihailescu IN, Preoteasa EA, Preoteasa ES (2016) Periodic surface structures induced on dental enamel by CO2 laser 10.6 µm radiation: A novel effect with potential applications in dentistry, In: Reimer A, Horizons in World Physics, New York: Nova Science Publishers, Inc., 113–153.
    [183] Svalbe ID, Chaudhri MA, Traxel K, et al. (1984) Surface profiling of trace elements across pre-carious lesion in teeth. Nucl Instrum Meth B 3: 651–653. doi: 10.1016/0168-583X(84)90456-7
    [184] Svalbe ID, Chaudhri MA, Traxel K, et al. (1984) Microprobe profiling of fluorine and other trace elements to large depths in teeth. Nucl Instrum Meth B 3: 648–650. doi: 10.1016/0168-583X(84)90455-5
    [185] Callen BW, Sodhi RNS, Griffiths K (1995) Examination of clinical surface preparations on titanium and Ti6Al4V by X-ray photoelectron spectroscopy and nuclear reaction analysis. Prog Surf Sci 50: 269–279. doi: 10.1016/0079-6816(95)00061-5
    [186] Ferdjani S, David D, Beranger G (1993) Anodic oxidation of titanium in phosphoric acid baths: Phosphorus incorporation into the oxide. J Alloy Compd 200: 191–194. doi: 10.1016/0925-8388(93)90493-7
    [187] Eke C, Er K, Segebade C, et al. (2017) Study of filling material of dental composites: An analytical approach using radioactivation. Radiochim Acta 106: 69–77.
    [188] Leung TC, Simpson PJ, Atkinson A, et al. (1995) Measurement of oxide thickness using a variable-energy positron beam. Appl Surf Sci 85: 292–294. doi: 10.1016/0169-4332(94)00346-7
    [189] Mohsen M, Gomaa E, Mazaid NA, et al. (2017) Synthesis and characterization of organic montmorillonite-polyvinylalcohol-co-polyacrylic nanocomposite hydrogel for heavy metal uptake. AIMS Mater Sci 4: 1122–1139. doi: 10.3934/matersci.2017.5.1122
    [190] Czanderna AW (1975) Methods of Surface Analysis, Amsterdam: Elsevier.
    [191] Bethge K, Kraft G, Kreisler P, et al. (2013) Medical applications of nuclear physics, Springer-Verlag Berlin Heidelberg.
    [192] Corn RM (2018) Modern Atomic Spectrometries: XRF, PIXE and RBS. Available from: https://www.chem.uci.edu/~unicorn/249/Handouts/XRF.pdf.
    [193] Bernsmann F (2007) ToF-SIMS investigations on dental implant materials and adsorbed protein films [Thesis]. Univ. Kaiserslautern.
    [194] Boudreault G (2002) Accurate ion beam analysis [Thesis]. Univ. Surrey.
    [195] Frank MJ (2013) Bioactive coating for titanium based bone anchored implants [Thesis]. Univ. Oslo.
    [196] Min-Qin R (2007) Nuclear microscopy: Development and applications in atherosclerosis, parkinson's disease and materials physics [Thesis]. Univ. Jyväskylä.
    [197] Peeper K, Moser M, Reichart P, et al. (2012) Non-Rutherford backscattering microscopy using 25 MeV protons. Nucl Instrum Meth B 273: 254–257. doi: 10.1016/j.nimb.2011.07.088
    [198] Petrascu M, Berceanu I, Brancus I, et al. (1984) A method for analysis and profiling of boron, carbon and oxygen impurities in semiconductor wafers by recoil atoms in heavy ion beams. Nucl Instrum Meth B 4: 396–401. doi: 10.1016/0168-583X(84)90585-8
    [199] Benninghoven A, Rüdenauer FG, Werner HW (1987) Secondary ion mass spectrometry: Basic concepts, instrumental aspects, applications, and trends, New York: Wiley.
    [200] Ninomiya S, Ichiki K, Yamada H, et al. (2009) Precise and fast secondary ion mass spectrometry depth profiling of polymer materials with large Ar cluster ion beams. Rapid Commun Mass Sp 23: 1601–1606. doi: 10.1002/rcm.4046
    [201] Hofmann S (2004) Sputter-depth profiling for thin-film analysis. Philos T R Soc A 362: 55–75. doi: 10.1098/rsta.2003.1304
    [202] Werner HW, von Rosenstiel AP (1984) Comparison of secondary ion mass spectrometry (SIMS) with electron microprobe analysis (EPMA) and other thin film analytical methods. J Phys Colloq 45: 103–113.
    [203] Guibert G, Irigaray JL, Moretto P, et al. (2006) Characterisation by PIXE-RBS of metallic contamination of tissues surrounding a metallic prosthesis on a knee. Nucl Instrum Meth B 251: 246–256. doi: 10.1016/j.nimb.2006.06.032
    [204] Ahmed NAG, Smith CW (1981) The application of Rutherford backscattering technique to dental hard tissue, In: Devreese JT, Lemmens LF, Van Doren VE, et al., Recent Developments in Condensed Matter Physics, Springer, Boston, MA, 321–328.
    [205] Lao J, Jallot E, Nedelec JM (2008) Strontium-delivering glasses with enhanced bioactivity: A new biomaterial for antiosteoporotic applications? Chem Mater 20: 4969–4973. doi: 10.1021/cm800993s
    [206] Ferrerz FJ, Alcaire M, Caballero-Hernández J, et al. (2014) Simultaneous quantification of light elements in thin films deposited on Si substrates using proton EBS (Elastic Backscattering Spectroscopy). Nucl Instrum Meth B 332: 449–453. doi: 10.1016/j.nimb.2014.02.124
    [207] Karlušic M, Fazinic S, Siketic Z, et al. (2017) Monitoring ion track formation using in situ RBS/c, ToF-ERDA, and HR-PIXE. Materials 10: 1041. doi: 10.3390/ma10091041
    [208] Azis SAA, Kennedy J, Murmu PP, et al. (2014) Structural and compositional characterization of ion beam sputtered hydroxyapatite thin films on Ti-6Al-4V. Asian J Appl Sci 7: 745–752. doi: 10.3923/ajaps.2014.745.752
    [209] Blind O, Klein LH, Dailey B, et al. (2005) Characterization of hydroxyapatite films obtained by pulsed-laser deposition on Ti and Ti-6Al-4V substrates. Dent Mater 21: 1017–1024. doi: 10.1016/j.dental.2004.12.003
    [210] Dostalova T, Himmlova L, Jelinek M, et al. (1995) Some biological and physical properties of laser deposited hydroxyapatite based films. Cell Mater 5: 3.
    [211] Varanasi VG, Ilyas A, Velten MF, et al. (2017) Role of hydrogen and nitrogen on the surface chemical structure of bioactive amorphous silicon oxynitride films. J Phys Chem B 121: 8991–9005. doi: 10.1021/acs.jpcb.7b05885
    [212] Kim BS, Kim JS, Park YM, et al. (2013) Mg ion implantation on SLA-treated titanium surface and its effects on the behavior of mesenchymal stem cell. Mat Sci Eng C-Mater 33: 1554–1560. doi: 10.1016/j.msec.2012.12.061
    [213] Günzel R, Mändl S, Richter E, et al. (1999) Corrosion protection of titanium by deposition of niobium thin films. Surf Coat Tech 116–119: 1107–1110.
    [214] Brazdes L, Petrascu M, Bordeanu C, et al. (1999) A method for elemental analysis of bones by recoiling atoms in heavy ion beams. Rom J Phys 44: 149–164.
    [215] Rizzutto MA, Added N, Tabacniks MH, et al. (2006) Teeth characterization using ion beam analysis. J Radioanal Nucl Ch 269: 683–687. doi: 10.1007/s10967-006-0286-3
    [216] Glauche V, Röhrich J, Bohne W, et al. (2011) Analysis of tooth surface elements by ion beam analysis. J Hard Tissue Biol 20: 99–106. doi: 10.2485/jhtb.20.99
    [217] Mine Y, Nakatani T, Okamoto K, et al. (2014) Impact of biomimetic diamond-like carbon coated titanium on osteoblast and osteoclast differentiation in vitro. J Photopolym Sci Tec 27: 373–378. doi: 10.2494/photopolymer.27.373
    [218] Slepička P, Hubáček T, Kolská Z, et al. (2013) The properties and application of carbon nanostructures, In: Yilmaz F, Polymer Science, London: InTech, 175–201.
    [219] Balaceanu M, Braic M, Macovei D, et al. (2002) Properties of titanium based hard coatings deposited by the cathodic arc method. J Optoelectron Adv M 4: 107–114.
    [220] Braic M, Braic V, Balaceanu M, et al. (2003) Microchemical and microstructural properties of metallic nitride and carbide hard coatings deposited by arc-evaporation. Rom Rep Phys 55: 275–282.
    [221] Galle P (1970) Sur une nouvelle méthode d'analyse cellulaire utilisant le phenomene d'emission ionique secondaire. Ann Phys Biol Med 4: 84–94.
    [222] Lodding A (1997) SIMS of Biomineralized Tissues: Present Trends and Potentials. Adv Dent Res 11: 364–379. doi: 10.1177/08959374970110040101
    [223] Linton RW, Goldsmith JG (1992) The role of secondary ion mass spectrometry (SIMS) in biological microanalysis: Technique, comparisons and prospects. Biol Cell 74: 147–160. doi: 10.1016/0248-4900(92)90021-R
    [224] Malmberg P, Nygren H (2008) Methods for the analysis of the composition of bone tissue, with a focus on imaging mass spectrometry (TOF-SIMS). Proteomics 8: 3755–3762. doi: 10.1002/pmic.200800198
    [225] Henss A, Rohnke M, El KT, et al. (2013) Applicability of ToF-SIMS for monitoring compositional changes in bone in a long-term animal model. J R Soc Interface 10: 20130332. doi: 10.1098/rsif.2013.0332
    [226] Frostell G, Larsson SJ, Lodding A, et al. (1977) SIMS study of element concentration profiles in enamel and dentin. Eur J Oral Sci 85: 18–21. doi: 10.1111/j.1600-0722.1977.tb00526.x
    [227] Norén JG, Lodding A, Odelius H, et al. (1983) Secondary ion mass-spectrometry of human deciduous enamel. Caries Res 17: 496–502. doi: 10.1159/000260709
    [228] Almhöjd US, Norén JG, Arvidsson A, et al. (2014) Analysis of carious dentine using FTIR and ToF-SIMS. Oral Health Dent Manag 13: 735–744.
    [229] Okazaki M, Hirata I, Matsumoto T, et al. (2005) Advantages of TOF-SIMS analysis of hydroxyapatite and fluorapatite in comparison with XRD, HR-TEM and FT-IR. Dent Mater J 24: 508–514. doi: 10.4012/dmj.24.508
    [230] Franca R, Samani TD, Bayade G, et al. (2014) Nanoscale surface characterization of biphasic calcium phosphate, with comparisons to calcium hydroxyapatite and β-tricalcium phosphate bioceramics. J Colloid Interf Sci 420: 182–188. doi: 10.1016/j.jcis.2013.12.055
    [231] Lu HB, Campbell CT, Graham DJ, et al. (2000) Surface characterization of hydroxyapatite and related calcium phosphates by XPS and TOF-SIMS. Anal Chem 72: 2886–2894. doi: 10.1021/ac990812h
    [232] Ni M, Ratner BD (2010) Differentiating calcium carbonate polymorphs by surface analysis techniques-an XPS and TOF-SIMS study. Surf Interface Anal 40: 1356–1361.
    [233] Crobu M, Rossi A, Mangolini F, et al. (2012) Chain-length-identification strategy in zinc polyphosphate glasses by means of XPS and ToF-SIMS. Anal Bioanal Chem 403: 1415–1432. doi: 10.1007/s00216-012-5836-7
    [234] Lin A, Mcintyre NS, Davidson RD (1992) Studies on the adhesion of glass-ionomer cements to dentin. J Dent Res 71: 1836–1841. doi: 10.1177/00220345920710111401
    [235] Chuang SF, Kang LL, Liu YC, et al. (2017) Effects of silane- and MDP-based primers application orders on zirconia-resin adhesion-A ToF-SIMS study. Dent Mater 33: 923–933. doi: 10.1016/j.dental.2017.04.027
    [236] Torrisi A, Torrisi V, Tuccitto N, et al. (2010) ToF-SIMS images and spectra of biomimetic calcium silicate-based cements after storage in solutions simulating the effects of human biological fluids. Int J Mass Spectrom 289: 150–161. doi: 10.1016/j.ijms.2009.10.010
    [237] Bernsmann F, Lawrence N, Hannig M, et al. (2008) Protein films adsorbed on experimental dental materials: ToF-SIMS with multivariate data analysis. Anal Bioanal Chem 391: 545–554. doi: 10.1007/s00216-008-2014-z
    [238] Bolles KM, Cheng F, Burk-Rafel J, et al. (2010) Imaging analysis of carbohydrate-modified surfaces using ToF-SIMS and SPRi. Materials 3: 3948–3964. doi: 10.3390/ma3073948
    [239] Viornery C, Chevolot Y, Léonard D, et al. (2002) Surface modification of titanium with phosphonic acid to improve bone bonding: Characterization by XPS and ToF-SIMS. Langmuir 18: 2582–2589. doi: 10.1021/la010908i
    [240] Eriksson C, Börner K, Nygren H (2006) Studies by imaging TOF-SIMS of bone mineralization on porous titanium implants after 1 week in bone. Appl Surf Sci 252: 6757–6760. doi: 10.1016/j.apsusc.2006.02.194
    [241] Hryniewicz T, Konarski P, Rokosz K, et al. (2011) SIMS analysis of hydrogen content in near surface layers of AISI 316L SS after electrolytic polishing under different conditions. Surf Coat Tech 205: 4228–4236. doi: 10.1016/j.surfcoat.2011.03.024
    [242] Graham DJ, Castner DG (2012) Multivariate analysis of ToF-SIMS data from multicomponent systems: The why, when, and how. Biointerphases 7: 1–12. doi: 10.1007/s13758-011-0001-y
    [243] Graham DJ, Wagner MS, Castner DG (2006) Information from complexity: Challenges of TOF-SIMS data interpretation. Appl Surf Sci 252: 6860–6868. doi: 10.1016/j.apsusc.2006.02.149
    [244] Hercules DM, Craig NL (1976) Composition of fluoridated dental enamel studied by X-ray photoelectron spectroscopy (ESCA). J Dent Res 55: 829–835. doi: 10.1177/00220345760550051901
    [245] Uchtmann H, Duschner H (1982) Electron spectroscopic studies of interactions between superficially applied fluorides and surface enamel. J Dent Res 61: 423–428. doi: 10.1177/00220345820610021201
    [246] Garrett SJ, Egdell RG, Rivière JC (1990) A comparative study of oxidation of Ti and CoTi by HREELS and XPS. J Electron Spectrosc 54: 1065–1074.
    [247] Delamar M (1990) Correlation between the isoelectric point of solid surfaces of metal oxides and X-ray photoelectron spectroscopy chemical shifts. J Electron Spectrosc 54: C11–C14.
    [248] Herman GS, Gao Y, Tran TT, et al. (2000) X-ray photoelectron diffraction study of an anatase thin film: TiO2(001). Surf Sci 447: 201–211. doi: 10.1016/S0039-6028(99)01186-3
    [249] Biwer BM, Bernasek SL (1986) A photoelectron and energy-loss spectroscopy study of Ti and its interaction with H2, O2, N2 and NH3. Surf Sci 167: 207–230. doi: 10.1016/0039-6028(86)90795-8
    [250] Mccafferty E, Wightman JP (1998) Determination of the concentration of surface hydroxyl groups on metal oxide films by a quantitative XPS method. Surf Interface Anal 26: 549–564. doi: 10.1002/(SICI)1096-9918(199807)26:8<549::AID-SIA396>3.0.CO;2-Q
    [251] Mccafferty E, Wightman JP (1999) An X-ray photoelectron spectroscopy sputter profile study of the native air-formed oxide film on titanium. Appl Surf Sci 143: 92–100. doi: 10.1016/S0169-4332(98)00927-1
    [252] Ferrer S, Somorjai GA (1980) UPS and XPS studies on the chemisorption of O2, H2 and H2O on reduced and stoichiometric SrTiO3(111) surfaces: The effects of illumination. Surf Sci 94: 41–56. doi: 10.1016/0039-6028(80)90155-7
    [253] Carley AF, Chalker PR, Rivière JC, et al. (1987) The identification and characterisation of mixed oxidation states at oxidised titanium surfaces by analysis of X-ray photoelectron spectra. J Chem Soc Faraday Trans 1 18: 351–370.
    [254] Merritt K, Wortman RS, Millard M, et al. (1983) XPS Analysis of 316 LVM corroded in serum and saline. Biomater Med Devices Artif Organs 11: 115–124. doi: 10.3109/10731198309118800
    [255] Rokosz K, Hryniewicz T, Matýsek D, et al. (2016) SEM, EDS and XPS analysis of the coatings obtained on titanium after plasma electrolytic oxidation in electrolytes containing copper nitrate. Materials 9: 318–330. doi: 10.3390/ma9050318
    [256] Rokosz K, Hryniewicz T, Raaen S (2017) SEM, EDS and XPS analysis of nanostructured coating formed on NiTi biomaterial alloy by plasma electrolytic oxidation (PEO). Tehnički Vjesnik 24: 193–198.
    [257] Kang BS, Sul YT, Oh SJ, et al. (2009) XPS, AES and SEM analysis of recent dental implants. Acta Biomater 5: 2222–2229. doi: 10.1016/j.actbio.2009.01.049
    [258] Guastaldi FPS, Yoo D, Marin C, et al. (2013) Plasma treatment maintains surface energy of the implant surface and enhances osseointegration. Int J Biomater 2013: 354125.
    [259] Korotin DM, Bartkowski S, Kurmaev EZ, et al. (2012) Surface characterization of titanium implants treated in hydrofluoric acid. J Biomater Nanobiotechnol 3: 87–91. doi: 10.4236/jbnb.2012.31011
    [260] Chrcanovic BR, Pedrosa AR, Martins MD (2012) Chemical and topographic analysis of treated surfaces of five different commercial dental titanium implants. Mater Res 15: 372–382. doi: 10.1590/S1516-14392012005000035
    [261] Sartoretto SC, Alves ATN, Resende RFB, et al. (2015) Early osseointegration driven by the surface chemistry and wettability of dental implants. J Appl Oral Sci 23: 279–287. doi: 10.1590/1678-775720140483
    [262] He S, Zhou P, Wang L, et al. (2014) Antibiotic decorated titanium with enhanced antibacterial activity through adhesive polydopamine for dental/bone implant. J R Soc Interface 11: 20140169
    [263] Van Raemdonck W, Ducheyne P, De Meester P (1984) Auger electron spectroscopic analysis of hydroxyapatite coatings on titanium. J Am Ceram Soc 67: 381–384. doi: 10.1111/j.1151-2916.1984.tb19721.x
    [264] Takadama H, Kim HM, Kokubo T, et al. (2001) XPS study of the process of apatite formation on bioactive Ti-6Al-4V alloy in simulated body fluid. Sci Technol Adv Mat 2: 389–396. doi: 10.1016/S1468-6996(01)00007-9
    [265] Combes C, Rey C, Frèche M (1998) XPS and IR study of dicalcium phosphate dihydrate nucleation on titanium surfaces. Colloid Surface B 11: 15–27. doi: 10.1016/S0927-7765(98)00014-9
    [266] Wieliczka DM, Spencer P, Legeros RZ (1996) Surface spectroscopy of apatitic materials: Limitations and concerns. J Dent Res 75: 1865–1870. doi: 10.1177/00220345960750110801
    [267] Konishi K, Kambara M, Noshi H, et al. (1987) X-ray photoelectron spectroscopy (ESCA) study on the surface of hydroxyapatite. J Osaka Dent Univ 21: 1–8.
    [268] Suetsugu Y, Hirota K, Fujii K, et al. (1996) Compositional distribution of hydroxyapatite surface and interface observed by electron spectroscopy. J Mater Sci 31: 4541–4544. doi: 10.1007/BF00366349
    [269] Kieswetter K, Bauer TW, Brown SA, et al. (1994) Characterisation of calcium phosphate powders by ESCA and EDXA. Biomaterials 15: 183–188. doi: 10.1016/0142-9612(94)90065-5
    [270] Coelho PG, Coimbra ME, Ribeiro C, et al. (2009) Physico/chemical characterization and preliminary human histology assessment of a β-TCP particulate material for bone augmentation. Mat Sci Eng C-Mater 29: 2085–2091. doi: 10.1016/j.msec.2009.04.013
    [271] Sosulnikov MI, Teterin YA (1992) X-ray photoelectron studies of Ca, Sr and Ba in their oxides and carbonates. J Electron Spectrosc 102: 101–116.
    [272] Wu CC, Wei CK, Ho CC, et al. (2015) Enhanced hydrophilicity and biocompatibility of dental zirconia ceramics by oxygen plasma treatment. Materials 8: 684–699. doi: 10.3390/ma8020684
    [273] Cheng Q, Jiang L, Tang Z (2014) Bioinspired layered materials with superior mechanical performance. Accounts Chem Res 47: 1256–1266. doi: 10.1021/ar400279t
    [274] Sennou HE, Lebugle AA, Grégoire GL (1999) X-ray photoelectron spectroscopy study of the dentin-glass ionomer cement interface. Dent Mater 15: 229–237. doi: 10.1016/S0109-5641(99)00036-6
    [275] Thompson VP, Edler TL, Davis GD (1992) XPS characterisation of dentin and dentin treated with bonding conditioners. J Adhesion 39: 157–171. doi: 10.1080/00218469208026547
    [276] Deslandes Y, Pleizier G, Alexander D (1998) XPS and SIMS characterization of segmented polyurethanes containing two different soft segments. Polymer 39: 2362–2366.
    [277] Yoshida Y, Inoue S (2012) Chemical analyses in dental adhesive technology. Jpn Dent Sci Rev 48: 141–152. doi: 10.1016/j.jdsr.2012.03.001
    [278] Maachou H, Genet MJ, Aliouche D, et al. (2013) XPS analysis of chitosan-hydroxyapatite biomaterials: From elements to compounds. Surf Interface Anal 45: 1088–1097. doi: 10.1002/sia.5229
    [279] Lawrie G, Keen I, Drew B, et al. (2007) Interactions between alginate and chitosan biopolymers characterized using FTIR and XPS. Biomacromolecules 8: 2533–2541. doi: 10.1021/bm070014y
    [280] Landis WJ, Martin JR (1984) X-ray photoelectron spectroscopy applied to gold-decorated mineral standards of biological interest. J Vac Sci Technol A 2: 1108–1111. doi: 10.1116/1.572680
    [281] Bianconi A (1980) Surface X-ray absorption spectroscopy: Surface EXAFS and surface XANES. Appl Surf Sci 6: 392–418. doi: 10.1016/0378-5963(80)90024-0
    [282] Newville M (2004) Fundamentals of XAFS. Consortium for Advanced Radiation Sources, University of Chicago, USA.
    [283] Lytle FW (1999) The EXAFS family tree: A personal history of the development of extended X-ray absorption fine structure. J Synchrotron Radiat 6: 123. doi: 10.1107/S0909049599001260
    [284] George GN, Singh SP, Hoover J, et al. (2009) The chemical forms of mercury in aged and fresh dental amalgam surfaces. Chem Res Toxicol 22: 1761–1764. doi: 10.1021/tx900309c
    [285] Uo M, Asakura K, Tamura K, et al. (2008) XAFS analysis of Ti and Ni dissolution from pure Ti, Ni–Ti alloy, and SUS304 in soft tissues. Chem Lett 37: 958–959. doi: 10.1246/cl.2008.958
    [286] Lameiras FS, Barrea RA, Silva VV, et al. (2005) Investigation of the incorporation of zirconium into the hydroxyapatite structure of zirconia hydroxyapatite composites and zirconium hydroxyapatite powders. Proceedings of COBEM 2005 18th International Congress of Mechanical Engineering, Ouro Preto, MG.
    [287] Deng H, Qiu H, Shia G (1995) EXAFS of nanophase zirconia stabilized by yttria. Physica B 208–209: 591–592.
    [288] Martin RA, Twyman HL, Rees GJ, et al. (2012) An examination of the calcium and strontium site distribution in bioactive glasses through isomorphic neutron diffraction, X-ray diffraction, EXAFS and multinuclear solid state NMR. J Mater Chem 22: 22212. doi: 10.1039/c2jm33058j
    [289] Onodera Y, Kohara S, Masai H, et al. (2017) Formation of metallic cation-oxygen network for anomalous thermal expansion coefficients in binary phosphate glass. Nat Commun 8: 1–8. doi: 10.1038/s41467-016-0009-6
    [290] Pickup DM, Moss RM, Qui D, et al. (2009) Structural characterization by X-ray methods of novel antimicrobial gallium-doped phosphate-based glasses. J Chem Phys 130: 064708. doi: 10.1063/1.3076057
    [291] Pickup DM, Neel EAA, Moss RM, et al. (2008) Ti K-edge XANES study of the local environment of titanium in bioresorbable TiO2–CaO–Na2O–P2O5 glasses. J Mater Sci-Mater M 19: 1681–1685. doi: 10.1007/s10856-007-3342-9
    [292] Ingall ED, Brandes JA, Diaz JM, et al. (2011) Phosphorus K-edge XANES spectroscopy of mineral standards. J Synchrotron Radiat 18: 189–197. doi: 10.1107/S0909049510045322
    [293] Cosmidis J, Benzerara K, Nassif N, et al. (2015) Characterization of Ca-phosphate biological materials by scanning transmission X-ray microscopy (STXM) at the Ca L2,3-, P L2,3- and C K-edges. Acta Biomater 12: 206–269.
    [294] Andrews JC, Meirer F, Liu Y, et al. (2011) Transmission X-ray microscopy for full-field nano-imaging of biomaterials. Microsc Res Techniq 74: 671–681. doi: 10.1002/jemt.20907
    [295] Moss RM, Pickup DM, Ahmed I, et al. (2008) Structural characteristics of antibacterial bioresorbable phosphate glass. Adv Funct Mater 18: 634–639. doi: 10.1002/adfm.200700721
    [296] Knowles J (2015) Phosphate based glasses and their application in biomaterials and tissue engineering. Biobone Symposium, Santiago de Compostela, Spain.
    [297] Liou SC, Chen SY, Lee HY, et al. (2004) Structural characterization of nano-sized calcium deficient apatite powders. Biomaterials 25: 189–196. doi: 10.1016/S0142-9612(03)00479-4
    [298] Uo M, Asakura K, Yokoyama A, et al. (2005) Analysis of titanium dental implants surrounding soft tissue using X-ray absorption fine structure (XAFS) analysis. Chem Lett 34: 776–777. doi: 10.1246/cl.2005.776
    [299] Eanes ED, Powers L, Costa JL (l981) Extended X-ray absorption fine structure (EXAFS) studies on calcium in crystalline and amorphous solids of biological interest. Cell Calcium 2: 251–262.
    [300] Jeynes C, Bailey MJ, Bright NJ, et al. (2012) "Total IBA"-Where are we? Nucl Instrum Meth B 271: 107–118. doi: 10.1016/j.nimb.2011.09.020
    [301] Watt F (1997) The nuclear microprobe: A unique instrument. Nucl Instrum Meth B 130: 1–8. doi: 10.1016/S0168-583X(97)00164-X
  • This article has been cited by:

    1. Barbara Lapinska, Jacek Rogowski, Joanna Nowak, Joseph Nissan, Jerzy Sokolowski, Monika Lukomska-Szymanska, Effect of Surface Cleaning Regimen on Glass Ceramic Bond Strength, 2019, 24, 1420-3049, 389, 10.3390/molecules24030389
    2. M. Grdeń, Non-classical applications of chemical analysis based on nuclear activation, 2020, 323, 0236-5731, 677, 10.1007/s10967-019-06977-w
    3. Yaming Wang, Masahiro Okada, Shi Chao Xie, Yu Yang Jiao, Emilio Satoshi Hara, Hiroaki Yanagimoto, Takumi Fukumoto, Takuya Matsumoto, Immediate soft-tissue adhesion and the mechanical properties of the Ti–6Al–4V alloy after long-term acid treatment, 2021, 9, 2050-750X, 8348, 10.1039/D1TB00919B
    4. Iga Wawrzyk-Bochenek, Michał Łobacz, Sławomir Wilczyński, Mansur Rahnama, Justyna Szulc, Adam Konka, Anna Wawrzyk, Evaluation of the Tooth Surface after Irradiation with Diode Laser Applied for Removal of Dental Microorganisms from Teeth of Patients with Gingivitis, Using X-ray Photoelectron (XPS) and Optical Profilometry (OP), 2022, 11, 2077-0383, 6840, 10.3390/jcm11226840
    5. Katarzyna Kaczmarek, Andrzej Leniart, Barbara Lapinska, Slawomira Skrzypek, Monika Lukomska-Szymanska, Selected Spectroscopic Techniques for Surface Analysis of Dental Materials: A Narrative Review, 2021, 14, 1996-1944, 2624, 10.3390/ma14102624
  • Reader Comments
  • © 2018 the Author(s), licensee AIMS Press. This is an open access article distributed under the terms of the Creative Commons Attribution License (http://creativecommons.org/licenses/by/4.0)
通讯作者: 陈斌, bchen63@163.com
  • 1. 

    沈阳化工大学材料科学与工程学院 沈阳 110142

  1. 本站搜索
  2. 百度学术搜索
  3. 万方数据库搜索
  4. CNKI搜索

Metrics

Article views(7868) PDF downloads(1069) Cited by(5)

Article outline

Figures and Tables

Figures(5)  /  Tables(5)

/

DownLoad:  Full-Size Img  PowerPoint
Return
Return

Catalog